Availableonlineatwww.sciencedirect.com
http://www.revistas.usp.br/rai RAIRevistadeAdministraçãoeInovação13(2016)29–38
Why
Brazil
does
not
innovate:
a
comparison
among
nations
Karen
Esteves
∗,
Paulo
Roberto
Feldmann
UniversidadedeSãoPaulo(USP),SãoPaulo,SP,Brazil
Received26October2015;accepted2January2016 Availableonline16May2016
Abstract
Inthispaper,weanalyzetherelevanceofinnovationconcerningtheemergenceofimportantchangesinthesociety.Inordertoverifywhichare themostrelevantfactorswhenitcomestotheallocationofcountriesinaninnovationranking(GlobalInnovationIndex),weaccomplisheda quantitativestudy,inwhichtheprocedureofmultiplelinearregressionwasused.Thesampleofourstudycomprised33countriesandtheanalysis ofthetheoreticalframeworkwascarriedoutconducivetothecreationofsixindependentvariables.Asaresult,thevariables“GDPpercapita”, “PublicexpendituresonR&D”,“Exportsofhigh-techgoods”,“Publicexpendituresoneducation”,“Numberoflargecompanies”and“Numberof patents”areindescendingordertheonesmostrelatedtotheinnovationlevelreachedbysomecountries.Theonlyvariablenegativelycorrelated toinnovationisthenumberofpatentsregisteredinadeterminedcountry;inotherwords,onemayconcludethatpatentsarenotthemostrelevant indicatorlinkedwiththedevelopmentofinnovation.Wealsoemphasizetheroleplayedbythegovernmentwhenprovidingafavorableinstitutional environmentinordertoencourageandsupportinnovation.
©2016DepartamentodeAdministrac¸˜ao,FaculdadedeEconomia,Administrac¸˜aoeContabilidadedaUniversidadedeS˜aoPaulo–FEA/USP. PublishedbyElsevierEditoraLtda.ThisisanopenaccessarticleundertheCCBYlicense(http://creativecommons.org/licenses/by/4.0/).
Keywords:Innovation;CountriesBrazil;Governments;GlobalInnovationIndex
Introduction
Whenanalyzingthehistoricaleventsthattookplaceinpast centuries,onecannoticethatthe revolutionsthatoccurred in humanity were predominantly followed – or preceded – by changes and, consequently, by improvements in the way to manufacturenewproducts,toprocessactivitiesandto adminis-tratethem.Thesechangesarose,therefore,duetotechnological advances,whoseemergencecausedtransformationscapableof changingthelivelihoodsofthepopulation,whostartednotonly toadapttothenewtechnologicalparadigm,butalsotodemand fornewproductsandservicesthatcouldprovideimprovements inthelifequality.
Itisnothardtomentionexamplesrelatedtosuch technolog-icalchanges.Whenthinkingabout,forinstance,theemergence oftelephonyandelectricityandtherevolutionregardingmass
∗Correspondingauthor.
E-mail:[email protected](K.Esteves).
PeerReviewundertheresponsibilityofDepartamentodeAdministrac¸ão, FaculdadedeEconomia,Administrac¸ãoeContabilidadedaUniversidadede SãoPaulo–FEA/USP.
production, onecandeducethatsucheventswereresponsible for the socialand economic transformations that marked the societyinseveralmoments–fromthediscoveryofpenicillin as a powerfulantibiotic in the beginning of the last century tothetechnologyusedinwarartilleriesduringthetwoworld wars.
Itisknown,however,thatthediscoveriesmadebyisolated inventors,e.g.GrahamBellintelephonyandtheWrightBrothers inaviation,donothappenpresentlyinthesameway.Duetothe complexitythattechnologyhasreachedoverthepastyears, inno-vativeprojectsstartbeingdevelopedandstructuredbyspecific teams focused onthe development of newproducts, services andbusinessmodels.Theappreciationattachedtothefigureof theinventornolongerexistsinthecurrentsociety–thereare nostrongevidencesofinventorsthat,alone,createtechnologies thatleadtobreakthroughinnovations.
In the sameway that inventorswere subject toinnovative ideas in the past that became the starting point for original discoveries, current innovators are subject to (and/or aligned with) companies, which have the capacity to supply all the necessaryfacilitiestostimulatethedevelopmentofinnovation. Such facilities involve the provision of proper infrastructure, researchlaboratoriesanddevelopmentcenters,whileproviding http://dx.doi.org/10.1016/j.rai.2016.04.002
1809-2039/©2016DepartamentodeAdministrac¸˜ao,FaculdadedeEconomia,Administrac¸˜aoeContabilidadedaUniversidadedeS˜aoPaulo–FEA/USP.Published byElsevierEditoraLtda.ThisisanopenaccessarticleundertheCCBYlicense(http://creativecommons.org/licenses/by/4.0/).
the necessary financial support, which is indispensable to financethedevelopmentofprojects.
Thereare certainly internal factorswithin acompanythat mayfacilitateorhindertheemergenceofinnovation.Aculture forinnovation,forexample,isconsiderednowadaysanessential factortofosterinnovationincompanies–withoutsuchculture ofinnovationandtechnologydevelopment,acompanymayturn intoabusinessthatonlyimitatestechnologiesdevelopedbyits competitors; that way, it tends to remain in the market only tosurvive,nottocompeteandprosper.Asmentionedearlier, theestablishmentofaproperinfrastructureandmanagementto spreadtechnologyisthekeyfactortodevelopinnovationwithin acompany.
Itis,however,commontoforgetthatthereareexternalfactors thatcanalsoboostand/orhindertheemergenceofinnovation. Suchfactorscanbeattributedtospecificinstitutional character-isticsofthecountriesinwhichinnovativecompaniesoriginate from.Thesecharacteristics canbeidentifiedbyincentivesfor innovation(e.g.taxincentives)andalsobypublicexpenditures onResearch&Development(R&D),whichisanaspectstrongly relatedtoinnovation.
Weintendto,therefore,pointoutinthisstudy,basedon com-parativeobservations,the maindifferences thereare between Brazil,notaveryinnovativecountryaccordingtointernational rankingsthatallocatenationsaccordingtothedifferentlevelsof innovation,andothercountries.Throughtheselectionof vari-ables related to innovation, we intend to demonstrate herein which are the factorsthat influence innovation more signifi-cantlyandwhichofthemdemandformoreinvestmentsinorder toboosttechnologyandinnovation.
Researchissueandobjectives
As mentioned earlier, severalauthors (Davila, Epstein, & Shelton, 2007;Dyer,Gregersen,&Christensen,2012;Kelley & Littman, 2007; Maital &Seshadri, 2013; Midgley, 2009), when exploring theuniverse designed byandfor innovation, tendtoemphasizeinternalissues–withinthecompany–related toinnovation,neglectingmanytimesthestrongexternal influ-ence,whichseemstobe attimes morerelevant thaninternal issues. We believe, therefore, that external factors related to nationalpolicies,economicdevelopmentandincentiveto inno-vationdeservesomeattention.Thatway,wewillnotdealwith issuesregardingcompanies,norwithincompanies,becausewe consider that external issues can be the main drivers for the developmentofinnovationincountries.
WhentalkingonlyaboutBrazil,itispossibletofind infor-mationthat justify the delay (and/or the lack) of innovation. Thereisinthecountrynoeffectiveindustrialpolicythatboosts thedevelopmentofnationaltechnologies.In fact,import sub-stitutionpoliciesimplementedduringthemilitaryregimewere notassuccessfulastheonesinEastAsiancountries.InBrazil, therewasnopolicypreservingthedevelopmentofproperhuman resourcestocontinuethetechnologicalandscientificprogress. Besides,theendofthemarketreservedidnotprovideaproper timeperiod sothatBrazilianentrepreneurscouldadapt tothe newmarketconditions.
WhenanalyzingindexesprovidedbytheWorldBank1and OECD,2onerealizesthatBrazilisinaworsepositionthanother developedcountrieswhenanalyzingdatarelatedtothenumber ofpatentsandscientificpublicationandthenumberofstudents graduatedinsciences,technologyandengineering.Wediscuss, however,therelevanceofsuchaspectsforthedevelopmentof innovation,aswellasthemostrelevantonestopredictthelevel ofinnovationofcountries.
The Brazilian technological delay does not seem to be isolated in Latin America; the delay of Latin American countriesoccursduetogeographicandmicroeconomicaspects (Feldmann,2009).Itisimportanttoemphasizetheneedtomake comparisons between countries to evaluate the performance regardinginnovation;whencomparedtootherLatinAmerican countries,Brazilhasasuperiorperformanceintermsofpublic expendituresonR&D.3Thecountryinvests1.16%ofitsGDPin activitiesrelatedtoresearchanddevelopment;Argentineinvests 0.62%;Mexico,0.46%,Chile,0.42%;andUruguay,0.40%.Not by chance,intherankingpublished bytheFinancialTimes,4 fromthe500largestcompaniesintheworld,onlythreeLatin Americancountriesarerepresented:Brazil,ChileandMexico. When comparing Brazil and the United States, for example, the investment of the USAinR&D is 41.9%largerthan the investmentsinBrazil.
Some findings justify the delay of LatinAmerica in tech-nologicalandinnovationareasthat gobeyondtheinvestment of GDP on R&D. The companies of these countries are not veryactiveinhigh-techsectors,thegovernmentsdonotfoster aproperinstitutionalenvironmentfortheemergenceof innova-tionandthereisstillapredominanceofimportedtechnologies, whichlimitsthearticulationbetweenscientificandtechnology activitiesinLatinAmericanregions.Anothercircumstancethat justifiesthedelay andunderdevelopmentoftechnology isthe abundanceof naturalresources alignedwithcheapworkforce (Feldmann,2009).Thefocusonnaturalresourcesbecomesvery clearwhenanalyzingthemostinternationalizedBrazilian com-panies; from the ten largestmultinationals, four of them are directlyrelatedtotheexploitation ofnatural resources(FDC, 2013).5
Itisalsoimportanttomentiontheabsenceofeffective sup-porttosmall-andmedium-sizedBraziliancompanies;regular expendituresonR&Darefeasibleonlyinlargecompaniesdue tothelackofgovernmentincentivesdirectedtosmaller com-panies (Prochnik &Araújo, 2005).Even thoughthere isone specific legislation inBrazil that aims to promote tax incen-tivestoinnovativecompanies(Law11.196/05),suchincentives only approach joint-stock companies – in otherwords, large companies thatare usuallysubsidiariesof largemultinational corporations. Such law also presents a certain contradiction regardingthe normativerulingthat forbidstheoutsourcingof
1http://data.worldbank.org/indicator 2http://stats.oecd.org/
3http://data.worldbank.org/indicator/GB.XPD.RSDV.GD.ZS 4http://www.ft.com/intl/indepth/ft500
R&Dactivities.Itmeansthat,inordertogettaxincentives,the companyhastodevelopthewholeinnovation processwithin itsfacilities–theparadoxisthatinnovationdemands interac-tionwithothercompanies,laboratories,universities,andsoon (MoreiraFilho,2015).
Onecanconclude,basedontheinformationpresentedinthis section,thatthemainobjectiveofthisresearchistodemonstrate, bymeansofaquantitativestudy,thefactors(variables)thatare themostrelevantonesregardingthedevelopmentofinnovation incountries, especiallyin Brazil. With the results, it will be possibletoanalyzeanddiscussthefactorsthatshouldbegetting moreinvestmentsandattentioninordertoboostinnovationin Brazil.
Theoreticalframework
There are several definitions regarding the implications restrainedintheterm“innovation”.Sincetheaimofthispaper isnottodiscussthedifferentdefinitionsthere,weconsider inno-vationthepracticalrefiningandthedevelopmentofanoriginal inventiontoatechniqueor usableproduct, oras aprocessin whichcreativityisappliedinallprocessesofthevaluechainin ordertodevelopnewandbetterwaystocreatevaluefor cos-tumers(Maital&Seshadri,2013).Itisimportanttoremember that classic competitiveadvantages, such as low salaries and abundantnaturalresources,arenolongerthemostrelevantones towardglobalcompetition,whichaffectstheeconomyby con-solidating technologicaladvances and innovation (Feldmann, 2015).
It is possible to relate several factors to the development of innovation ina certain country. In the Brazilian case, for instance,onemaymentionthe lackof qualifiedworkforce, a lowregisterofpatentsandaloweducationallevel(Feldmann, 2015).Thereare,however,otherauthorsconsideringdifferent variablesas the most relevant ones regarding the emergence of innovation,who usedifferent methodologiestojustify the technologicaldevelopment.Inthisstudy,however,weselected someauthorsthatpointoutvariablesrelatedtothedevelopment of innovationwhose measurementcould be accomplishedby usingsecondarydata.Thevariablesthatwillbeanalyzedinthis studyare:(i)numberoflargecompanies,(ii)GDPpercapita, (iii)publicexpendituresoneducation,(iv)publicexpenditures onR&D,(v)performanceofstudentsevaluatedbyPISA,(vi) exportsofhigh-techproducts,(vii)numberofpatentsand(viii) numberofgraduatedstudentsinscienceandtechnology. Innovationandlargecompanies
Accordingtostatementsapproachedintheprevioussection, largecompaniesaretheonesthatinnovatethemost,notduetoa superiorefficiencyofhumanresources,butduetotheavailability offinancialresources andthepossibilitytotakeriskswithout goingbankrupt.
PorterandStern(2002) emphasizethat a properindicator used to verify the performance of the innovative ability of a country is the analysis of business clusters. The authors assert that companies need to be grouped in clusters, since
the intercompany cooperation influences the emergence of technologyandinnovation.
Botelho,Maia, andPires(2012)pointouttherelevanceof small companies in innovative activities – and still support the assumption that small companies tend to invest more in innovation (proportionally) than large companies. They do notneglect,however,thefactthattheinnovationratetendsto increase according to the size of companies. Stiglitz (2003) remembers that banks hardly finance R&D projects of small and/ornewcompanies.
Datarelatedtothenumberofbusinessclusterscouldnotbe collectedinthisresearch.Therefore,wechosetousedata pro-videdbytheFinancialTimeswhenclassifyingandidentifying the500largestcompaniesintheworld.Thisrankingidentified companies derived from 33 countries.Ten companies repre-sentBrazil:Ambev,Petrobras,Vale,ItaúUnibanco,Bradesco, BancodoBrasil,Itausa,TelefBrasil,SantanderBrasilandSouza Cruz.ThesecompaniesdemonstratethestrengthoftheBrazilian bankingsectoranditsimportanceintheworldeconomy. InnovationandGDPpercapita
When elaborating this study, we analyzed some scientific papers that affirmed the existence of a relationship between innovationandGDPpercapita.Inaninterviewconductedwith thedirectorof Sebrae6,aBraziliansupportservicefor micro-andsmall-sizedcompanies,itwaspossibletoperceiveastrong relationshipbetweenincreasesintheGDPandtheconsequent increase of innovation in micro- and small-sized companies. Stiglitz(2003)emphasizesthestrongconnectionbetween tech-nologyandGDPwhenaffirmingthatforalleconomicgrowth processesthetechnologicalprogressiscrucial–thatway,every changeintoday’slivingstandardsoccursduetotechnology.
TherelationshipbetweeninnovationandGDPpercapitacan benoticedindifferentways.Theanalysisofthemostinnovative countries,expressedbytheGlobalInnovationIndex,elaborated bytheCornellUniversity,INSEADandtheWorldIntellectual PropertyOrganization(WIPO),pointsoutthatthecountriesthat areonthetopofthelistarealsotheonesthatpresentthehighest GDPpercapitaintheworld(Switzerland,Sweden,United King-dom,theNetherlands,theUnitedStates,Finland,HongKong, Singapore,DenmarkandIreland).Basedontheassumptionthat thehigherandthemoredevelopedtheeconomyofacountry, morecapitalthecountryshallhavetoinvestininnovation,we consideredthat the relationshipbetween GDPper capitaand innovationisvalid;thisisthereasonwhythisrelationshipwill beexploredinthequantitativeanalysis.
Innovationandpublicexpendituresoneducation
Therelationshipbetweeninnovationandtechnologyand pub-licexpendituresoneducationwasexploredbysomeauthors,but itisimportanttoemphasizetherelevanceofthistheme.Porter
6 https://pedesenvolvimento.com/2010/06/08/pib-em-alta-favorece-inovacao-nas-mpe-diz-diretor-do-sebrae/
andStern(2002)andFeldmann(2009)emphasizetherelevance ofsuchanissuewhenemphasizingtheneedtoinvestinthe edu-cationalsystem,sincethisisoneoftheformerstagesofskilled humanresources.
Itispossibletoidentifyacoherenceintheassumptionmade bytheseauthors;oncethattherearenopublicinvestmentsin the educational system, especially in elementary stages, it is possible to infer that such a system shall not be satisfactory for students, which carries out the emergence of not skilled professionalsfortheworkmarketand,therefore,foractivities relatedtoscienceandtechnology.Itisimportanttoremember herein that the variable approached in this section measures only public expenditures on education, not taking into con-sideration countries in which the educational investment is made by private institutions. In Brazil, around two-thirds of all enrollmentsinhigher education belongtoprivate schools (Durham & Sampaio, 1995). That way, countries in which education is subsidized by the government may present a different performance when compared to countries in which privateinstitutionsplaythemostimportantrole.
InnovationandpublicexpendituresonR&D
Technologyisessentialtomeasureinnovation,butitis usu-allyvery hardtomeasureit,speciallytaking intoaccountthe developmentlevelofcountries.Therefore,itiscommontoadopt thepercentageofexpendituresonR&Dof theGDPasoneof themethodstoidentifyhowmuchacountryiswillingtoinvest ininnovation.PorterandStern(2002)pointoutthatthe invest-mentsandpoliticaldecisionsofacountryareresponsibleforthe creationofanenvironmentforinnovation.
The strong competition among companies carries out the developmentofnewproducts,andalsonewwaystomanufacture existingproducts–thisisthereasonwhyitisnecessarythatthere aremoreandmoreinvestmentsinresearchanddevelopment, especiallyinindustriesinwhichtechnologicalchangesarevery relevantfortheirsurvival(e.g.computerscienceand pharmaceu-ticalindustries).Suchinnovativeactivitiescanbeencouragedby thegovernment,especiallywhenit comestosupportingbasic research(Stiglitz,2003).
InnovationandPISAperformance
The economist Paul Romer,when interviewed in2012 by aBrazilianmagazine,affirmed thatthereisastrong relation-shipbetweentheperformanceof studentsparticipatinginthe PISAexam,whichisappliedbytheOECD,andtheeconomic developmentofcountries.Accordingtohim,educationhasthe primaryresponsibilityforthehighratesofthedevelopmentof countries.Inotherwords,duetotheperformanceachievedby studentsevaluatedbyPISA,itispossibletopredictthelevelof developmentofthecountriestheylivein.Thatway, consider-ingthattechnologicalinnovationandknowledgearerelevantfor everyeconomy,governmentscanandshouldstimulategrowth inamoreefficientwayby investingineducation(Feldmann, 2015).
Sincethisstudy aimstoapproachissuesrelatedto innova-tion,weintendtoverifyifthereisarelationshipbetweenthe
performanceofstudentsintheareasofscienceand mathemat-icsandinnovation.Sincewehopethereisapositiverelationship betweeninnovationandGDPpercapita,weconsiderPISAasa pertinentvariableforthestudy,despitetheexploratory experi-ence.
Innovationandexportsofhigh-techproducts
Therearestudiesthatrelatedirectlytoinnovationandexports ofhigh-techproducts.Thisisthereasonwhyweconsideredthis relationshiprelevanttobeexploredinthisresearch.
PorterandStern(2002)affirmthatthecapacityofnational innovationisthepotentialofacountry(asapoliticaland eco-nomic entity) to generate commercially relevant innovation. Thatbeingthecase,itispossibletoinferthattheneedtotrade products isanactivity directlyrelatedtotheeconomic devel-opmentofacountry.Brazil,forexample,canbeconsideredan exporterofcommoditiessinceitisaproducerofprimarygoods (lowaddedvaluegoods),whichallowsthecountrytoexportthe surplus productionforothercountries.Therefore,thecountry that innovates andproduceshigh addedvalueproducts tends totradesuchmanufacturedproductstoothercountries,which strengthens thenational economywhilepushing the develop-mentofinnovation.Onecanbelieve,therefore,thatthiscanbe a relevant indicatorto evaluatethe performanceof acountry regardinginnovation.
Innovationandnumberofpatents
Theanalysisofthenumberofpatentsiscontroversialinthe academia.Oneofthereasonsisthatapatentdoesnotalways indicate somethingscientificandtechnologicallyrelevant;the otherreasonisthatpatentsconcedetheircreatorstheexclusive righttothediscovery,butforalimitedperiodoftime(Stiglitz, 2003).Thatway,manyinventorschoosenottopatenttheir dis-coveriesinordertopreservethemfromcopiesandmimicryafter theprotectionperiodisover.
Despitethecriticisms,the numberof patentsregisteredby countriesisstilloneofthemostusedindicatorstoevaluatethe developmentofinnovationindeterminedlocations.Itis impor-tanttomentionthatthepatentitselfisnotcapabletomeasure innovation;thepatentprovidessubsidiestoanalyzetheinternal and external institutional environmentsthat antecede its own emergence.
Innovationandnumberofengineers
PorterandStern(2002)affirmthatoneofthewaystomeasure thelevelofinnovationofacountryistoanalyzethenumberof engineersper10,000inhabitants.
Suchanindicatorcouldnotbeusedinthisstudy,sincethere isnointernationalrankingprovidingtheinformationaboutthe countries analyzed herein.Wecould onlyfind isolated infor-mation about the subject, which were not used in this study because theywerecontroversialor incomplete.That way,we choseanotherindicatorprovidedbyUNDP,whichanalyzes sim-ilarlythenumberofgraduatestudentsinscience,technologyand engineering.
Methodology
Thisstudycanbeconsideredpredominantlyquantitativeand descriptive,sincewe aregoingtousemeasurabledatatotest thevalidityofcertainvariablesandbecausethisstudyintends to describe aresearch problem based on indicators obtained fromother studies. Wedonot reject, however,its qualitative andexploratorycharacteristics,sincewealso intendtoreport observationsinordertobettercomprehendthem;theexploratory characteristicisduetotheaccomplishmentandanalysisof cor-relationsstilllittleexploredinthespecificcase.
Wewilluse theprocedureof multiple linearregression to analyzetherelationshipbetweentheinnovationindexandother variablesthat mayinfluencetheallocationofcountriesinthe index.Itisimportanttopointoutthatallvariableshavebeen previouslystandardized,consideringthattheywereindifferent measurementscales.
Theuniverse of the researchcorrespondsto 142 countries rankedbytheGlobalInnovationIndex.Thesample,however, corresponds to 33 countries, since the other indicators used herein did not encompass the 142 countries analyzed by the Global Innovation Index. The number 33 is the number of countriesidentifiedbytheFinancialTimeswhenselectingthe 500 largest companies in the world and, consequently, their countryof origin. Themultiplelinearregressionprocedureis applicable in this study, since the number of observations is higherthan30(Hairetal.,2006).
Thedependentvariable,entitledhereinasinnovationindex, waschosenbecauseitrepresentsalistelaboratedbytheCornell University,INSEADandWIPO,worldwideknowninstitutions duetotheir researchesrelatedtoinnovation,whichconsiders morethan80indicatorswhendealingwithinnovation.Inthis list,scoreshavebeenattributedtocountries:thehigherthescore, thebetterthepositionintheranking,inotherwords,thehigher thegrade,themoreinnovativethecountry.
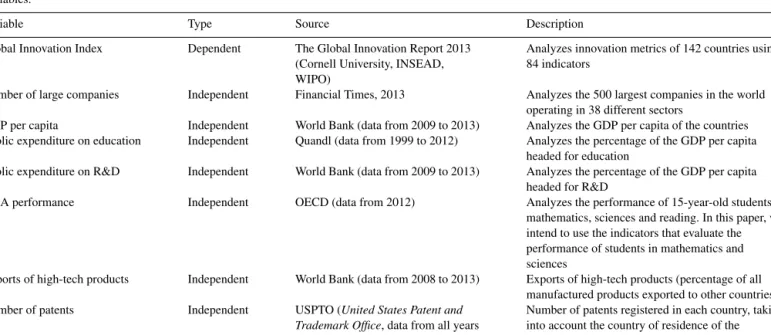
Thedependentvariableshavebeenobtainedbyother institu-tions,giventhedifficultytofindoneonlyinstitutionthatprovides allthenecessaryindicatorstoelaboratethisstudy(seeTable1for moredetailedinformation).Wealsotriedtoincludeonevariable thatcouldmeasurethefinancialenvironmentofthecountries; since thisindicator – provided by the WorldBank – did not contemplate the33countriesof the sample,thisvariablehad tobeignored.Thesamehappened withthenumberof gradu-atestudentsinsciencesandtechnology;theUNDPprovidesthe numberofgraduatesinseveralcountries,butsincemorethan fivecountriesofthesamplewerenotincludedintheranking, wehadtoignorethisvariable.Thevariableselectedtoevaluate theperformanceofstudentsinmathematicsandsciences(PISA) wasalsoignored,sinceitdidnotincludeSouthAfrica,Saudi ArabiaandIndia.
It is important topoint out that the innovation index pro-videdbytheGlobalInnovationReportalreadymeasuresmost oftheindependentvariablesstudiedherein;thesearchfor indi-catorsprovidedbyotherinstitutions,however,avoidsbiasesin the study.That way,we intend todemonstrate thatthere isa correlationbetweenthedependentvariableandtheindependent ones,evenwhenobtainedfromdifferentsources.
Anotheraspectthatdeservesattentionbeforepresentingthe analysis of the results refersto the insertion of China in the study. Due topolitical, economic andsocial differences, the Chinese territory can be divided into four distinctive parts: China, Hong Kong, MacauandTaiwan.Some research insti-tutions,ontheotherhand,onlydivideitintoChinaandHong Kong;othersmakenodivisionatallandhandlethewhole ter-ritory onlyas China.In thisstudy,we onlyconsideredChina in the analysis; we did not include Hong Kong, Macau or Taiwanseparately,becausesomeindexesarenotclearregarding this segregation. We recognize this limitation of the study andsuggest the inclusionof allChinese territories infurther researches.
Table1 Variables.
Variable Type Source Description
GlobalInnovationIndex Dependent TheGlobalInnovationReport2013 (CornellUniversity,INSEAD, WIPO)
Analyzesinnovationmetricsof142countriesusing 84indicators
Numberoflargecompanies Independent FinancialTimes,2013 Analyzesthe500largestcompaniesintheworld operatingin38differentsectors
GDPpercapita Independent WorldBank(datafrom2009to2013) AnalyzestheGDPpercapitaofthecountries Publicexpenditureoneducation Independent Quandl(datafrom1999to2012) AnalyzesthepercentageoftheGDPpercapita
headedforeducation
PublicexpenditureonR&D Independent WorldBank(datafrom2009to2013) AnalyzesthepercentageoftheGDPpercapita headedforR&D
PISAperformance Independent OECD(datafrom2012) Analyzestheperformanceof15-year-oldstudentsin mathematics,sciencesandreading.Inthispaper,we intendtousetheindicatorsthatevaluatethe performanceofstudentsinmathematicsand sciences
Exportsofhigh-techproducts Independent WorldBank(datafrom2008to2013) Exportsofhigh-techproducts(percentageofall manufacturedproductsexportedtoothercountries) Numberofpatents Independent USPTO(UnitedStatesPatentand
TrademarkOffice,datafromallyears upto2014)
Numberofpatentsregisteredineachcountry,taking intoaccountthecountryofresidenceofthe inventor(s)
–2 –1.5
Number of large companies
Public expenditure on education (%GDP) Exports of high-tech products
–1 –3 –2 –1 0 0 1 2 3 4 5 6 –0.5 0.5 GDP per capita
Public expediture on R&D %GDP) Patents
1 1.5 2
ScatterPlot1.Linearityoftheindependentvariablesofthestudy.
Results
One of the most relevant premises of the multiple linear regressionreferstothelinearityof theindependentvariables. Forsuch, it is desirablethat the F-significance islower than 0.10correspondingtoasignificancelevelof90%.Inthisstudy, theF-significancevaluewas8.31281E−09,whichindicatesa linearrelationshipbetweenthedependentandtheindependent variables(ScatterPlot1)
SincetheF-significancewassatisfactoryinouranalysis,we willproceedthestudybydemonstratingtheregressionstatistics thatweobtainedinthisresearch(Table2).
Thelinearcorrelationcoefficient(Rmultiple=0.91)isabove 0.7,whichindicatesastronglinearcorrelationamongthe vari-ables, whichis expected in multiple regression models. The coefficientofdetermination,representedbyR-square,indicates thatalmost83%ofthevariabilityoftheinnovationindexcan be explained by the variability of the independent variables. Theexplanationpowerofthemodel,representedbyR-square adjusted,wasapproximately79%,whichcanbeconsidered sat-isfactory(Table3).
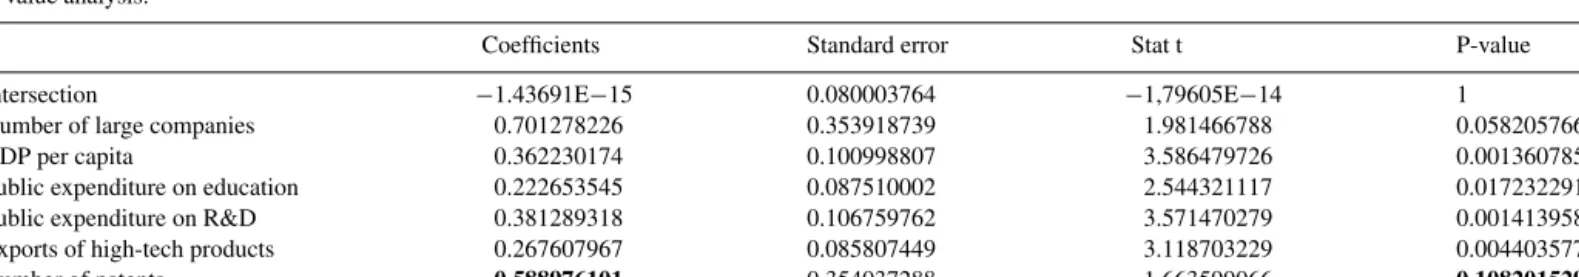
Anotherindicationthat thereisalinearcorrelationamong thevariablesisthe descriptivelevel (P-value).Weconsidered herein,duetothesizeof thesample,alevel oftrustof90%. The P-valueof the intersectionis higher than0.10 (which is expectedwhen the level of trustis 90%), andtheP-valueof
the independent variablesis smallerthan 0.10(which is also expected).TheonlyvariablethatpresentsaP-valuediscretely above 0.10 refersto thenumberof patents (P-value=0.108). Thisvariablewillbekeptinthestudy,sinceitsP-valueisvery close towhat isnormally expected.Itis, however,important toemphasizethatthisvariableistheonethatlessexplainsthe innovation level of the countriesof oursample. Besides,this variableistheonlyonenegativelycorrelatedtothedependent variable, whichmeans that the higherthe level of innovation of acountry, the smallerthe number of patentedinnovations (Table4).
BythescoresindicatedbytheP-value,itispossibleto estab-lisharakingofthemostcorrelatedvariableswiththelevel of innovationofthecountries.Therefore,thedescendingranking ofthevariablesisasfollows:GDPpercapita,publicexpenditure onR&D,exportsofhigh-techproducts,publicexpenditureon education,numberoflargecompaniesandnumberofpatents.
Basedontheinformationexploredinthetheoretical frame-work, itispossibletocomprehendtheresultsobtainedbythe linear multiple regression.GDP per capita, as well as public expenditureonR&D,indicatethatthemoreeconomically devel-oped acountry,the greaterthe willingnesstoinvestinR&D, whichincreasestheinnovativepotentialofacountry.
Theexportsofhigh-techgoodsfollowthesamelogical prin-ciple:themoreinnovative,thelargertheproductionofhigh-tech products,whichwillbeexportedtocountriesthatdemandfor
Table2 Linearitychart. gl SQ MQ F F-sig Regression 6 26.50828323 4.418047205 20.91681567 8.31281E−09 Residual 26 5.491716768 0.211219876 Total 32 32
Table3 Regressionstatistics. Rmultiple 0.910155949 R-square 0.828383851 R-squareadjusted 0.788780124 Standarderror 0.459586636 Observations 33
suchproductsindeterminedsectors.Thepublicexpenditureon educationranksfourthisouranalysis.Suchobservationcanbe associatedwiththefactthatmanycountries–especially devel-opingones–haveunsatisfactorypubliceducationalsystemsand, therefore,privateinstitutionsendupplayinganimportantrole toprovidestudentswithpropereducation.
Thenumberoflargecompaniesinfluencesthedevelopment ofinnovationinthecountriesofthesampleasexpected,butitis importanttoemphasizetheoutcomesofthestudyaccomplished byPorterandStern(2002)regardinginnovationandcountries: businessclustersareresponsibleforthedevelopmentand emer-genceofinnovation–notlargecompaniesisolated.Itispossible toobservenowadaysanexpressivenumberoflargecompanies thatinnovate,but,accordingtowhattheauthorspropose,they allwere–orstillare–insertedinclusters,inwhichinnovation occursintheearlystages.
Thenumberofpatentsisthevariablelessrelatedwith innova-tionandnegativelycorrelatedtoit,whichistheoppositeofwhat isusuallybroughtupwhenanalyzingtheinnovationlevelofa country.Onepossibleexplanationcanbethatmanyinnovations arenotpatented;inthepatentingprocess,itisnecessarytoreveal certaindescriptions,whichcanputinriskthecompetitiveness ofanindustryoncethepatentprotectionexpires.
Itispossibletoaccomplishhereinadescriptiveanalysisof thedataobtainedtocompareBrazilandtheothercountriesofthe sample.Theinnovationindex,whoselargestscorewasachieved bySwitzerland(66.59),indicatesthatBrazilhasapproximately 50% of the score obtained by the most innovative country (36.33), being aheadof India (by adifference of only0.16), IndonesiaandTurkey.Regardinglargecompanies,Brazilisa
littlebelowtheaverage,beingrepresentedby10companies;in LatinAmerica,Braziliswellrepresented,sinceChilehasonly onecompanyandMexico,five(Table5).
Whenanalyzingthistable,itispossibletonoticeastrong divergenceregardingthenumberofpatents.Accordingtothe assumptionthatthisvariableisnegativelycorrelatedto innova-tion,wewillnotdeepenthisanalysisinthisresearch.
ThepublicexpenditureoneducationinBrazilisabove the average of the countries analyzed in the study; the country is 14.8%above the average, which can be considered satis-factory. The variable that presents the worst performance is GDP percapita, whichrepresentsonly30.4%of the average of the countriesof the sample; inother words, the Brazilian GDP per capita is 69.6% smaller than the average of these countries.Regardingtheothervariables,thedifferenceisvery similar; regarding large companies, the number of Brazilian companiescorrespondsto68.9%oftheaverageofthecountries (31.1%smallerthantheaverage);regardingpublicexpenditure on R&D, it is68.4%(31.6% smallerthan the average);and, finally,regardingtheexportsofhigh-techproducts,itis67.7% (32.3%smallerthantheaverage).
Whenanalyzingtheformertable,itispossibletorealizethat Brazil’sperformanceisnotunfavorable,sincetherearecountries presentinganinferiorperformance.WhencomparingBraziland Switzerland,whichisthemostinnovativecountryaccordingto theglobalranking,onecanverifystrongerdifferences(Table6). Inthisperspective,werealizethatthemostrelevantfactors that influenceinnovation are notpublic expenditures on edu-cationnor the numberof large companies,whose results are similarinbothcountries,butGDPpercapita,publicinvestments in R&D and exports of high-tech products. Export of high-techproductsisarelevant indicatortoanalyzehow acountry producestechnologythroughinnovation,whichcanbeidentified inproductsandservices.
WhenanalyzingBraziltakingintoaccount theBRICs, the resultsareabitdifferent(Table7).
Even thoughBrazilhasthe secondlargestGDPpercapita anddespitebeingthelargestinvestorineducation,Brazilhast
Table4
P-valueanalysis.
Coefficients Standarderror Statt P-value
Intersection −1.43691E−15 0.080003764 −1,79605E−14 1
Numberoflargecompanies 0.701278226 0.353918739 1.981466788 0.058205766
GDPpercapita 0.362230174 0.100998807 3.586479726 0.001360785
Publicexpenditureoneducation 0.222653545 0.087510002 2.544321117 0.017232291 PublicexpenditureonR&D 0.381289318 0.106759762 3.571470279 0.001413958 Exportsofhigh-techproducts 0.267607967 0.085807449 3.118703229 0.004403577
Numberofpatents −0.588976101 0.354037288 −1.663599066 0.108201529
Table5
Brazilandtheothercountriesofthesample. Innovation ranking Large companies GDPper capita Expenditure/education (%GDP) Expenditure/R&D (%GDP) Exports/high-tech (%) Patents Brazil 36.33 10 11.208 5.82 1.3 10 3.373 World 49.09 14.51 36.817 4.96 1.9 14.78 220.000
Table6
ComparisonbetweenBrazilandSwitzerland. Innovation ranking Large companies GDPper capita Expenditure/education (%GDP) Expenditure/R&D (%GDP) Exports/high-tech (%) Patents Switzerland 66.59 13 80.528 5.22 3 26 51.693 Brazil 36.3 10 11.208 5.82 1.3 10 3.373 Table7 TheBRICS. Innovation ranking Large companies GDPper capita Expenditure/education (%GDP) Expenditure/R&D (%GDP) Exports/high-tech (%) Patents Brazil 36.3 10 11.208 5.82 1.3 10 3.373 Russia 37.2 8 14.612 4.1 1.48 8 4.025 India 36.17 12 1.499 3.17 0.9 7 11.406 China 44.66 23 6.807 1.91 1.65 22 28.519
the secondworst performanceregardinginnovation.The per-formanceof Brazil,RussiaandIndiaisverysimilar;theonly countrythatstandsoutisChina,despitehavingthesecondworst GDPpercapitaandthesmallestpublicinvestmentsineducation. ThefactthatChinaisbetterpositionedintheinnovationranking canbesubjecttoothervariables,whichwerenotencompassed bythisstudy.Itisimportanttoemphasizethattheinvestmentsin R&DinChinaaresuperiortotheinvestmentsinothercountries, aswellasthenumberofexportsofhigh-techproducts.
Conclusion
It is possible toconclude that there is apositive relation-shipbetweentechnologicaldevelopmentandinnovation,and, thatway,itispossibletodeterminethatgreatworldrevolutions had,directlyorindirectly,somesortofrelationshipwith inno-vationandtechnology.Theemergenceofthesteamengineand informatics,forexample,changedthewaythatcompaniesand societyfunctioned,markingthebeginningofneweconomicages andentrepreneurial andinternational competitiveness. There-fore,exploringthisthemecontributestotheexistingliteratureon innovation,whileenablingthecomprehensionofcurrentaspects regardingthisissue.
Theimportanceofinnovationforthewelfareofcountriesis wellknown.Whenit comestoBrazil, morespecifically,it is possibletomentionthelackofpublicinvestmentsinissuesthat arerelevantforinnovation,thelackofcommitmentof compa-niesininnovating,thebadintegrationbetweencompaniesand universitiesandresearchcenters,amongothers.Tocomprehend themostrelevantfactorsregardingthedevelopmentof innova-tioninacountry,aquantitativestudywasaccomplishedherein byusingtheprocedureofmultiplelinearregression,which ana-lyzedsomevariablesrelatedtoinnovationbasedonassumptions presentedinthetheoreticalframework.Inordertomeasure inno-vation,weusedtherankingpresentedbytheGlobalInnovation IndexprovidedbytheCornellUniversity,INSEADandWIPO, whichpresenteddatafrom2013.
Asaresultof ouranalysis,wecouldpresent adescending rankingregardingtherelevanceofthevariablesassociatedwith innovation:GDPpercapita,publicexpenditureonR&D,exports
of high-tech products,public expenditureoneducation, num-ber of large companiesandnumber of patents. Accordingto the assumptionspresentedinthetheoreticalframework,some variablesareinaccordancewiththetheory;otheronesindicate differentoutcomes.
The positive relationshipbetween GDP per capita, public expenditure on R&D, exports of high-tech products, public expendituresoneducationandinnovationisinaccordancewith the assumptions demonstrated in the theoretical framework. Therefore,ahigherGDPpercapitacanindicateahigher will-ingnesstoinvestininnovation–theexceptionisbroughtupby China.Suchparadoxcanberelatedtothefactthat,inthisspecific case, othervariablesaremorerelatedtoinnovationthanGDP percapita.TheresultsrelatedtopublicexpenditureonR&Dare alsoinaccordancewiththetheoreticalframework;R&Disa rel-evantsectorwhenonetakesintoconsiderationthedevelopment ofinnovationinadeterminedcountryand,therefore,innovative countriestendtoinvestmoreinR&D.
Inthesameway,theexportsofhigh-techproductsarealso positivelyrelatedwithinnovation;accordingtoPorterandStern (2002), ifthe innovativeability of acountryis relatedtothe productionof commerciallyrelevant innovativeproducts,one caninferthatthehighertheabilitytoinnovate,themore inno-vativetheproductswillbe.Consequently,ahighernumberof exportsofhigh-techproductsisexpected.Thepublic expendi-tureoneducationisalsopositivelyrelatedwithinnovation,but toalesserextent.Suchfactrelatestooneofthelimitationsof thisstudy,sincesuchinvestmentsineducationtakeintoaccount onlythepublicexpenditures,neglectingtheprivatesectorthat canplayanimportantroleintheeducationofacounty,especially inBrazil.
Thenumberoflargecompaniesisarelevantvariablefromthe statisticalpointofview.Itispossibletoaffirmthatinnovation occurs,usually,inlargecompanies,butonecannotignorethe affirmations madeby PorterandStern(2002)when asserting thatinnovationoccurs,frequentlyandinitially,inclusters.
The only variablethat showed a negativecorrelationwith innovation relates to the number of patents registered in the countriesofthesample.Incontrasttothecommonsense,thereis nopositiverelationshipbetweeninnovationandpatents,which
can be explained by the fact that many innovations end up notbeingpatentedinordertopreserve,forexample,industrial secretsofcertainproducts.Therefore,accordingtothe quanti-tativeanalysisaccomplishedherein,thenumberofpatentsmay notbethebestindicatortomeasureinnovationofadetermined country.
Asaresult, onecanrelate the first four factors(GDPper capita,publicexpenditureonR&D,exportsofhigh-tech prod-ucts,andpublicexpenditureoneducation)tothegovernment. Inotherwords,thegovernmenthas,inthesecases,thepowerto fosteraneconomicenvironmentthatispropertothe develop-mentofinnovation.Theemergenceoflargecompaniesisalso relevantwhen itcomes toinnovation, sincetheyarethe ones hathavebetterfinancialresources toinvestininnovation and technology–suchrealitycanalsoberegulatedbygovernment institutions.
It is therefore possible to conclude that, in the Brazilian case,abroadergovernmentcommitmentisnecessarytoenhance theGDPpercapitaand,consequently,thepublicexpenditures onR&Dinordertoincreasetheproductionofinnovativeand high-techproducts.Sucharrangemententailsanincreaseinthe numberof exportsof high-tech products. Suchmeasures can
strengthen the involvement andinteractions between compa-nies, research centers and universities, whichare institutions positivelyrelatedwithinnovation.
We suggest, for further studies, to reapply this analysis encompassingalargernumberofcountries,aswellasalarger numberofvariables(includingtheonesthathadtobeignored inthisresearch)
Conflictofinterest
The authors certify that they have no affiliations with or involvement in any organization or entity with any financial interest (such as honoraria; educational grants; participation inspeakers’bureaus;membership,employment,consultancies, stockownership,orotherequityinterest;andexperttestimonyor patent-licensingarrangements), ornon-financialinterest(such aspersonalorprofessionalrelationships,affiliations,knowledge or beliefs)inthe subjectmatter ormaterialsdiscussedinthis paper. AppendixA. Country Innovation ranking Numberoflarge companies GDPper capita Publicexpenditureon education(%GDP) Publicexpenditure onR&D(%GDP) Exports (%) Patents SouthAfrica 37.6 5 6.618 5.96 0.95 6 4220 Germany 55.83 20 45.085 5.08 2.85 16 330,280 SaudiArabia 41.21 3 25.852 5.14 0.08 1 855 Australia 53.07 12 67.468 5.59 2.3 13 31,160 Belgium 52.49 1 45.387 6.57 2.03 11 19,374 Brazil 36.33 10 11.208 5.82 1.3 10 3373 Canada 57.6 26 51.911 5.5 2.1 12 108,720 Qatar 41 2 93.352 2.45 2.8 0 22 Chile 40.58 1 15.732 4.07 0.42 5 455 China 44.66 23 6.807 1.91 1.65 22 28,519 SouthKorea 53.31 5 25.977 5.05 3.45 26 127,992 Denmark 58.34 2 58.930 8.74 3.1 14 14,975
UnitedArabEmirates 41.87 1 41.692 0.99 0.47 3 138
Spain 49.41 6 29.118 4.97 1.42 7 9261 UnitedStates 60.31 184 53.143 5.62 2.66 18 5,087,834 Finland 59.51 1 47.219 6.84 3.75 9 20,096 France 52.83 24 41.421 5.86 2.24 25 125,737 Netherlands 61.14 7 47.617 5.96 1.9 20 44,715 India 36.17 12 1.499 3.17 0.9 7 11,406 Indonesia 31.95 5 3.475 2.77 0.25 7 297 Israel 55.98 1 36.151 5.59 4.2 16 28,478 Italy 47.85 7 34.619 4.5 1.32 7 56,025 Japan 52.23 34 38.492 3.78 3.48 17 958,971 Malaysia 46.92 1 10.514 5.13 0.75 44 2152 Mexico 36.82 5 10.307 5.28 0.4 16 2581 Norway 55.64 3 100.819 6.87 1.85 19 7496 UnitedKingdom 61.25 36 39.351 6.3 1.84 22 125,906 Russia 37.2 8 14.612 4.1 1.48 8 4025 Singapore 59.41 4 55.182 3.23 2.7 45 7986 Sweden 61.36 10 58.164 6.98 3.62 13 44,166 Switzerland 66.59 13 80.528 5.22 3 26 51,693 Thailand 37.63 5 5.779 5.79 0.25 21 802
References
Botelho,M.R.A.,Maia,A.F.S.,&Pires,L.A.V.(2012).Inovac¸ãoeportedas empresas:Evidênciassobreaexperiênciainternacionalebrasileira.Revista deEconomia,38(1(36)),189–210.
Davila,T.,Epstein,M.J.,&Shelton,R.D.(2007).Asregrasdainova¸cão:como gerenciar,comomedirecomolucrar.PortoAlegre:Bookman.
Durham,E.R.,&Sampaio,H.(1995).OensinoprivadonoBrasil.SãoPaulo: NúcleodePesquisassobreoEnsinoSuperior(NUPES/USP).
Dyer,J.,Gregersen,H.,&Christensen,C.M.(2012).DNAdoinovador: domi-nandoas5habilidadesdosinovadoresderuptura.HSM.
FDC-Fundac¸ãoDomCabral.(2013).Rankingdasmultinacionaisbrasileiras. Available from: http://www.fdc.org.br/imprensa/Paginas/noticia.aspx? noticia=19(accessed23.08.14)
Feldmann,P.R.(2009).OatrasotecnológicodaAméricaLatinacomo decor-rênciadeaspectosgeográficosedefatoresmicroeconômicosinterligados.
EconomiaeSociedade,Campinas,18(1(35)),119–139.
Feldmann,P.R.(2015).Abuscadeconhecimentoexternoàempresacomoum meioparaobten¸cãodevantagemcompetitiva:estudosdecasosdeutiliza¸cão deinova¸cãoabertaemempresasindustriaisbrasileiras(Tese(Livre Docên-cia)).FaculdadedeEconomia,Administrac¸ãoeContabilidade,Universidade deSãoPaulo.
Hair,J.F.,Black,W.C.,Babin,B.J.,Anderson,R.E.,&Tatham,R.L.(2006).
Multivariatedataanalysis.PearsonPrenticeHall.
Kelley,T.,&Littman,J.(2007).As10facesdainova¸cão.Elsevier.
Maital,S.,&Seshadri,D.V.R.(2013).Innovationmanagement:strategies, conceptsandtoolsforgrowthandprofit.SAGEPublications.
Midgley,D.(2009).Theinnovationmanual:integratedstrategiesandpractical toolsforbringingvalueinnovationtothemarket.Wiley.
Moreira Filho, A.Incentivos fiscais e inovac¸ão. Valor Econômico. Avail-ablefrom: http://www.valor.com.br/legislacao/3591592/incentivos-fiscais-e-inovacao#comments.(accessed24.06.15).
Porter,M.R.,&Stern,S.(2002).Inova¸cãoelocaliza¸cãodemãosdadas.HSM Management.
Prochnik,V.,&Araújo,R.D.(2005).Umaanálisedobaixograudeinovac¸ãona indústriabrasileiraapartirdoestudodasfirmasmenosinovadoras.InXXXIII EncontroNacionaldeEconomia,2005,Natal.XXXIIIEncontroNacional deEconomia,ANPEC
Romer,P.PaulRomerdefendegovernosfortesecompapeldeRH.Revista Exame,14desetembrode2012.Availablefrom:http://exame.abril.com.br/ economia/noticias/paul-romer-defende-governos-fortes-e-com-papel-de-rh (accessed23.08.14).