Decision Making Analysis for an Integrated Risk Management
Framework of Maritime Container Port
Infrastructure and Transportation Systems
HANI MOHAMMED ALYAMI
A thesis submitted in partial fulfilment of the requirements of Liverpool John Moores University for the degree of Doctor of Philosophy
I Abstract
This research proposes a risk management framework and develops generic risk-based decision-making, and risk-assessment models for dealing with potential Hazard Events (HEs) and risks associated with uncertainty for Operational Safety Performance (OSP) in container terminals and maritime ports. Three main sections are formulated in this study: Section 1: Risk Assessment, in the first phase, all HEs are identified through a literature review and human knowledge base and expertise. In the second phase, a Fuzzy Rule Base (FRB) is developed using the proportion method to assess the most significant HEs identified. The FRB leads to the development of a generic risk-based model incorporating the FRB and a Bayesian Network (BN) into a Fuzzy Rule Base Bayesian Network (FRBN) method using Hugin software to evaluate each HE individually and prioritise their specific risk estimations locally. The third phase demonstrated the FRBN method with a case study. The fourth phase concludes this section with a developed generic risk-based model incorporating FRBN and Evidential Reasoning to form an FRBER method using the Intelligence Decision System (IDS) software to evaluate all HEs aggregated collectively for their Risk Influence (RI) globally with a case study demonstration. In addition, a new sensitivity analysis method is developed to rank the HEs based on their True Risk Influence (TRI) considering their specific risk estimations locally and their RI globally. Section 2: Risk Models Simulations, the first phase explains the construction of the simulation model Bayesian Network Artificial Neural Networks (BNANNs), which is formed by applying Artificial Neural Networks (ANNs). In the second phase, the simulation model Evidential Reasoning Artificial Neural Networks (ERANNs) is constructed. The final phase in this section integrates the BNANNs and ERANNs that can predict the risk magnitude for HEs and provide a panoramic view on the risk inference in both perspectives, locally and globally. Section 3: Risk Control Options is the last link that finalises the risk management based methodology cycle in this study. The Analytical Hierarchal Process (AHP) method was used for determining the relative weights of all criteria identified in the first phase. The last phase develops a risk control options method by incorporating Fuzzy Logic (FL) and the Technique for Order Preference by Similarity to Ideal Solution (TOPSIS) to form an FTOPSIS method. The novelty of this research provides an effective risk management framework for OSP in container terminals and maritime ports. In addition, it provides an efficient safety prediction tool that can ease all the processes in the methods and techniques used with the risk management framework by applying the ANN concept to simulate the risk models.
II
Acknowledgements
First and foremost, I praise and acknowledge Allah; all praise is due to Allah, the most gracious and the most merciful. Second, my humblest gratitude to the holy prophet Muhammad (peace be upon him), whose way of life has been a continuous source of guidance for me. This thesis appears in its current form due to the assistance and guidance of several people and organisations. I am delighted to convey my appreciation and sincere gratitude to them in my acknowledgement. They were always there when I needed them the most.
Acknowledgement is due to the Ministry of Higher Education of the Kingdom of Saudi Arabia, the Saudi Cultural Bureau in the United Kingdom, the Maritime Studies College at King Abdul Aziz University, the Liverpool Logistics, Offshore and Marine (LOOM) Research Institute at Liverpool John Moores University, Wuhan University of Technology in China, and EU projects for providing support to carry out this work. I express my profound sense of reverence to my principal supervisor Prof. Zaili Yang for his continuous support; the motivation and untiring guidance he provided have made this dream come true. His vast knowledge, calm nature, and positive criticism motivated me to strive for significant and tangible results. I could always rely on him for support during the course of my Ph.D. Thanks to him for his patience and encouragement, which he exhibited even when I made mistakes or could not meet our deadlines. I am greatly indebted to him for having shown me how to conduct nothing less than the highest quality research. I feel privileged to have been associated with such a person during my life. Equally important was the support of Prof. Jin Wang, who gave me the opportunity to perform this project by accepting me as a researcher in LOOM. During my initial days, I was apprehensive about my decision to join an institution where things were new to me. Prof. Wang came to my rescue and helped me sail through the initial fumbling stage. I am also greatly indebted to him for his intelligent ideas, thought-provoking discussions, and comprehensive understanding. Through his contributions, I was able to select an interesting and practical topic to research. His scientific inputs, personal help, and friendly nature has always made me feel at ease with him and has inspired me to strive for nothing short of excellence.
My special words of thanks should also go to my co-supervisors. Dr. Ramin Riahi was always available to encourage challenging discussions and to inspire me to take the next
III
step. Thanks to him for his critical but valuable suggestions for my thesis and for his availability whenever I needed advice. I extend my sincere words of thanks to Dr. Steve Bonsall as well. I am grateful for the time he took to review my work and for his comments to improve the work presentation.
In science, you are never on your own. Therefore, I am grateful for the support of all co-authors who made contributions to my articles and their stimulating role in addressing the issues in this thesis. Heartfelt thanks to my senior and junior colleagues in the LOOM centre and Wuhan University of Technology. It was enjoyable and exciting to have them during my research and nice to exchange ideas and chat. Special thanks are due to the Saudi community in Liverpool for pleasant times on tours, parties, and family gatherings during festive seasons.
Words are bound and knowledge is limited to acknowledge my parents, brothers, and sisters for their constant support, prayers, and best wishes. In fact, to get a higher education was a wish of my father, who was the first inspiration for me, may his soul rest in peace. A sincere and profound gratitude is due to my mother for her great material and spiritual support, which always boosts my progress. Most sincerely, I would like to pay my warmest tribute to my beloved wife and my children. Their great patience, love, and strong emotional support made my life pleasant even in the hardest times. I would never have succeeded without their support.
Even all these acknowledgements fail to thank all who have supported me. Many people and organisations have helped me, and many good friends have shared experiences and thoughts with me throughout the past years. To all of them, if their names do not appear above, I would like to express my heartfelt gratitude.
IV
Table of Contents
ABSTRACT ---I ACKNOWLEDGEMENTS --- II TABLE OF CONTENTS --- IV LIST OF FIGURES --- VIII LIST OF TABLES ---X LIST OF ABBREVIATIONS --- XII
CHAPTER 1 ― INTRODUCTION --- 1
SUMMARY --- 1
1.1. BACKGROUND --- 1
1.2. JUSTIFICATION FOR THE RESEARCH AND STATEMENT OF THE PROBLEM --- 3
1.3. RESEARCH OBJECTIVES AND RELEVANT HYPOTHESIS --- 6
1.3.1. AIM OF THE INVESTIGATION --- 6
1.3.2. RESEARCH OBJECTIVES --- 6
1.4. RESEARCH ACHIEVEMENTS --- 6
1.5. RESEARCH METHODOLOGY AND SCOPE OF THE THESIS --- 7
1.6. STRUCTURE OF THESIS --- 9
CHAPTER 2 ― LITERATURE REVIEW --- 12
SUMMARY --- 12
2.1. INTRODUCTION --- 12
2.2. CONTAINER TERMINAL MARKET OVERVIEW --- 13
2.2.1. GLOBAL CONTAINERISATION MARKET --- 14
2.2.2. GLOBAL CONTAINERISATION GROWTH --- 17
2.3. CONTAINER TERMINAL PORT OPERATIONS OVERVIEW --- 20
2.3.1. CONTAINER SHIP-RELATED PORT OPERATIONS --- 20
2.3.2. CONTAINER TERMINAL PORT OVERVIEW --- 23
2.3.3. CONTAINER TERMINAL PORT OPERATION PROCESS --- 24
2.3.4. CONTAINER HANDLING OPERATIONS --- 26
2.3.5. YARD HANDLING EQUIPMENT --- 27
2.3.6. YARD TRANSHIPMENT --- 28
2.4. MARITIME PORT SAFETY --- 29
2.5. CONTAINER TERMINAL PORT SAFETY --- 31
2.5.1. SOME NOTEWORTHY ACCIDENTS --- 34
2.5.1.1. CHICAGO PORT DISASTER --- 34
2.5.1.2. TIANJIN PORT DISASTER --- 35
2.5.2. EXISTING CONTAINER TERMINAL PORT SAFETY-RELATED METHODOLOGIES --- 36
2.5.2.1. QUANTITATIVE RISK ANALYSIS (QRA) --- 37
V
2.5.2.3. FORMAL SAFETY ASSESSMENT (FSA) --- 41
2.5.2. RISK MANAGEMENT PROCESS --- 43
2.5.2.1. HAZARD IDENTIFICATION (HAZID) --- 44
2.5.2.2. RISK EVALUATION --- 46
2.5.2.3. RISK MITIGATION --- 47
2.5.3. CONTAINER TERMINAL PORT SAFETY-RELATED LEGISLATION --- 48
2.6. CONCLUSION --- 51
CHAPTER 3 ― MODELLING CONTAINER TERMINAL RISK EVALUATION (CTRE) --- 53
SUMMARY --- 53
3.1. INTRODUCTION --- 53
3.2. RESEARCH BACKGROUND --- 54
3.2.1. FUNDAMENTAL ASPECTS OF THE NOTION OF RISK --- 54
3.2.1.1. THE DISTINCTION BETWEEN RISK AND HAZARD --- 55
3.2.1.2. THE DISTINCTION BETWEEN RISK AND UNCERTAINTY --- 55
3.2.2. A BRIEF REVIEW OF FUZZY FMEA --- 58
3.3. METHODOLOGY FOR MODELLING CTSE --- 59
3.3.1. ESTABLISHMENT OF AN FRB WITH BELIEF STRUCTURE IN FMEA OF CTRE --- 60
3.3.2. IDENTIFICATION OF THE HES IN CONTAINER TERMINALS --- 63
3.3.3. DEVELOPMENT OF FRBN MODEL --- 67
3.3.3.1. RULE AGGREGATION FOR PRIOR PROBABILITY OF HES --- 67
3.3.3.2. BAYESIAN REASONING MECHANISM --- 68
3.3.3.3. UTILITY FUNCTIONS FOR HES RANKING --- 68
3.3.3.4. PRIORITISATION OF THE HES USING THE NEW FRBN --- 69
3.3.3.5. MODEL VALIDATION PROCESS --- 69
3.4. RED SEA GATEWAY TERMINAL COMPANY (RSGT) CASE STUDY --- 70
3.4.1. ESTABLISHMENT OF FUZZY RULE BASE WITH BELIEF STRUCTURE --- 70
3.4.2. IDENTIFICATION OF THE HES IN RSGT --- 70
3.4.3. DEVELOPMENT OF FRBN MODEL --- 72
3.4.3.1. RULE AGGREGATION FOR HES PRIOR PROBABILITY --- 72
3.4.3.2. BAYESIAN REASONING MECHANISM --- 73
3.4.3.3. UTILITY FUNCTIONS FOR HES RANKING --- 73
3.4.3.4. PRIORITISATION OF THE HES USING THE NEW FRBN --- 75
3.4.3.5. MODEL VALIDATION PROCESS --- 76
3.5. RESULTS AND DISCUSSION --- 78
3.6. CONCLUSION --- 78
CHAPTER 4 ― MODELLING CONTAINER TERMINAL OPERATION SYSTEM (CTOS) --- 80
VI
4.1. INTRODUCTION --- 80
4.2. RESEARCH BACKGROUND --- 84
4.2.1. A BRIEF REVIEW OF RESEARCH ON EVIDENTIAL REASONING --- 84
4.2.2. THE APPLICATIONS OF EVIDENTIAL REASONING --- 85
4.3. METHODOLOGY FOR MODELLING CTOS --- 87
4.3.1. RISK ASSESSMENT FOR COLLECTIVE HES USING THE ER APPROACH --- 88
4.4. CASE STUDY OF RED SEA GATEWAY TERMINAL CO.(RSGT) --- 94
4.5. RESULTS AND DISCUSSION --- 104
4.6. CONCLUSION --- 105
CHAPTER 5 ― INTEGRATED CONTAINER PORT SYSTEM RISK ANALYSIS AND PROBABILISTIC SAFETY ASSESSMENT SIMULATIONS USING ANNS --- 107
SUMMARY --- 107
5.1. INTRODUCTION --- 107
5.2. ARTIFICIAL NEURAL NETWORKS (ANNS)OVERVIEW --- 110
5.2.1. ANN HISTORY --- 110 5.2.2. ANN CONCEPT --- 111 5.2.3. ANN PRINCIPLES --- 112 5.2.4. CHARACTERISTICS OF ANNS --- 115 5.2.5. ANNS APPLICATIONS --- 117 5.2.6. ANN SOFTWARE --- 118 5.2.6.1. COMMERCIAL SOFTWARE --- 118 5.2.6.2. FREEWARE SOFTWARE --- 118 5.3. METHODOLOGY --- 119 5.3.1. METHODOLOGY ALGORITHMS --- 120
5.3.1.1. ALGORITHMS OF MODELLING PERFORMANCE CRITERIA --- 120
5.3.1.2. ALGORITHMS OF MODELLING ASSESSMENT CRITERIA --- 124
5.4. DEVELOPMENT OF ANNMODELLING IN MARITIME PORTS--- 125
5.4.1. EXPERIMENTAL DATA PROCESSING --- 127
5.5. BAYESIAN NETWORK ANNS (BNANNS)MODEL DESIGN --- 128
5.5.1. EXPERIMENTAL DATA ANALYSIS --- 128
5.5.2. BNANN MODEL OPTIMISATION --- 129
5.5.3. RESULTS VALIDATION --- 131
5.6. EVIDENTIAL REASONING ANNS (EVRANNS)MODEL DESIGN --- 134
5.6.1. EXPERIMENTAL DATA ANALYSIS --- 134
5.6.2. EVRANNS MODEL OPTIMISATION --- 135
5.6.3. RESULTS VALIDATION --- 136
5.7. INTEGRATED ANNS BAYESIAN NETWORKS EVIDENTIAL REASONING (ANBNEVR) --- 138
VII
5.8. CONCLUSION --- 140
CHAPTER 6 ― DECISION SUPPORT SYSTEM FOR OPTIMAL CONTAINER PORT SAFETY PERFORMANCE PLAN SELECTION --- 141
SUMMARY --- 141
6.1. INTRODUCTION --- 141
6.2. RESEARCH BACKGROUND --- 143
6.2.1. A BRIEF REVIEW ON MCDM --- 143
6.3. DEVELOPMENT OF THE MADM MODEL --- 145
6.3.1. ABRIEF REVIEW OF ANALYTICAL HIERARCHY PROCESS (AHP) --- 146
6.3.2. THE TECHNIQUE FOR ORDER PREFERENCE BY SIMILARITY TO IDEAL SOLUTION - 147 6.3.3. A BRIEF REVIEW OF EXTENDED TOPSIS USING FUZZY LOGIC --- 149
6.4. DEVELOPMENT FOR MODELLING OSP IN CONTAINER TERMINALS --- 151
6.4.1. DATA COLLECTION METHODS --- 152
6.4.2. EXPERTS SELECTION --- 153
6.5. METHODOLOGY FOR MODELLING OSPSTRATEGIES IN CONTAINER TERMINALS - 153 6.5.1. ESTIMATE THE RR CRITERION USING BER APPROACH --- 154
6.5.2. IDENTIFY THE ALTERNATIVES AND CRITERIA --- 154
6.5.3. EVALUATE THE RATINGS OF ALTERNATIVES WITH RESPECT TO EACH CRITERION - 155 6.5.4. NORMALISE THE RATINGS OF ALTERNATIVES WITH RESPECT TO THE QUANTITATIVE CRITERIA --- 156
6.5.5. CALCULATE THE WEIGHTS OF ALL CRITERIA USING AN AHP APPROACH --- 157
6.5.6. DEFINE FPIS AND FNIS WITH RESPECT TO BENEFIT AND COST CRITERIA --- 160
6.5.7. CALCULATE THE DISTANCE CCS OF ALL ALTERNATIVES --- 160
6.5.8. OBTAIN THE WEIGHTED DISTANCE CCS OF ALL ALTERNATIVES --- 160
6.5.9. CALCULATING THE CCS OF ALL ALTERNATIVES --- 160
6.5.10. MODEL VALIDATION --- 161
6.6. A REAL CASE STUDY ON CONTAINER PORT OPERATIONAL SAFETY PERFORMANCE (OSP) --- 161
6.6.1. ESTIMATE RR CRITERION USING BER APPROACH --- 161
6.6.2. IDENTIFY THE ALTERNATIVES AND OTHER CRITERIA --- 166
6.6.3. EVALUATE THE RATINGS OF ALTERNATIVES WITH RESPECT TO EACH CRITERION - 169 6.6.4. NORMALISE THE RATINGS OF ALTERNATIVES WITH RESPECT TO THE QUANTITATIVE CRITERIA --- 170
6.6.5. CALCULATE THE WEIGHTS OF ALL CRITERIA USING AN AHP APPROACH --- 171
6.6.6. DEFINE FPIS AND FNIS WITH RESPECT TO BENEFIT AND COST CRITERIA --- 172
6.6.7. CALCULATE THE DISTANCE CCS OF ALL ALTERNATIVES --- 173
6.6.8. OBTAIN THE WEIGHTED DISTANCE CCS OF ALL ALTERNATIVES --- 173
VIII
6.6.10. MODEL VALIDATION PROCESS --- 175
6.7. RESULTS AND DISCUSSION --- 176
6.8. CONCLUSION --- 176
CHAPTER 7 ― CONCLUSION AND FUTURE RESEARCH SUGGESTIONS --- 178
SUMMARY --- 178
7.1. RESEARCH CONTRIBUTIONS --- 178
7.2. IMPLICATIONS FOR FUTURE RESEARCH --- 181
REFERENCES --- 185
LIST OF APPENDICES --- 217
APPENDIX I-1:FRB WITH BELIEF STRUCTURES FOR CHAPTER 3 --- 218
APPENDIX I-2:THE CONDITIONAL PROBABILITY TABLE FOR THE RISK ESTIMATE (NR) --- 221
APPENDIX I-3:QUESTIONNAIRE USED FOR HES EVALUATION IN CHAPTER 3 --- 224
APPENDIX I-4:ALLEXPERTS EVALUATIONS TABLE IN CHAPTER 3 --- 232
APPENDIX II-1:THE QUESTIONNAIRE USED FOR AHPTECHNIQUE IN CHAPTER 6 --- 237
APPENDIX II-2:EXPERTS EVALUATION ON RISK REDUCTION (RR) IN CHAPTER 6 --- 243
APPENDIX II-3:QUESTIONNAIRE USED FOR ALTERNATIVES RATING IN CHAPTER 6 --- 253
APPENDIX II-4:CHAPTER 3 PUBLICATIONS --- 259
IX List of Figures
FIGURE 1.1:RESEARCH METHODOLOGY ... 11
FIGURE 2.1:PROJECT CAPACITY EXPANSION FOR MAJOR GLOBAL TERMINALS OPERATORS BY 2019 ... 17
FIGURE 2.2:THE WORLD CONTAINER TRAFFIC AND THROUGHPUT (DSC,2007) ... 18
FIGURE 2.3:CONTAINER SHIP SIZE GROWTH AND CAPACITY EXPANSION ... 21
FIGURE 2.4:CONTAINER TERMINAL LAYOUT,ALTENWERDER (CTA) IN HAMBURG ... 23
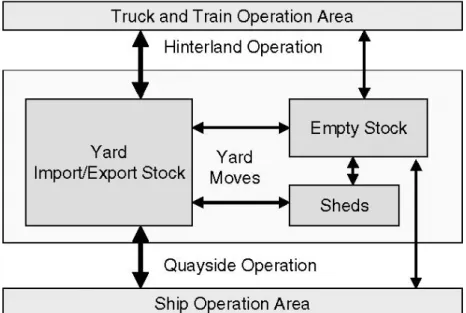
FIGURE 2.5:OPERATION AREAS OF CONTAINER TERMINAL AND FLOW OF TRANSPORTS ... 25
FIGURE 2.6:TRANSPORTATION AND HANDLING CHAIN OF A CONTAINER ... 25
FIGURE 2.7: PROCESSES AT A CONTAINER TERMINAL ... 26
FIGURE 2.8:QUAY CRANES ... 26
FIGURE 2.9:DIFFERENT TYPES OF HANDLING EQUIPMENT ... 27
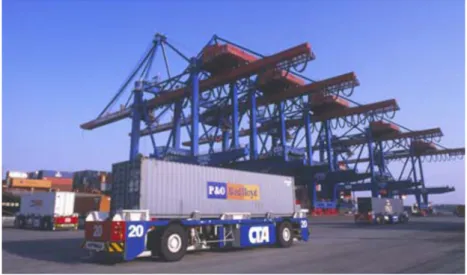
FIGURE 2.10:AUTOMATED GUIDED VEHICLE (AGV) ... 28
FIGURE 2.11:SCHEMATIC TOP VIEW OF THE STACK AREA ... 28
FIGURE 2.12:ANALYTICAL PROCESS OF QRA... 38
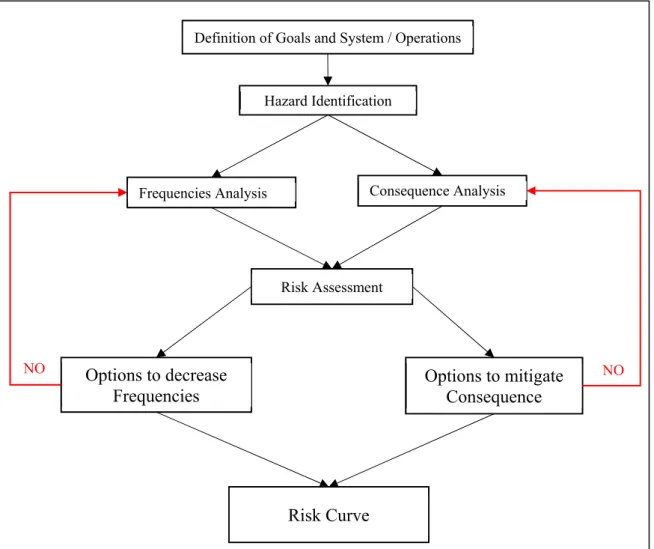
FIGURE 2.13:RISK CURVE ... 39
FIGURE 2.14:THE KEY ELEMENTS OF THE SAFETY CASE CONCEPTS ... 40
FIGURE 2.15:THE TOLERABILITY OF RISK (HSE,1992) ... 41
FIGURE 2.16:FSA PROCESS AND FUNCTIONAL COMPONENTS ... 42
FIGURE 3.1:SCOPE OF CONTAINER TERMINAL OPERATIONS (THE AUTHOR) ... 63
FIGURE 3.2:HIERARCHY OF 24 SIGNIFICANT HAZARDS OF CONTAINER TERMINAL OPERATIONS ... 67
FIGURE 3.3:RISK EVALUATION OF CTTT USING HUGIN SOFTWARE ... 73
FIGURE 3.4:THE EVALUATION OF RE GIVEN A PIECE OF EVIDENCE TO “C=100%HIGH” TO HE1 ... 76
FIGURE 3.5:THE EVALUATION OF RE GIVEN EVIDENCE TO “C=100%HIGH AND R=100% HIGH” TO HE1 ... 76
FIGURE 3.6:THE EVALUATION OF RE GIVEN EVIDENCE TO “C=100%HIGH,R=100% HIGH AND D=100%HIGH” TO HE1 ... 77
FIGURE 4.2:HIERARCHY FOR THE RISK FACTORS DURING TERMINAL OPERATIONS ... 89
FIGURE 4.3:RISK INDEX OF CONTAINER TERMINAL OPERATION’S SYSTEM (IDS) SOFTWARE ... 96
FIGURE 4.4:THE MOST IMPORTANT HES FOR CTOS ... 99
FIGURE 5.1:NATURAL NEURONS (AUTHOR) ... 112
X
FIGURE 5.3:A SINGLE NEURON (AUTHOR) ... 114
FIGURE 5.4:FEED FORWARD NETWORK (AUTHOR) ... 115
FIGURE 5.5:RECURRENT NETWORK ... 115
FIGURE 5.6:GRAPHICAL REPRESENTATION FOR ACTIVATION (TRANSFER) FUNCTIONS... 120
FIGURE 5.7:DATA FLOW PROCESS IN A NEURON ... 121
FIGURE 5.8:FRBN PROCESS ... 125
FIGURE 5.9:FRBEVR PROCESS WITH ANNS ... 126
FIGURE 5.10:OPTIMAL BNANN STRUCTURE WITH A FLOWCHART OF THE LMBP ... 130
FIGURE 5.11:MSE FOR BNANN OPTIMISATION ... 131
FIGURE 5.12:TRAINING, VALIDATION, AND TEST’S MEAN SQUARED ERRORS FOR BNANNS ... 131
FIGURE 5.13:BNANN REGRESSIONS ... 132
FIGURE 5.14:THE SIMULINK MODEL OF THE BNANNS ... 133
FIGURE 5.15:OPTIMAL EVRANN STRUCTURE, WITH A FLOWCHART OF THE LMBP ... 135
FIGURE 5.16:MSE FOR EVRANN OPTIMISATION ... 136
FIGURE 5.17:TRAINING, VALIDATION, AND TEST MEAN’S SQUARED ERRORS FOR THE EVRANNS ... 137
FIGURE 5.18:EVRANN REGRESSIONS ... 137
FIGURE 5.19: SIMULINK MODEL OF THE EVRANN NETWORK ... 138
FIGURE 5.20:SIMULINK MODEL OF THE ANBNEVR NETWORK ... 139
FIGURE 6.1:THE PROCESS OF MULTIPLE CRITERIA DECISION MAKING (MCDM) ... 145
FIGURE 6.2:MEMBERSHIP DEGREE FOR LINGUISTIC RATING ... 156
FIGURE 6.3:HIERARCHICAL STRUCTURE OF CONTAINER PORT OPERATIONAL SAFETY PERFORMANCE ... 167
FIGURE 6.4:RANKING ORDER FOR CONTAINER PORT OPERATIONAL SAFETY PERFORMANCE PLAN ... 175
FIGURE 6.5:COST WEIGHT INCREMENTS ANALYSIS ... 175
XI List of Tables
TABLE 2.1:AVERAGE REGIONAL CONTAINER TERMINAL UTILISATION 2010 AND 2016
FORECAST ... 15
TABLE 2.2:WORLD CONTAINER TERMINAL OWNERSHIP RANKING,2010 ... 16
TABLE 2.3:TOP 10 WORLD CONTAINER PORTS ... 19
TABLE 2.4:LEADING GLOBAL CONTAINER PORTS THROUGHPUT PERCENTAGE RATE ... 19
TABLE 3.1:THE LINGUISTIC GRADES FOR EACH HE ... 60
TABLE 3.2:THE ESTABLISHED FRB WITH A BELIEF STRUCTURE FOR CTRE ... 62
TABLE 3.3:EXPERTS’ KNOWLEDGE AND EXPERIENCE ... 65
TABLE 3.4:PRIOR PROBABILITIES OF NL,NC,NP, AND NI WHEN EVALUATING CTTT ... 73
TABLE 3.5:RISK RANKING INDEX VALUES OF HES... 74
TABLE 3.6:MOST SIGNIFICANT HES IN RED SEA GATEWAY TERMINAL ... 78
TABLE 4.1:UPDATED RISK RANKING INDEX VALUES OF HES FROM CHAPTER 3 ... 95
TABLE 4.2:TRI FOR HES ON THE CTOS ... 97
TABLE 4.3:THE DOB VARIATION OF THE HES ... 100
TABLE 4.4:RI FOR CTOS AND THE VARIATION ON THE HE RISK PARAMETERS PRIOR PROBABILITIES ... 101
TABLE 5.1:BNANNS EXPERIMENTAL DATASETS GENERATED... 129
TABLE 5.2:BNANN CORRELATION COEFFICIENT ... 133
TABLE 5.3:EVRANN EXPERIMENTAL DATASETS GENERATED ... 134
TABLE 5.4:EVRANN CORRELATION COEFFICIENT ... 138
TABLE 6.1:FTOPSISLINGUISTIC VARIABLES AND THEIR TFNVALUES ... 155
TABLE 6.2:THE RELATIONAL SCALE FOR PAIR-WISE COMPARISONS ... 158
TABLE 6.3:RANDOM INCONSISTENCY INDICES (SAATY,1980) ... 159
TABLE 6.4:RISK RANKING INDEX VALUES OF HAZARDOUS EVENTS (HES) ... 162
TABLE 6.5:RR ON DMP BY IMPLEMENTING A1 ... 164
TABLE 6.6:RR ON DMP BY IMPLEMENTING THE ALTERNATIVES ... 165
TABLE 6.7:RR ON DMP BY IMPLEMENTING A1 ... 165
TABLE 6.8:REFERENCING ALTERNATIVES AND CRITERIA ... 168
TABLE 6.9:THE CRITERIA FOR CONTAINER PORT OPERATIONAL SAFETY PERFORMANCE ... 169
TABLE 6.10:ASSESSMENTS OF ALTERNATIVES WITH RESPECT TO CRITERIA ... 169
TABLE 6.11:NORMALISED VALUES FOR COST AND RR CRITERION ... 171
TABLE 6.12:NORMALISED RATINGS OF ALTERNATIVES WITH RESPECT TO THE CRITERIA ... 171
XII
TABLE 6.13:AVERAGED RATINGS OF ALTERNATIVES WITH RESPECT TO THE CRITERIA .. 171
TABLE 6.14:EXPERT A WEIGHTS PAIR-WISE COMPARISON FOR ALL CRITERIA ... 172
TABLE 6.15:EXPERT A WEIGHTS PAIR-WISE COMPARISON FOR ALL CRITERIA ... 172
TABLE 6.16:THE DISTANCE CCS OF ALL ALTERNATIVES ... 173
TABLE 6.17:THE WEIGHTED DISTANCE CCS OF ALL ALTERNATIVES ... 173
TABLE 6.18:CC RESULTS AND RANKING ORDER OF CONTAINER PORT SAFETY PERFORMANCE PLAN SELECTION ... 174
TABLE 6.19:COST WEIGHT INCREMENT EFFECT ON THE ALTERNATIVES ... 176
XIII
List of Abbreviations
AD Axiomatic Design
AGVs Automated Guided Vehicles AHP Analytical Hierarchal Process
ALARP As Low As is Reasonably Practicable ALVs Automated Lifting Vehicles
AnBnEvR ANNs Bayesian Networks Evidential Reasoning ANNs Artificial Neural Networks
ANP Analytic Network Process
APM Arnold Peter Møller – Maersk Group ARIMA Autoregressive Integrated Moving Average BER Bayesian Evidential Reasoning
BN Bayesian Network
BNANNs Bayesian Network ANNs
BP Back-Propagation network
C Consequences (i.e., severity)
CCA Cause-Consequence Analysis
CCs Closeness Coefficients
CR Consistency Ratio
CTOS Container Terminal Operation System CTRE Container Terminal Risk Evaluation
CTU Code of Practice for Packing of Cargo Transport Units
D Detection capability
DFT Department of Transport
DMP Decision Making Problems
DP Dubai Ports International
D-S Dempster-Shafer theory
EBITDA Earnings Before Interest, Taxes, Depreciation, And Amortization ECANSE Environment for Computer Aided Neural Software Engineering
ED Experimental Data
ES Expert Systems
ESD Event Sequence Diagrams
ETA Event Tree Analysis
XIV
FL Fuzzy logic
FMEA Failure Modes and Effects Analysis FMEANNs Failure Modes and Effects Analysis ANNs FMECA Failure Mode Effects and Criticality Analysis FNIS Fuzzy Negative Ideal Solutions
FPIS Fuzzy Positive Ideal Solutions
FRB Fuzzy Rule Base
FRBER FRBN and Evidential Reasoning approach FRBN FRB and Bayesian Network approach
FSA Formal Safety Assessment
FTA Fault Tree Analysis
FTOPSIS Fuzzy Technique for Order Preference GCH Guidance on Container Handling
GDP Gross domestic product
HAZID Hazard Identification
HAZOP Hazard and Operability Study
HEs Hazard Events
HHLA Hamburger Hafen und Logistik AG
HPH Hutchison Port Holdings
HRA Human Reliability Analysis
HRI High Risk Inference
HSE Health and Safety Executive
I Impact of a failure to the resilience of port operational systems ICHCA International Cargo Handling Co-ordination Association ICS the International Chamber of Shipping
ICTOS Internal Container Terminal Operation Safety ICTSI International Container Terminal Services IDS Intelligence Decision System
ILO International Labour Organization IMO International Maritime Organization L Likelihood or occurrence probability logsig logarithmic sigmoid
LRI Low Risk Inference
XV
MARPOL International Convention for the Prevention of Pollution MCDM Multiple Criteria Decision Making
MLD Master Logic Diagrams
MODM Multiple Objective Decision Making MPM Maritime Policy & Management
MSA Marine Safety Agency
MSC Maritime Safety Committee
MSE Minimum Mean Squared Errors
OSP Operational Safety Performance
PEMA Port Equipment Manufacturers Association PHA Preliminary Hazard Analysis
PRA Probabilistic risk analysis
PRN Risk Priority Numbers
PSA Probabilistic Safety Analysis
PSN Port of Singapore
purelin Linear Transfer Function
QC Quay Crane
QRA Quantitative Risk Assessment
R2 Regression
RBD Reliability Block Diagrams RCOs Risk Control Options
RE Risk Estimation
RI Risk Influence
RIx Random Index
RMG Rail-Mounted Gantry
RoS Risk level of the System
RS Reach Stackers
RSGT Red Sea Gateway Terminal co.
RTG Rubber-Tired Gantry
SC Straddle Carriers
SIPG Shanghai International Port Group
SMS Safety Management System
SOLAS Safety of Life at Sea
XVI
TA Task Analysis
tansig Tangent Sigmoid Transfer Function TEU Twenty Feet Equivalent Unit
TFN Triangular Fuzzy Numbers
trainlm Levenberg–Marquardt
TRI True Risk Influence
TT Club Through Transport Mutual Insurance Association Limited UNCTAD United Nations Conferences on Trade and Development UNECE United Nations Economic Commission for Europe USGAO United States Government Accountability Office
1
Chapter 1 ― Introduction Summary
This chapter introduces the research background analysis followed by the discussion of the research aim and objectives. The challenges of conducting the research, the research methodology, and the scope of the thesis are also described. The objectives and hypotheses of this thesis set out a logical platform aimed at addressing the outlined problems. The structure of the thesis is outlined to show how the study addresses the risk-based methodologies for decision support of maritime ports and risk management of maritime container terminals’ operations.
1.1. Background
The impact of maritime activities on the economy is significant for any coastal state. Container terminals are critical and costly engineering systems that enable economic development through the transfer of goods and services between national and international destinations (Vis & de Koster, 2003). Ports are gearing up to meet the challenge of handling mega-vessels capable of carrying 10,000–12,000 Twenty-Feet Equivalent Unit (TEU) and above (Baird, 2006). Accordingly, a container terminal must advance its operational and managerial technology basis (Kang et al., 2008) in order to cope with such progressive developments. Container terminal infrastructure is characterised by large investments, tight time schedules, and evolving technology, sometimes through unproven conditions (Koster et al., 2009). These challenges result in high-risk exposure along with more opportunities to be exploited in terms of risk management. Inland container terminals are, due to their operational business and environmental conditions, exposed to several risks having different consequences (Stahlbock & Voß, 2008).
Research and subsequent improvements in related areas including operational, organisational, economic, business, and natural conditions that affect seaports and marine terminals have been carried out for many years, which is evident in major maritime academic journals such as the Journals of Maritime Policy and Management, Marine Science and Technology, Marine Policy, Offshore Engineering, Offshore Technology, Maritime Economic, Maritime Economic and Logistics, Marine Pollution Bulletin, Transport Management, Transportation Research, Research in Transportation Economics,
2
and Environmental Impact Assessment Review. Improvements based on research can also be seen in other academic journals such as the Journals of Operational Research, Hazardous Materials, Reliability Engineering System Safety, Business Continuity and Risk Management, Economics and Business, World Development, Productivity Analysis, Industrial Economics, Industrial Engineering, Fuzzy Sets and Systems, and Expert Systems with Applications. In addition, international bodies involved in the maritime industry such as the International Maritime Organization (IMO), United Nations Conferences on Trade and Development (UNCTAD), World Bank, European Commission, and Asian Development Bank have been contributing towards the improvement within the five major areas mentioned previously. Current risk assessment methods for maritime container terminals are gradually taking into account dramatic events in security issues such as terrorist attacks. However, the impact on safety aspects has not been addressed adequately in research (Loiset al., 2004; Shang & Lu, 2009). The IMO as a regulatory body since 1958 has proposed many instruments, guidelines and codes related to the maritime industry such as the use of a risk assessment method, including offshore operators, in order to mitigate the risk (Trbojevic & Carr, 2000). This method contributed to the adoption of a Formal Safety Assessment (FSA) (IMO, 2002). Since the adoption of FSA, many parties have been encouraged to contribute evolving developments to perform risk assessment such as maritime ports, and classification societies (HSE, 2001) because risk assessment emerges as an important engineering discipline in the maritime and port industries (Wang & Ruxton, 1998).
The FSA methodology can provide desirable results by mitigating risk and enhancing maritime safety because it has a systematic mechanism that enables decision-making based on risk assessment and, more importantly, the cost-benefit analysis of the risk controlling option (Wang & Trbojevic, 2007). The FSA principles have been widely used by many maritime related industries (Pillay and Wang, 2003a; Bai and Jin, 2016) and other industries involved with risk management. Therefore, in this study, the FSA method will be adopted towards container terminal infrastructure and transportation systems safety to offer a clear and justifiable rationale for a risk management based methodology. Moreover, this research is an in-depth investigation of the risks associated with container terminal infrastructure and transportation systems on operational safety aspects, as well as a description of how to effectively implement the risk management based methodology.
3
Risk assessment techniques in general are a creative practice which benefits the decision-making mechanism (Wang, 2002). Decision makers often encounter the problem of selecting a solution from a given set of alternatives. The chosen alternative is the one that meets certain predefined objectives/goals (Liu et al., 2008a). The criteria of container terminal infrastructure and transportation systems’ decision making are slightly more than alternative choices of risk mitigation options; these criteria also exist to evaluate the resilience and flexibility of strategies aimed at dealing with any disturbances throughout the systems’ lifecycle. Therefore, the challenge for decision-makers is to select the most suitable set of alternatives based on reliability, availability and cost-benefit criteria (Martorell et al., 2010). This research classifies decision problems that arise in container terminal infrastructure and transportation systems in order to develop a risk management framework that applies systemic thinking, logic, and a variety of approaches and tools to frame and potentially solve complex safety issues.
1.2. Justification for the Research and Statement of the Problem
This research is motivated by the lack of an appropriate risk management framework addressing the Operational Safety Performance (OSP) in container terminals and maritime ports that are linked directly to the business functions and decision-making processes within marine ports, especially for the purpose of their operations and management. Furthermore, the problem facing container terminal stakeholders is a lack of research upon which to base safety measures for the stakeholders’ complex terminal activities; a general lack of a model that approximates the risk management realities of the terminal; and confusion over uncertainty, terminology, approaches, and methods in the discipline. There is an imperative need to form a generic model that can highlight the safety issues facing container terminal stakeholders including risk managers, human resource managers, site control managers, safety officers, and port facility security officers.
A gap in knowledge exists concerning the applications of risk management in container terminals and marine port operations. Similarly, there is a need for more practical research at the academic level to improve the best practice of risk management methods, to ensure proper implementation of the methods in these logistics infrastructures, and to cope with potential requirements in the future.
4
The following guiding questions have been generated to ensure that the objectives of this research are met and to provide a base for conducting this research.
What are the hazards or risk sources with uncertainties associated within container terminals and maritime ports affecting safety performance, and how can they be identified?
Hazard, risk, and uncertainty are different terms that need to be distinguished. There are different types and categories of hazards that can endanger a container terminal and/or a maritime port, including personnel, facilities technologies, and environment. While there are different methods and techniques for hazard identification, there are a number of common features of importance.
What are the risk parameters that each hazard would have the greatest impact upon? How would the impact affect the performance safety of container terminals and maritime ports operations, and how can these risk parameters be identified? Risk (R) is a simple value of Likelihood or occurrence probability (L), the Consequences (i.e., severity) (C), and Detection incapability (D) that can be presented as follows (O'Connor, 2001; Braglia et al.,2003; Berg, 2010):
(1.1)
The higher the R for any hazard, the more important it is that corrective action should be taken. However, are there any other risk parameters that can be included for the container terminals and maritime ports operations to improve safety performance?
What are the most appropriate and useful tools for evaluating each risk factor individually (i.e., locally) and for evaluating all risk factors aggregated collectively (i.e., globally) with associated uncertainties for container terminal and maritime port OSP in real practises, and how can these tools be applied?
In any risk-based model application (i.e., risk factors identified and ranked accordingly), human judgement is inevitable, especially when uncertainties are involved. Each risk factor should be evaluated individually for its specific risk estimation locally and its Risk Influence (RI) to a port’s safety system globally. There is a variety of techniques and tools-based software for analysing knowledge-based decision support systems that can be used.
5
How can the identified hazards or risk factors be prioritised and ranked?
The prioritisation of hazards or risk factors is a fundamental step of any safety analysis. All risk factors are ranked locally and globally. Accordingly, there are various approaches that can be used depending on the risk factors under consideration and the particular methodology being employed.
What are the most effective tools to analyse the causes and effects of the most significant identified risk factors, and how can they be employed?
Each risk factor needs to be investigated individually by carrying out a cause and effect analysis, and that analysis should not be limited to known causes; it should also address the potential causes that have not happened yet but that may lead to total or partial loss in the future. All the effects should be identified, taking into account the ones that have occurred. Therefore, a careful analysis is required to ensure that all the potential causes and effects for each risk factor are listed and acknowledged. There are numerous tools and techniques to perform such an analysis.
How can a risk management based methodology and strategy be mapped and implemented for the most significant risk factors locally and globally?
Risk management based methodologies and approaches can be implemented on any system or organisation including container terminals and maritime ports. However, an effective and efficient risk management based methodology and strategy can be applied if an appropriate and detailed safety analysis is done at each step of the process and properly conducted with sufficient knowledge of the system or organisation.
How can the identified hazards or risk factors be mitigated and controlled? The last link to close the risk management based methodology cycle is assigning a proper decision-making tool or technique to select the best available strategies in order to mitigate and control the risk factors. There is no single correct technique for a particular decision problem, but some techniques are more suitable than others based on a wide range of elements related to infrastructural design, planning, and management that help to optimise the operational efficiency of the system or organisation.
6
1.3. Research Objectives and Relevant Hypothesis 1.3.1. Aim of the investigation
This study aims to develop a risk management framework with uncertainty treatment based decision-making analysis methodology that can support the selection of cost effective risk measures for container terminal infrastructure and transportation systems at both the operational and managerial levels on a safety basis.
1.3.2. Research objectives
The main objectives are defined as follows:
I. Analyse the complex activities in the lifecycle of container terminal operations in order to identify the Hazard Events (HEs), (i.e., failure modes in which an equipment or machine failure can occur, also, human error including managerial and container handling procedures). While Hazard is the basic material or behaviour that results in failure.
II. Review the risk assessment and decision-making techniques (quantitative and qualitative) that have been widely developed and applied in safety analysis and engineering design systems, particularly those capable of dealing with uncertainty and incompleteness of risk data records.
III. Develop a risk management framework and the associated supporting modelling techniques to solve complicated safety aspects in container terminals with various types of uncertainties.
IV. Design a risk-based decision-making support system that offers a systemic approach to improve the OSP and decision-making process of container terminals and their implementation in the port industry.
V. Demonstrate the above framework using real test cases. 1.4. Research Achievements
The research hypothesis develops an advanced, novel framework for the assessment of risks and vulnerability within container terminals on a safety basis that enables industrial stakeholders to identify, assess, and mitigate the risk factors with uncertainties that affect
7
container terminal and maritime port OSP. In addition, this research is directed towards a risk-based decision-making analysis methodology for container terminal infrastructure that demonstrates the theory of the strategic risk management approach and reveals the effective implementation of the risk management principle and integration into all functions and processes in complex container terminal and maritime port operations. The objectives of the hypothesis rely on widely used application for uncertainty treatment such as Fuzzy Logic (FL), Bayesian Network (BN), Evidential Reasoning (ER), Analytical Hierarchy Process (AHP), FL and Technique for Order Preference by Similarity to Ideal Solution (FTOPSIS), and Artificial Neural Networks (ANNs). The proposed models are intended to provide practical tools in the application and study of container terminal and maritime port OSP.
1.5. Research Methodology and Scope of the Thesis
The Research methodology formulates the course for solving the research problem in a systematic and rational manner. A Risk management based methodology is an ongoing process to identify, assess, and mitigate risk factors for any system or organisation by setting plans and strategies to control all potential sources of risks associated with uncertainties. The proposed framework affects the effectiveness of risk management based methodology by its ability to re-evaluate the system or organisation and to adjust the mitigation strategy in order to determine the best practice and implementation, even with changed circumstances or environment. Therefore, various methods and techniques to be used throughout the implementation of the methodology are consistently taken into account.
The detailed research methodology is as follows: Section 1: Risk Assessment
Phase 1: Identify hazards through an appropriate literature review and brainstorming session with various experts involved in container terminals and maritime port operations. Phase 2: Develop a Fuzzy Rule Base (FRB) in order to assess the most significant HEs identified.
Phase 3: Develop a generic risk-based method by incorporating an FRB and BN to form an FRBN method using Hugin software. The FRBN method should be capable of helping
8
container terminals and maritime port stakeholders to assess each risk factor (i.e., HE) individually for its specific, local risk estimations.
Phase 4: Develop a generic risk-based method by incorporating an FRB and ER to form an FRBER method using the IDS software to assess all risk factors (i.e., HEs) aggregated collectively for their global Risk Influence (RI). More importantly, the new sensitivity analysis method was developed and carried out to rank HEs by taking into account their specific local risk estimations and their RI to a port’s system safety.
Section 2: Risk Models Simulations
Phase 1: Construct a simulation model BNANNs based on the generic risk method FRBN by employing the ANNs concepts using Matlab software.
Phase 2: Construct a simulation model ERANNs based on the generic risk method FRBER by employing the ANNs concepts using Matlab software.
Phase 3: Construct the AnBnEvR model by integrating BNANNs and EvRANNs models that enable the prediction of the risk magnitude for HEs locally and globally.
The complexity of handling a large amount of data dealing with two different methodologies (i.e., FRBN and FRBER) with reference to its software would burden the stakeholders with non-user-friendly processes to measure, predict, and improve their system safety and reliability performance, motions, and planning of actions. Therefore, two models simulating FRBN and FRBER are constructed.
The constructed models in the simulation section present a high-quality representative model in terms of accuracy and reliability assurance that can provide a favourable solution in the risk evaluation process. The model can help to predict the risk magnitude, explain the real safety performance, and develop a continuous risk management strategy for complex systems such as container terminals and maritime ports. More importantly, it can significantly overcome the mathematical complexity involved in the algorithms of the fuzzy BNs and ER in Section 1 and realise the integrity of BN and ER using ANN. Section 3: Risk Control Options
Phase 1: Use the Analytical Hierarchy Process (AHP) method for determining the relative weights of all criteria identified.
9
Phase 2: Develop a risk control options model (FTOPSIS) by incorporating Fuzzy Logic and TOPSIS.
The best risk mitigation strategies were introduced and evaluated in the form of ideal solutions for mitigating the identified risk factors by offering the preferred safety control measures. These measures, such as automation solutions, had to be capable of addressing both operational efficiency and risk reduction in container terminals.
1.6. Structure of Thesis
Figure 1.1 gives a visual model of the thesis structure that leads the reader to the stated research methodology in Section 1.5. A brief description of each chapter presented in the thesis is as follows.
Chapter 1 corresponds to the research background and justifies conducting this research. Research questions are generated to ensure that the research objectives are met. At the end of the chapter, the risk management framework and structure of the thesis are described.
Chapter 2 reviews the maritime container terminals market to exhibit the impact magnitude of containerisation on container terminal operation. The operational lifecycle of a container terminal operation is described, followed by a careful analysis of the widely applied risk management based methodologies with reference to container terminal safety legislations introduced by national and international parties. Risk, hazard, and uncertainty, all three of which are important terms in the risk management process, are defined and distinguished.
Chapter 3 starts with the first phase of section 1, Risk Assessment, by identifying the most significant HEs in container terminal operation followed by the development of an FRB as the second phase. The third phase is the end of this chapter, where a generic risk-based method (FRBN) is developed in order to assess the most significant HEs identified individually for their specific risk local estimations.
Chapter 4, as the last phase in section 1, concludes the risk assessment process by developing a generic risk-based method (FRBER) to assess all risk factors (i.e., HEs) aggregated collectively for their RI for container terminals and maritime port safety system globally. In addition, a new sensitivity analysis method is developed and carried
10
out to rank the HEs by taking into account their specific risk estimations locally and their RI globally.
Chapter 5 is the first phase of section 2, Risk Models Simulations, and the chapter includes the construction of the simulation model BNANNs for the FRBN method. This simulation model is followed by the second phase of the construction of the simulation model ERANNs for the FRBER method using Artificial Neural Networks (ANNs). The final phase in this section entails integrating the BNANNs and ERANNs in order to construct AnBnEvR, which enables the prediction of the risk magnitude for HEs locally and globally.
Chapter 6 uses the AHP method for determining the relative weights of all criteria identified in the first phase of section 3, Risk Control Options. It is followed by the last phase, which develops a risk control options model using FTOPSIS.
Chapter 7 draws the conclusions and contributes to the knowledge concerning risk management for container terminals and maritime port safety systems. Additional suggestions for further research are recommended.
11
12
Chapter 2 ― Literature Review Summary
This chapter reviews the fundamental elements that influenced and contributed to this research. It commences by highlighting the impact of containerisation growth on maritime container terminals operation taking into account the direct and indirect effects on terminal operation safety including container ships, terminal facilities, technology overview, rules and regulations, and handling equipment interfacing. Also discussed is the range of the comprehensive literature related to container terminal safety and a critical analysis of risk management process in maritime ports.
2.1. Introduction
Containerisation was first introduced in the 1960s, and has subsequently become the most common method for transporting industrial and consumer products seaborne. Consequently, the containerisation development process has cause major transformation among port terminals. Container transportation began in the United States in 1920 with Pennsylvania Railways. Then container transportation expanded to Europe, where McLean Industry Ltd established and developed a connecting system of piggyback and marine transport in 1955. Pan Atlantic Shipping Lines began the first container shipping transportation between New York and Houston in 1956 and later launched Gateway City, the first full container vessel, into operation for the route in 1957 (Inamura et al., 1997). Container shipping is performed by companies that operate frequently scheduled liner services with pre-determined port calls, using a number of owned or chartered vessels of a particular size to achieve an appropriate frequency and utilisation level for each service (Heejunget al.,2015).
Maritime container transportation occupies an increasingly important position in world trade and is the fastest growing sector of international shipping, benefiting from a shift towards unitisation in cargo transport, as well as from world trade developments. The share of containerised trade in the total volume of global trade steadily rose from 11% in 2000 to 14% in 2010 (Drewry, 2009).
Containerisation has a number of advantages compared with other shipping methods, including:
13
Less cargo handling: once the contents of a container are loaded into secure con-tainers, they are not directly handled until reaching the final destination.
Efficient port turnaround: container ships are loaded and unloaded in significantly less time and at a lower cost than other cargo vessels, using quay cranes and other terminal handling equipment.
Highly developed intermodal network: the intermodal industry has developed so-phisticated and intelligent modes to support container transportation, such as physical integration of the container with other intermodal transportation equip-ment, including the staging or storage areas, to final destinations.
As this thesis focuses on container terminal port operations safety, it is necessary first to review and discuss the existing risks outlined in maritime shipping industry literature as a whole, then to concentrate on container terminal port operations safety.
2.2. Container Terminal Market Overview
Ports are characterised by their geographical and operational settings. Each port may have several terminals, and each terminal is operated by one or many operators (Yip et al., 2011). The advent of global terminal operators is a profound organisational change in the development of container terminals. Container terminal operators are firms that operate one or several container terminals at a port. Regulatory requirements, limited land availability, and steep capital requirements for building container terminal capacity all impose high barriers on the container terminal market features (Pawlik et al., 2011). The cost of building infrastructure is highly dependent on the region and type of construction required. Constructing a new container terminal on existing infrastructure can cost several tens of millions GBP (British Pound), whereas the construction of an offshore port can cost several billion GBP.
Many projects involve local governments providing terminal infrastructure, with long-term concessions delegated to the most attractive long-terminal operators. The development of new terminals is often constrained by national planning procedures and legislation, involving many stakeholders throughout the planning process; this system contributes to long lead times, and sometimes results in significant implementation and execution delays. As a result, global growth in new container capacity lags behind growth in container trade (Global Ports, 2011).
14
Logically, shipping lines are the main customers of container terminal operators. Both of them (i.e., shipping lines and container terminal operators), consequently, are mainly dependent on the level of world seaborne trade and the corresponding demand for container terminal services that the level generates.
Increased participation of private investors in managing container ports and the establishment of new ports have both increased pressures on port efficiency (Bergantino et al., 2013). Container terminal operators are compelled to provide high-quality service levels at competitive prices (Araujo De Souza et al., 2003). They should invest in facilities, service, and management systems to gain and sustain competitiveness. They should also increase expenditure to improve crane capacities, information technology efficiency, and transhipment facilities, as well as shorten vessel turnaround movements (Notteboom, 2002).
In 2013, the global container fleet reached 320.9 million Twenty-Feet Equivalent Unit (TEU). A variety of container types make up this fleet. Dry containers are the majority; historically, they comprised about 93% of the fleet, but they decreased to 89% in 2012. While, the other 7% was split between insulated reefer containers and tanks; the latter made up approximately 0.75% for transporting various liquids, and the former occupied the remaining 6.25% of the global fleet. Based on these ratios, the size of the dry container fleet in 2012 was approximately 290.3 million TEU. Reefer containers filled out about 20.1 million TEU of the global fleet, and tank containers comprised about 9.6 million. Subsequently, the global container fleet is set to grow another 1.6 billion TEU in 2013, that made the global container fleet about 421.5 million TEU (WSCa, 2015).
2.2.1. Global containerisation market
Many elements determine terminal performance, including labour relations, numbers and types of cargo handling equipment, quality of backhaul areas, port access channels, landside access, and customs efficiency, as well as potential concessions to international terminal operators. In 2009, terminal operators faced extraordinary challenges posed by the economic crisis, substantially affecting volumes. However, most of the global container terminal operators sustained and returned to a healthy volume growth in 2010 (UNCTAD, 2011).
DSC (2012) attested that average terminal utilisation (i.e. increase the transhipments and the handled container between maritime container ports) grade was generally increasing,
15
and operators were increasing their Earnings Before Interest, Taxes, Depreciation, And Amortisation (EBITDA) compared with 2009; also, EBITDA margins in percentage terms were largely maintained, as shown in Table 2.1, with percentage forecasting up to 2016. As an example, Hutchison Port Holdings (HPH) was the most profitable global container terminal operator, with an EBITDA of over 2 billion U.S. dollars, up from 1.8 billion in 2009. Port of Singapore (PSN) achieved an EBITDA of around 1.3 billion U.S., and Dubai Ports International (DP) World achieved an increased EBITDA of 1.24 billion U.S. compared with 1.1 billion the previous year. International Container Terminal Services (ICTSI), PSN, HPH, DP World, and Hamburger Hafen und Logistik AG (HHLA) achieved an EBITDA margin in excess of 40% in 2010. Arnold Peter Møller – Maersk Group (APM Terminals), meanwhile, increased its margin to just over 20%.
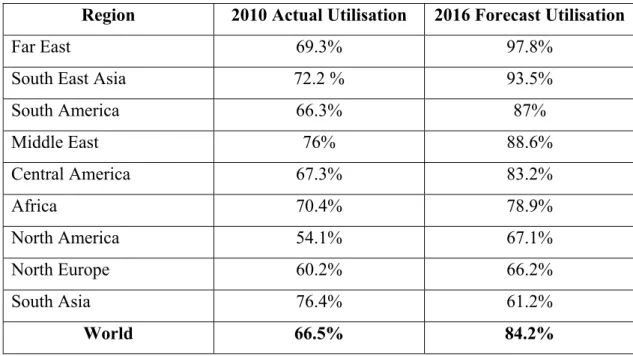
Table 2.1: Average regional container terminal utilisation 2010 and 2016 forecast Source: Drewry Shipping Consultants (2012)
Region 2010 Actual Utilisation 2016 Forecast Utilisation
Far East 69.3% 97.8%
South East Asia 72.2 % 93.5%
South America 66.3% 87% Middle East 76% 88.6% Central America 67.3% 83.2% Africa 70.4% 78.9% North America 54.1% 67.1% North Europe 60.2% 66.2% South Asia 76.4% 61.2% World 66.5% 84.2%
The main international terminal operators broadly maintained their TEU positions in 2010, and those with significant interests in Chinese ports achieved particularly high growth. The international terminal operators’ EBITDA margins remain in a 20–45% range, and the 2014 financial performance was similar to that in previous years, showing the consistency and reliability of container terminal operators’ profitability. However, it is difficult to maintain these margins in the face of the demands from larger container ship deployments, combined with the creation of larger shipping line alliances. These interrelated factors are stimulating significantly greater demands on ports and terminals
16
and have far-reaching consequences, driving up operating costs and capital expenditure requirements (Drewry, 2015).
As a result, by 2013, most shipping companies increased orders of large vessels to improve efficiency and reduce operational costs per TEU. The containership order book grew from 41 million dwt at the beginning of 2013 to 43 million at the beginning of 2014, representing about 20% of the fleet in service (UNCTAD, 2014).
DSC (2012) analyses, as shown in Table 2.2, nominated PSN as the leading global container terminal operator in 2010, with an equity adjusted throughput of 51.3 million TEU, approximately 14% higher than in 2009. Hutchison Ports is ranked second, with 36 million TEU, followed by DP World with 32.6 million TEU, APM Terminals with 31.6 million TEU, and Shanghai International Port Group (SIPG) in fifth with 13.6 million TEU. This shows a steady upward worldwide trend among the leading container operators.
Table 2.2: World container terminal ownership ranking, 2010 Source: DSC (2012)
No. Operator Million
TEU Share percentage 1. PSN 51.3 9.4% 2. HPH 36 6.6% 3. DPW 32.6 6% 4. APMT 31.6 5.8% 5. SIPG 19.5 3.6%
6. China Merchants Holding International 17.3 3.2%
7. COSCO 13.6 2.5%
8. MSC 9.9 1.8%
9. SSAMarine/Carrix 8.6 1.6%
10. Modern Terminals 8.3 1.5%
An additional 168 million TEU of port traffic will bring the global total to nearly 850 million TEU in 2019; this assumes that Asia accounts for more than 60% of the forecast global demand growth and that the deployment of ultra large container ships with new mega alliances is adding to capacity pressures on international terminal operators. The predicted average global container port demands a growth of 4.5% per annum through to 2019 (Drewry, 2015).
17
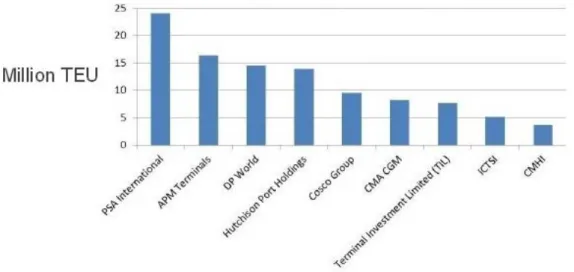
The growing vessels and increase in demands for global maritime container ports are forcing terminal operators to make significant investments in additional capacity. According to DSC (2015), APM Terminals and DP World are most actively developing new projects in the pipeline, but PSN International is adding the most capacity in the port of Singapore. Hutchison, CMA CGM, TIL, and ICTSI also have significant plans, with the latter’s expansion representing a 40% increase over the current capacity of its portfolio, as shown in Figure 2.1. The primary expansion focus of international terminal operators is greenfield developments in emerging market locations, with acquisition and divestment activity decreasing from last year.
Figure 2.1: Project capacity expansion for major global terminals operators by 2019 (DSC, 2015)
2.2.2. Global containerisation growth
World container traffic comprised 38,9 million TEU container movements in 1980. That figure increased to 88,1 million TEU in 1990, to 236,7 million in 2000, and to 419,8 million in 2010. The Compound Average Growth Rate (CAGR) of world container traffic from 2000 to 2010 is estimated at 8.6% compared with a global real gross domestic product (GDP) CAGR of 2.6% for the same period. After a decline of approximately 9% in 2009 caused by the global economic crisis, global container shipping throughput increased by 13.8% in 2010, exceeding pre-downturn volumes. The 2011 world container movements are estimated to reach approximately 439,2 million thousand TEU (Global Ports, 2011).
In the recent years, the use of containers for intercontinental maritime transport has dramatically increased. Between 1990 and 2008, container traffic has grown from 28.7
18
million to 152.0 million TEU, an increase of about 430% (Drewry, 2007). Figure 2.2 displays world container traffic and throughput from 1980 to 2010.
Figure 2.2: The world container traffic and throughput (DSC, 2007)
In 1998, Rayan observed that “the growth in containerized trade continues as more and more cargo are transferred from break-bulk to containers.” Today, more than 60% of the world's deep-sea general cargo is transported in containers, and some routes, especially those between economically strong and stable countries, are containerised up to 100% (Drewry, 2015).
The growth rate of container flows from 2002 to 2020 is still expected to be 7.5% per year. Every major port is expected to double and possibly triple its cargo by 2020 (Liu et al.,2002). At the same time, existing and newly planned terminals are trying to attract as much volume as they can handle, making the container-handling sector very competitive. Furthermore, since globally acting industrial companies have considerably increased their production capacities in Asian countries, the container traffic between Asia and the rest of the world has steadily increased (Wang, 2005).
Ports are crucial in interfacing sea and land transportation systems, and by extension the economy, leading to a high share of imports in GDP and worldwide economic growth. Asian ports continue to dominate the league table for port throughput and terminal efficiency, as shown in Table 2.3.
19
Table 2.3: Top 10 world container ports Source: (WSC, 2015b; Alphaliner, 2015) Rank Port Volume 2011 (Million TEU) Volume 2012 (Million TEU) Volume 2013 (Million TEU) Volume 2014 (Million TEU) 1 Shanghai, China 31.74 32.53 33.62 35.29 2 Singapore 29.94 31.65 32.6 33.87 3 Shenzhen, China 22.57 22.94 23.28 24.04
4 Hong Kong, S.A.R., China 24.38 23.12 22.35 22.23 5 Ningbo-Zhoushan, China 14.72 16.83 17.33 19.45
6 Busan, South Korea 16.18 17.04 17.69 18.68
7 Guangzhou Harbor, China 14.42 14.74 15.31 16.63
8 Qingdao, China 13.02 14.50 15.52 16.62
9 Jebel Ali, Dubai, United
Arab Emirates 13.00 13.30 13.64 15.25
10 Tianjin, China 11.59 12.30 13.01 14.05
The leading global container ports are mostly from China which ranks among the top five along with 7th and 8th place from 2011 to 2014. Singapore placed in the second place of the leading global container ports ranking, while Busan in 6th and Jebel Ali in the 9th (WSC, 2015b; Alphaliner, 2015). The leading global container port is Shanghai, with an equity-adjusted throughput of 35.29 million TEU, approximately 5% higher than in 2013. Table 2.4 shows the throughput percentage rate for each port.
Table 2.4: Leading global container ports throughput percentage rate
Rank Port Throughput percentage rate
1 Shanghai, China 5%
2 Singapore 4%
3 Shenzhen, China 3.3%
4 Hong Kong, S.A.R., China -0.6%
5 Ningbo-Zhoushan, China 12.1%
6 Busan, South Korea 5.6%
7 Guangzhou Harbor, China 7.2%
8 Qingdao, China 7.1%
9 Jebel Ali, Dubai, United Arab Emirates 11.8%
10 Tianjin, China 3.8%
Over the last four decades, the container has been an essential part of unit loads; the concept is now an integral part of international sea freight transportation. With ever-increasing containerisation, the amount of seaport container terminals and competition among them has become quite remarkable. As seen in previous industrial statistical analyses, investments in containerisation continue to grow steadily. Moreover, there is
20
evidence of increased privatisation, and the container shipping industry proved in 2009 that it is economically resilient in the face of adversity. Ports, operators, customers, and investors clearly recognise this advantage.
2.3. Container Terminal Port Operations Overview
Containers entered the market for international conveyance of sea freights almost five decades ago. Containers are large boxes used to transport goods from one destination to another. The use of containers has several advantages, namely less product packaging, fewer damages, and higher productivity (Agerschou et al., 1983). The standardisation of metal boxes also offers customers many advantages, as it protects against weather and pilferage and improves and simplifies scheduling and controlling, resulting in a profitable physical flow of cargo (Steenken et al., 2004).
Container dimensions have been standardised using the term TEU, which refers to one container with a length of 20 feet. Containers are measured in TEU (i.e., 40 and 45 feet containers represent two TEUs). Different types of containers are available; the most common is the standard dry cargo container. Some other types are referred to as special equipment and include open end, open side, open top, half height, flat rack, refrigerated (i.e., reefer), liquid bulk (i.e., tank), and modular containers. All are built to the lengths and widths of standard dry cargo containers.
Every container has a unique unit number, often called a box number, that can be used by ship captains, crews, coastguards, dock supervisors, customs officers, and warehouse managers to identify a container’s owner or shipping user; they are even able to track the container anywhere in the world.
Several modes can be used to transport containers from one destination to another: ships that carry transport over the sea; trucks or trains over land; and some other special modes, which will be in Section 2.3.3, used for handling processes within terminal operations.
2.3.1. Container ship-related port operations
Large container ships are being built with the justification that they will produce economies of scale, as evidenced by the maritime container industry movement towards capacity expansion and growing container ship sizes. Encounter Bay was one of the first to be launched in 1968, with 1530 TEU, and 337 ships of 338,627 TEU were delivered between 1968 and 1973 (Levinson, 2010). In six years, the fleet grew 9.02 times the ship
21
amount and 17.97 times carrying capacity. Vessel production increased beyond 1,000 TEU, becoming the largest group with about 95 new ships, totalling 132,172 TEU. The expansion continued in the 1970s by over 16% per year, delivering 176 ships and totalling 219,072 TEU. The sub-panamax generation also emerged, with 2,000–2,999 TEU, and grew quickly to deploy 61 ships, totalling 152,167 TEU (Tran & Haasis, 2015).
CSCL Globe was the world’s largest container ship at the end of 2014, carrying over 19,000 TEU. The vessel did not keep this title for long, however, as MSC Oscar Mediterranean Shipping announced in early January 2015 that its latest vessel had a nominal capacity of 19,224 TEU (Martín et al., 2015). The container ship revolution is an on-going process, and ships as large as 22,000 TEU are expected to be in service as early as 2018. Capacity expansion and container ship growth since 1968 are described in Figure 2.3.
22
In the quest for economies of scale, capacity expansion is being achieved through growth of ship size rather than the number of ships, because the unit costs of transport service decrease with vessel size; consequently, the earnings per unit of transport service increase with vessel size if freight rates hold steady (LIM, 1998). However, the employment of increasingly large container ships increases the risk of serious overcapacity, especially when several operators are introducing new vessels to the same trade routes. The operator with the largest capacity has an early cost advantage, putting pressure on other operators on mainstream trade routes to move quickly and aggressively for large and economical containerships to stay competitive. There is a strong tendency toward overbuilding, reaching far beyond foreseeable needs (Wu & Lin, 2015).
In regards to container ship safety from an engineering perspective, it is always much easier to increase vessel breadth or width than length in order to maintain ship stability. On the other hand, emerging torsion problems of ship hulls should be considered.
In addition, and more relevant to this research, ports and terminals have responded to the expansion of container ship capacity by making large and rapid investments in infrastructure and handling equipment. These investments could provide adequate service capacity, but the next ship generation, namely echelon, has elicited great concern from terminal operators’ points of view (AGCS, 2014).
Operational managers are confronted with issues besides infrastructure: environmental concerns related to terminal size growth; containership loading problems with an increased quantity of TEU handling; restrictions on cranes; limited outreach; lack of qualified workforce; 24/5 or 24/7 customs check availability; hinterland transportation operations, in which truck route competition is likely to increase; and the most critical aspects of berth depth and time.
The movement towards larger ships presents port authorities with a number of pressing issues regarding investing in stronger tugs: deepening and/or widening approach channels, as large