Biology Faculty Publications
Biology, Department of
4-25-2016
Teaching for Higher Levels of Thinking:
Developing Quantitative and Analytical Skills in
Environmental Science Courses
Adriana Bravo
American Museum of Natural History
Ana Porzecanski
American Museum of Natural History, [email protected]
Eleanor Sterling
American Museum of Natural History
Nora Bynum
The Field Museum
J. Michelle Cawthorn
Georgia Southern University, [email protected] See next page for additional authors
Follow this and additional works at:
https://digitalcommons.georgiasouthern.edu/biology-facpubs
Part of the
Biochemistry, Biophysics, and Structural Biology Commons
, and the
Biology
Commons
This article is brought to you for free and open access by the Biology, Department of at Digital Commons@Georgia Southern. It has been accepted for
Recommended Citation
Bravo, Adriana, Ana Porzecanski, Eleanor Sterling, Nora Bynum, J. Michelle Cawthorn, Denny S. Fernandez, Laurie Freeman, Stuart Ketcham, Timothy Leslie, John Mull, Donna Vogler. 2016. "Teaching for Higher Levels of Thinking: Developing Quantitative and Analytical Skills in Environmental Science Courses."Ecosphere, 7 (4): 1-20. doi: 10.1002/ecs2.1290 source: https://doi.org/10.1002/ ecs2.1290
Adriana Bravo, Ana Porzecanski, Eleanor Sterling, Nora Bynum, J. Michelle Cawthorn, Denny S. Fernandez, Laurie Freeman, Stuart Ketcham, Timothy Leslie, John Mull, and Donna Vogler
I
ntroductIonThe complexity of global environmental and social issues we now face requires citizens and professionals equipped with skills to solve
complex problems. Over the last few decades, science education has strongly encouraged higher education institutions to shift toward the teaching of process skills such as critical think
-ing, data analysis, communication, and team
and analytical skills in environmental science courses
Adriana Bravo,1 Ana Porzecanski,1,† Eleanor Sterling,1 Nora Bynum,2 Michelle Cawthorn,3 Denny S. Fernandez,4 Laurie Freeman,5 Stuart Ketcham,6
Timothy Leslie,7 John Mull,8 and Donna Vogler9
1Center for Biodiversity and Conservation, American Museum of Natural History, New York, New York 10024 USA 2Keller Science Action Center, The Field Museum, Chicago, Illinois 60605 USA
3Department of Biology, Georgia Southern University, Statesboro, Georgia 30460 USA 4Department of Biology, University of Puerto Rico at Humacao, Humacao, PR 00792-4300 Puerto Rico
5Department of Science, Fulton-Montgomery Community College, Johnstown, New York 12095 USA 6College of Science and Mathematics, University of the Virgin Islands, Kingshill, Virgin Islands 00850 USA
7Department of Biology, Long Island University, Brooklyn, New York 11201 USA 8Department of Zoology, Weber State University, Ogden, Utah 84408 USA
9Biology Department, State University of New York, College at Oneonta, Oneonta, New York 13820 USA
Citation: Bravo, A., A. Porzecanski, E. Sterling, N. Bynum, M. Cawthorn, D. S. Fernandez, L. Freeman, S. Ketcham, T. Leslie, J. Mull, and D. Vogler. 2016. Teaching for higher levels of thinking: developing quantitative and analytical skills in environmental science courses. Ecosphere 7(4):e01290. 10.1002/ecs2.1290
Abstract. Professionals with strong quantitative and analytical skills are essential to understanding and responding to current environmental challenges. The goal of this study was to promote and evaluate the development of data analysis (DA) skills in undergraduate students through targeted interventions in environmental science courses. We developed materials to promote practice, instruction, and assessment of four core DA dimensions: the ability to make appropriate calculations, convert data to graphical repre -sentations, interpret graphical or mathematical information, and draw conclusions based on the analysis of data. We integrated two conservation exercises as pre/post assessment tools, flanking differentiated teaching interventions, into selected science courses and used a standardized rubric to measure students’ performance level. We found that students improved their DA skills in a single semester, but the level of improvement varied across skill dimensions. Students struggled with dimensions that require higher levels of thinking such as data interpretation and drawing conclusions. The use of additional exercises tar -geting these dimensions and alternative practices might enhance gains. Importantly, students also gained content knowledge in ecological principles while developing skills, and demonstrated an increase in self- confidence with their DA skills. Our approach and open- access materials can be integrated into existing courses to develop and assess data skills in undergraduate learners.
Key words: data analysis; ecology; process skills; science courses; undergraduate students.
Received 20 July 2015; accepted 28 August 2015; final version received: 7 November 2015. Corresponding Editor: C. D’Avanzo.
† E-mail: [email protected]
Copyright: © 2016 Bravo et al. This is an open access article under the terms of the Creative Commons Attribution License, which permits use, distribution and reproduction in any medium, provided the original work is properly cited.
work, among others (D’Avanzo 2003, National Research Council—NRC, 2003, and NRC 2009, American Association for the Advancement of Science—AAAS 2011). The NRC (2009), for in
-stance, urged the formation of the New Biologist, an individual who has a strong understanding of complex biological systems and is capable of providing solutions to real- world problems. To accomplish this goal, the NRC emphasized the need for biologists with quantitative and analyti
-cal skills. Similarly, the Vision and Change report of the American Association for the Advance
-ment of Science (AAAS 2011) has strongly rec
-ommended the integration of core concepts and competencies (e.g., the ability to use quantitative reasoning) in teaching practices through the use of real- world examples of problem solving.
Instructors have also recognized the need for and importance of developing process skills in undergraduate science education, but imple
-mentation of teaching and assessment practices in this area remains challenging (Labov 2004, Dirks and Cunningham 2006, Coil et al. 2010, Gormally et al. 2012). In a survey of 159 faculty members from a wide diversity of institutions, most respondents identified Problem solving/Crit-ical thinking (80%) and Interpreting data (60%), as the two most important skills to be acquired by undergraduates (Coil et al. 2010). However, 67% felt they did not spend enough time teaching these skills. In a similar survey, over 150 facul
-ty professors identified skills related to inquiry and quantitative skills to be important in under
-graduate education (Gormally et al. 2012), and although about 60% of respondents indicated they teach those skills, it remains unclear how much time they spent doing it. Furthermore, an even smaller percentage of those respondents (40–58%) indicated that they assessed students’ gains in skills. Because teaching efforts are not always paired with assessment there is limit
-ed evidence of the effectiveness of the teaching practices used by the respondents in developing these skills.
There are multiple reasons why orienting teaching practices toward skills development may represent a challenge in science courses. For example, instructors theorize that it requires too much time, comes at the expense of content, is difficult to implement in large classes, and is not effective when students have not first learned
adequate content, have poor study skills, or are resistant to new teaching methods (Coil et al. 2010, Waldrop 2015). Other criticisms include lack of adequate assessment tools, institutional support, and faculty incentives for this approach (Henderson and Dancy 2007, Coil et al. 2010). To overcome these barriers toward skill devel
-opment, multiple initiatives have suggested a curricular reform for broad application at high
-er education institutions (AAAS 2011, And-erson et al. 2011), but implementing this change at the institutional level may require significant time and resources (Colon- Berlingeri and Burrowes 2011, Fukami 2013). On the other hand, changes at course levels are not only more feasible to im
-plement, but they can also provide opportunities to test the effectiveness of teaching practices to
-ward the development of skills, providing valu
-able evidence to support and encourage changes at the institutional level (Colon- Berlingeri and Burrowes 2011, Goldstein and Flynn 2011).
To understand the investment needed for sci
-ence undergraduate students to develop pro
-cess skills and for professors to assess them at the course level, we designed a multi- institution study to investigate classroom teaching practic
-es to promote the development of data analysis skills. We aimed to promote students’ abilities to use quantitative reasoning to represent, analyze, understand, and interpret biological data in con
-cordance with the core competencies identified as key for the next generation of scientists (NRC 2003, AAAS 2011). The main goals of this study were to promote and assess the development of data analysis skills in undergraduate students using feasible teaching practices in current sci
-ence courses. To achieve these goals, we created and validated a set of content- rich instructional materials designed to develop and assess data analysis skills. We piloted these teaching and as
-sessment materials in diverse classroom settings
(e.g., different class sizes and student levels) in a range of courses in general biology, ecology, and environmental science where ecological concepts are emphasized. We also evaluated whether skill development is enhanced by differ
-ent teaching practices in the classroom. In addi
-tion, to assess whether skill development can be achieved without sacrificing content learning, we assessed changes in students’ content knowledge while using instructional materials to promote
skill development. Finally, to determine chang
-es in students’ attitud-es toward their proficiency in the targeted skill, we assessed student self- confidence with their data analysis skills at the beginning and at the end of each course.
M
ethodsWe conducted this multi- institutional study from April 2011 to August 2013. The Institutional Review Board (IRB) of the American Museum of Natural History reviewed potential risks to human subjects and approved an exemption for this project. Similarly, faculty participants obtained IRB exemptions from their respective institutions.
Development and validation of assessment tools Between April and July 2011, we developed and validated a set of instructional materials to be implemented in science courses. We will refer to this set as an instructional unit (IU), which consisted of (1) a rubric for data analysis (DA) skills, (2) two content- rich exercises de
-signed to promote the development of DA skills accompanied by solutions, (3) a pre/post content assessment for each exercise and a scoring guide, (4) a student’s pre/post self- assessment of DA skills, and (5) a light and an intensive teaching intervention. The teaching intervention is an activity to allow students to review and reflect on what is required for high performance on DA skills, so that they can use that knowledge to improve their own skills. We provide further description of the IU components below. The IU can be downloaded by registering as an educator on the Network of Conservation and Practitioners (NCEP) website (http://ncep.amnh .org). This version includes minor revisions based on user feedback provided during the study. Rubric and exercises
To assess DA skills, we—faculty participants and project staff—developed a rubric to score students’ DA performance, and two exercises to promote the development of these skills and to provide content knowledge. In a workshop that convened nine faculty participants and project staff, we designed a DA rubric with elements found in other available rubrics, in
-cluding the Quantitative Literacy, also known
as Quantitative Reasoning, VALUE Rubric (Rhodes 2010) developed and thoroughly val
-idated by the Association of American Colleges and Universities (AAC&U). The resulting rubric included four performance score levels ranging from 1 to 4 (from beginning to exemplary) for four dimensions (three of them from the VALUE rubric) of DA: (1) Calculation, (2) Data represen-tation, (3) Data interpretation, and (4) Drawing conclusions. Faculty participants selected these dimensions based on student needs identified in their own courses. A detailed definition of each rubric dimension can be found in the rubric itself (Appendix S1: Table S1). In the same workshop, we received expert opinion from other faculty participants (16) who were working on other process skills. Through these extensive discussions of the wording and the concepts used in the rubric and the joint de
-velopment of exercise scoring guides, we en
-sured that faculty participants were familiar with the rubric, and had a shared interpretation of it.
Considering the dimensions of the DA rubric, we then adapted two exercises authored by J. Gibbs from teaching modules previously pub
-lished by NCEP (http://ncep.amnh.org) on the topics of Applied Demography and Biodiversity (see Table 1 for further information). We selected these topics based on the syllabi of the courses in the study. With this approach we tried to accom
-modate the use of the exercises over the course of one academic semester without major course modifications. The resulting exercises promoted active learning pedagogies (Handelsman et al. 2007), as they required active engagement of the students to be completed. Each exercise consist
-ed of three main parts: (1) an introduction to the main concepts of the exercise’s topic, (2) a section on data collection and data analysis, and (3), as recommended by the Vision and Change Report (AAAS 2011), a real- case scenario that asked stu
-dents to use information collected during the sec
-ond part of the exercise to take a position or make a decision. To make these exercises comparable to one another, we aligned the tasks for students in each exercise with each of the four dimensions of the DA rubric. Furthermore, we assigned a similar number of points to test each dimension of the DA rubric for each exercise and to each of the two exercises, 33 and 38 points, respectively.
Faculty participants and project staff reviewed different versions of these exercises before and during implementation. In addition, we devel
-oped a detailed scoring guide for each question of the exercises. Each exercise requires a 2- h or two 1-h sessions to be completed by students.
To facilitate data collection, we developed a scoring Excel spreadsheet to enter points ob
-tained by the students in each exercise question, which was linked to a given DA dimension of the rubric. The total points for each dimension were added and automatically converted to a four- point scale to match the rubric levels.
After data collection in this study, we measured the reliability of exercises by calculating the coef
-ficient Cronbach’s alpha (Cortina 1993, Bowling 2009) using students’ rubric scores with the mul-tilevel package in R (R Development Core Team 2012). We obtained Cronbach’s alpha coefficients of 0.6 for exercises 1 and 2 (N = 538 students for each exercise), which indicates an acceptable in
-ternal structure for these assessments following the criterion of Bowling (2009; alpha ≥0.5). Content knowledge questionnaires
To assess students’ content knowledge on the topics of the DA exercises (Table 1), we de
-veloped a short questionnaire. Initially, we developed and reviewed a set of approximately 20 questions for each exercise, including multiple- choice and open- ended types. For fur
-ther review of the questions, two project staff (AB and AP) conducted cognitive interviews with seven volunteer science students (ranging from junior to recently graduated undergrad
-uates) who reflected part of the student pop
-ulation of interest. These interviews lasted between 10 and 15 min. In a one- on- one in
-terview format, we asked each student to read
and answer all questions of the assessment by thinking aloud while the interviewer took de
-tailed notes. By following this protocol (Beatty and Willis 2007), we were able to evaluate the students’ rationale used to construct their an
-swers, and eliminate questions with limited ability to measure students’ knowledge of the exercise content. For example, we excluded questions that were correctly answered with no need for knowledge of the topic targeted in the exercise (i.e., they were too easy), were too general on the topic, were confusing, am
-biguous, or contradictory and/or were not spe
-cifically related to the content of the exercise. We interviewed four students for exercise 1 and five for exercise 2 (some students completed both questionnaires). After reviewing and dis
-cussing our notes, we revised the final ques
-tionnaires to seven multiple- choice and three open- ended questions for exercise 1 and six multiple- choice and three open- ended questions for exercise 2. The total number of points in exercises 1 and 2 was comparable (13 and 15 points, respectively). Each questionnaire re
-quires about 10 min of class to be completed. In addition, we developed an instructors’ scoring guide for each exercise, which contained the correct answers, a solution rubric for the open- ended questions, and points to be assigned to each question.
After data collection, we conducted a post
-validation of the questionnaires. We excluded questions that had ≥70% perfect score on the pre-assessment (Smith et al. 2008), and those for which faculty users reported a poor match with exercise content or poor fit between questions and solution rubric. As a result, the final data set used in this study for exercise 1 included six multiple- choice and two open- ended questions Table 1. Description of the exercises used to promote the development of data analysis skills.
Exercise Topic Title Objectives
Exercise 1 (33 pts.) Applied
demography Parrots and Palms: Estimating the vital statistics of populations to determine best management strategies and sustainable harvest levels
To determine a population’s vital statistics from a set of field observations and to use these statistics to make informed decisions about ways to manage the population
Exercise 2 (38 pts.) Biodiversity What is Biodiversity? A Comparison of
Spider Communities To classify and analyze data on spider communities to explore the concept of biological diversity and to use these data to make decisions in biodiversity conservation
for a total of 10 points; and for exercise 2 included six multiple- choice and two open- ended ques
-tions for exercise 2 for a total of 12- points. Survey of student self- assessment of the skill
To assess changes in student self- assessment of the skill, we developed a four- question Likert- scale (1–4) survey to be administered in a pre/ post format. We used the dimensions of the rubric as a reference for the content of the sur
-vey. Thus, we specifically asked questions related to (1) students’ ability to create appropriate and informative graphs and tables, (2) interpret trends and patterns in data, graphs, and tables, (3) understand and correctly solve equations, and (4) make appropriate and well- reasoned conclu
-sions from data, graphs, and tables. We refined the tool by requesting review and feedback from faculty participants during its development. Completing a self- assessment survey requires 5 min.
Teaching intervention materials
To assess whether the intensity of the teaching intervention affects overall student gains in DA skills over a semester, we developed materials for a light and an intensive teaching interven
-tion. A light intervention was designed to re
-inforce students’ development of DA skills by keeping the intervention from the professors to a minimal level. Here, students received their graded DA rubric from exercise 1 and if ques
-tions arose, professors answered them keeping the total discussion to no more than 10 min. At the end of this discussion, professors re
-minded students that the same rubric would be used to evaluate their performance for ex
-ercise 2. This whole intervention should not last more than 15 min.
On the other hand, we designed an intensive teaching intervention as an in- class study of the skill. For this, students were first introduced to the importance of DA skills and the use of ru
-Fig. 1. Experimental design and main questions within and across semesters. The discontinuous arrow between intensive and light teaching interventions (TI) indicates an interchangeable order. Abbreviations are as follow: SSA = student self- assessment; CA = content assessment; ex 1 = exercise 1; ex 2 = exercise 2; and TI = teaching intervention.
brics. Next, students were presented with a small data set and answers to questions related to data representation, data interpretation and drawing conclusions—similar to the exercises—provided by a hypothetical student. Using the rubric, in groups of 3–6 (depending on class size), students evaluated the answers, and where necessary improved them. Then, students received their scored rubric from exercise 1 and were expected to reflect on that individually after class. Lastly, as homework, students were asked to self- reflect on the activity and answer the following ques
-tions: (1) Which of the different aspects of data anal -ysis is the most challenging for you?, and (2) As you get ready for your next data analysis assignment, what would you use from what you have learned to-day? This whole activity requires a class session of 45–50 min.
Implementation of instructional unit (IU)
Between August 2011 and August 2013, we implemented the IU following the experimental design shown in Fig. 1. By using the IU in a single semester, we were able to evaluate whether students gained DA skills, content knowledge, and self- confidence on their DA skills in courses that used either the light or intensive teaching interventions (Fig. 1; shown by the vertical arrow). On the other hand, comparing gains in DA skills between courses that used the intensive and light teaching in
-terventions in semesters 1 and 2, respectively,
we were able to evaluate whether there was an effect of the intensity of intervention on the students’ overall gains in DA skills (Fig. 1; shown by the horizontal arrow).
We implemented the IU in nine courses: Bio
-logical Principles II: Evolution, Biodiversity, and Ecology; Ecology (5 courses); Environmental Biol
-ogy; General Biology I: Organismal Biol-ogy; and General Biology II offered in eight higher educa
-tion institu-tions from the United States, the U.S. Virgin Islands, and Puerto Rico. Students in the study included both majors and nonmajors, and ranged from freshmen to seniors (Table 2). Four of these courses used the IU with both the light and intensive teaching interventions (each in a semester). In these courses we implemented the IU with the intensive teaching intervention in the first semester followed by the IU with the light teaching intervention in the second one. The other five courses used the IU in a single semester: four used the intensive teaching intervention and one the light teaching intervention. Detailed informa
-tion on the courses and the semesters in which the IUs were implemented is provided in Table 2.
In the following section we provide a detailed description of the implementation of the IU fol
-lowing the experimental design (Fig. 1). Content knowledge questionnaires
To assess students’ gains in content knowl
-edge on the topics of the exercises, we used the content questionnaires before and after Table 2. Institution type, student level, class size, and semester when the instructional unit with the intensive
(ITI) and/or light (LTI) teaching intervention was used for each participating course.
Institution type† Course Student level Class size‡ ITI LTI
Implemented both teaching interventions
Master’s college and university Ecology Sophomore- Senior 20–25 Fall 11 Fall 12 Master’s college and university Ecology Sophomore 60 & 30§ Fall 11 Fall 12
Master’s college and university Ecology Senior 20–25 Spring 12 Spring 13
Doctoral/Research university Environmental Biology Freshman- Senior 220–230 Fall 11 Spring 12 Implemented one of the teaching interventions
Master’s college and university Biological Principles II Freshman 17 Spring 13
Associate’s college Ecology Sophomore 12 Fall 11
Associate’s college General Biology I Freshman 13 Spring 13
Baccalaureate college General Biology II Freshman-
Sophomore 10 Spring 13
Baccalaureate college General Ecology Sophomore 27 Fall 12
† Following the Carnegie Classification of Institutions of Higher Education http://classifications.carnegiefoundation.org/. ‡ Class size given by the number of students.
students completed an exercise in a pre/post fashion. We administered the questionnaires on Applied Demography within the first half of the semester, whereas the questionnaires on Biodiversity within the second half of the se
-mester (Fig. 1). In both cases the exact timing of administration of the questionnaires was subject to the timing of administration of ex
-ercises 1 and 2. The pre-assessments were con
-ducted before students received either a lecture on the exercise topic or the exercise itself as an assignment. In this study, in most courses the assessments did not count toward students’ grades. In two courses students received par
-ticipation points for completing them. New users could choose to use the post-assessments toward students’ grades as students are being tested on content learned in the course. Survey of student self- assessment of the skill
To assess students’ self- confidence on DA skills, we administered the same assessment tool at the beginning and end of the semester in a pre/post format (see Fig. 1). To facilitate administration, the pre-assessment was admin
-istered together with the pre-content assessment of exercise 1 and the post-assessment with the post-content assessment of exercise 2. Students in two courses received participation points for completing the self- assessments.
Rubric and exercises
To assess student gains in DA skills, we used exercises 1 and 2 as a pre- and post-assessment, respectively, over the course of a semester. We administered exercise 1 on Applied Demography within the first half of the semester and exercise 2 on Biodiversity within the second half of the semester. The exact timing of exercise admin
-istration varied among courses depending on their syllabi. We accommodated the use of these exercises during lecture or lab time, depending on course structure and time availability. To measure DA gains at the individual student level, students completed tasks and answered exercise questions individually. Scores of both exercises were used toward students’ grades. Teaching interventions
To assess the effect of the intensity of teaching on gains in DA skills, we used the light and
intensive teaching interventions. In addition to all the assessments previously mentioned, in a given semester we used either the light or intensive teaching intervention as shown in Fig. 1. We implemented the activity designed for a specific teaching intervention sometime between exercises 1 and 2 (Fig. 1). In order to compare the effect of the two interventions, we compared the DA gains observed in four courses (3 Ecology and 1 Environmental biol
-ogy) that used both interventions. In all of these courses we used the intensive intervention in the first semester followed by the light teaching intervention in the second semester (see Table 2). We conducted the intensive teaching intervention during lecture or lab time. None of these activities were used toward students’ grades.
Statistical analysis
To evaluate student gains in DA skills, content knowledge, and self- confidence over the course of one semester, we separated data analysis for the light and intensive teaching interven
-tions, as they represent different treatments. To evaluate the effect of teaching intervention on the overall gain of DA skills, we analyzed data only for the courses that completed both teach
-ing interventions. Data analysis skill gains
To evaluate the total change in DA skills, for each student that completed both exercises, we calculated the total points obtained for each exercise (maximum of 33 and 38 points for exercises 1 and 2, respectively) and converted them to a percentage (up to 100). Using these percentage scores we calculated a normalized change (c) value for each student. The normal
-ized change value is the ratio of the observed change to the total possible change (Marx and Cummings 2007). Each individual c value was calculated as follows:
1). c = (post-pre)/(100-pre); if post > pre 2). c = (post-pre)/pre; if post < pre 3). c = 0; if post = pre
4). drop; if pre = post = 0 or 100
The c values range between −1 and 1. A positive c value indicates a gain, a negative
value indicates a loss and a zero value means no change.
With the individual c values for each student, we calculated the overall average normalized change (cave) for students in all courses grouped separately by light and intensive teaching interventions.
To evaluate the level of change in DA skills among students, we calculated the average nor
-malized gains (cave) for students whose exercise 1 scores (pre-assessment) were below the median score for exercise 1, and for students whose scores were above or equal to the median. In addition, for each group, we compared the scores of ex
-ercises 1 and 2 with a paired Wilcoxon signed- ranked test (Crawley 2007). We conducted these analyses separately for the light and intensive teaching interventions. We calculated c values using R (R Development Core Team 2012) with code developed by AB.
To determine changes at each of the four di
-mensions assessed by the rubric, we compared the points from each dimension of the rubric (4 points maximum) for exercises 1 and 2 using nonparametric paired Wilcoxon signed- rank tests (Crawley 2007). Alpha values were Bonfer
-roni corrected (Gotelli and Ellison 2004).
We repeated the same analyses for the three Ecology courses where both the IU with a light and intensive teaching interventions were used (Table 2). Students in these courses were all bi
-ology majors and mostly upper level students (Table 2). This analysis allowed us to have bet
-ter insight into students’ gains in DA skills when controlling for student level and course.
In addition, we evaluated gains among cours
-es. We pooled the data from the same courses and then compared their students’ normalized change values (c) using a nonparametric Krus
-kal–Wallis test (Zar 1999). If significant differ
-ences arose, we conducted paired comparisons between courses using nonparametric Wilcoxon signed- rank tests (Crawley 2007) with a Bonfer
-roni adjustment (Gotelli and Ellison 2004). We evaluated courses that used the light and inten
-sive teaching interventions independently. For each course, we also evaluated the gains by com
-paring scores of exercise 1 (pre-assessment) to scores of exercise 2 (post-assessment) with non
-parametric paired Wilcoxon signed- rank tests (Crawley 2007).
Content knowledge
We analyzed the content gains for each ex
-ercise. For each pre/post paired content assess
-ment, we calculated the normalized change using the total percentage scores. With these values we then calculated the average normal
-ized change and the standard error for the whole group of students evaluated. We con
-ducted these calculations for the light and in
-tensive teaching interventions. We compared the total percentage score of the pre- versus the post-content assessments using a nonpara
-metric paired Wilcoxon signed- rank test (Crawley 2007) with a Bonferroni adjustment for the alpha values.
Student confidence self- assessment
For each individual student, we averaged the scores for the four Likert- scale (1–4) self- assessment questions of pre and post self- assessments. With each paired average score, we calculated the normalized change for each individual student for which we used the value of 4 as the maximum possible score to be obtained if student felt highly confident of their DA analysis skills. We used data only from students who completed both exercises 1 and 2. In addition, we compared the average scores of each pre- versus post-assessment question using a nonparametric paired Wilcoxon signed- rank test (Crawley 2007). Alpha values were Bonferroni corrected (Gotelli and Ellison 2004).
Correlations between gains in skill, self- confidence, and content knowledge
We explored the correlation between changes in skill and self- confidence, as well as the cor
-relation between changes in skill and content knowledge using Spearman correlations (Crawley 2007). For the latter, we used the average score of the content assessments for exercises 1 and 2. We conducted the correlation analyses first by pooling all the data of the light and intensive teaching intervention and then separating the data by teaching intervention.
Effect of teaching intervention
To determine the effects of teaching inter
we used data from four courses that completed both teaching interventions (Table 2). We tested for the effect of light versus intensive teaching interventions using a linear mixed- effects model (LMM). We used the percentage score difference between exercises 2 and 1 as the response vari
-able and institutions as a random factor (Faraway 2006). We checked for normality of the residuals of the response variable by using a qqplot (Faraway 2006). We used the difference between total percentage scores of exercise 2 and 1 because normalized change values are not normally distributed and do not have a known distribution.
All calculations and statistical analyses were performed using R (R Development Core Team 2012).
r
esultsOverall gains in data analysis skills
On average, students gained DA skills within a single semester. While exercises were admin
-istered to approximately 750 students during the study period, we analyzed data from a total of 538 students who completed both ex
-ercises over the course of a single semester. In courses where the IU with a light teaching intervention was used (N = 238 students), 172 students (72%) gained DA skills (positive c
value). On average, students improved their performance by 29% (cave = 0.29). In addition, for exercise 1, 133 students scored below the median score of 67% and 105 scored equal to
or above this median score. On average, stu
-dents scoring below the median showed higher gains than students with percent scores equal to or above the median (Table 3). They im
-proved their DA skills by an average of 35% with 85% of them showing gains (positive c
values). This gain was reflected as a statistically significant increase in exercise 2 scores compared to exercise 1 (V = 999.5, P < 0.001; Fig. 2). On the other hand, students scoring equal to or above the median improved their DA skills by an average of 21% with 56% of them showing positive gains (Table 3). For these students, although there was an average gain (positive
cave value), there was no statistically significant change between the scores for exercises 1 and
2 (V = 2515, P > 0.05; Fig. 2).
In the courses where the IU with an intensive teaching intervention was used (N = 300 stu
-dents), 165 students (55%) gained skills on DA (positive c values). Students improved on aver
-age by 15% (cave= 0.15). Of the total number of students, 134 scored below to the median score of 73% and 166 equal or above the median score. Students below the median improved their DA skills by an average of 17% with 61% of them showing positive gains, while students above the median improved their DA skills on average by 13% with 50% of them having positive gains (Table 3). As was the case with the light interven
-tion, score increase from exercise 1–2 was signif
-icant for students with scores below the median
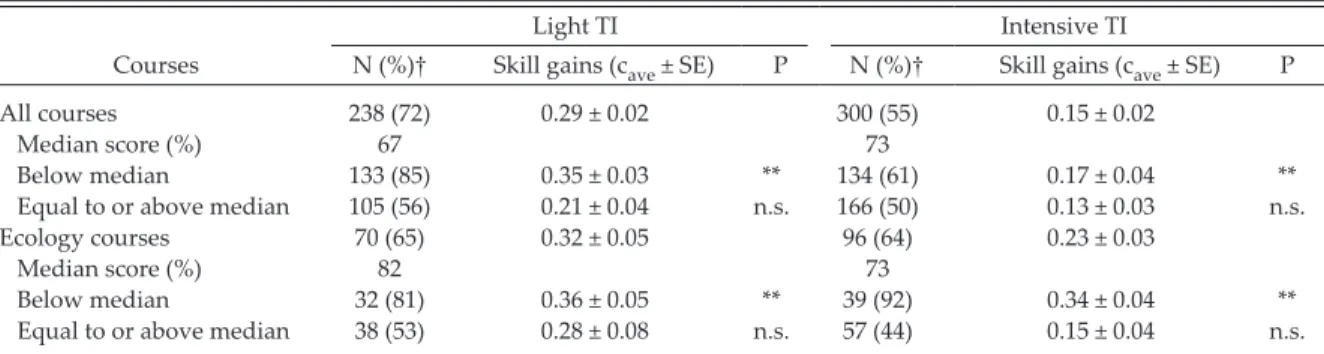
(V =2874.5, P <0.001) but not for students equal to or above the median (V =7344, P >0.05; Fig. 3). Table 3. Overall average gains for all and ecology courses that used the instructional unit for data analysis with
the light and intensive teaching interventions (TI). Courses
Light TI Intensive TI
N (%)† Skill gains (cave ± SE) P N (%)† Skill gains (cave ± SE) P
All courses 238 (72) 0.29 ± 0.02 300 (55) 0.15 ± 0.02
Median score (%) 67 73
Below median 133 (85) 0.35 ± 0.03 ** 134 (61) 0.17 ± 0.04 **
Equal to or above median 105 (56) 0.21 ± 0.04 n.s. 166 (50) 0.13 ± 0.03 n.s.
Ecology courses 70 (65) 0.32 ± 0.05 96 (64) 0.23 ± 0.03
Median score (%) 82 73
Below median 32 (81) 0.36 ± 0.05 ** 39 (92) 0.34 ± 0.04 **
Equal to or above median 38 (53) 0.28 ± 0.08 n.s. 57 (44) 0.15 ± 0.04 n.s.
Notes: Two asterisks indicate highly significant gains and n.s. no significant gains between exercises 1 and 2 using a paired Wilcoxon signed- rank test.
A summary of this section’s results is provided in Table 3.
A more detailed analysis of the data shows that overall students improved their levels of performance in most dimensions. Students sig
-nificantly improved in Data representation, Data interpretation, and Drawing conclusions in courses where the IU with a light teaching intervention was used (N = 238 students; P <0.0025). How
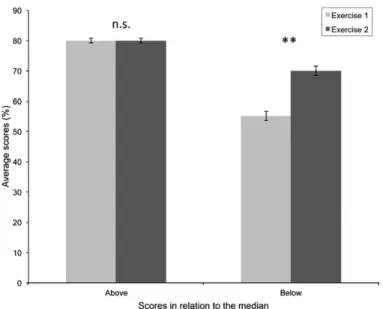
-ever, the achievement level for exercises 1 and Fig. 2. Average scores for exercises 1 and 2 of students who scored above or equal to (N=105) and below (N= 133) the median of 67% in courses that used the instructional unit with a light teaching intervention. Asterisks indicate significant differences (P <0.001) and n.s. indicates no significant differences (P >0.05). Error bars are SE of the mean.
Fig. 3. Average scores for exercises 1 and 2 of students who scored above or equal to (N = 166) and below (N = 134) the median of 73% in courses that used the IU with an intensive teaching intervention. Asterisks indicate significant differences (P <0.001) and n.s. indicates no significant differences (P >0.05). Error bars are SE of the mean.
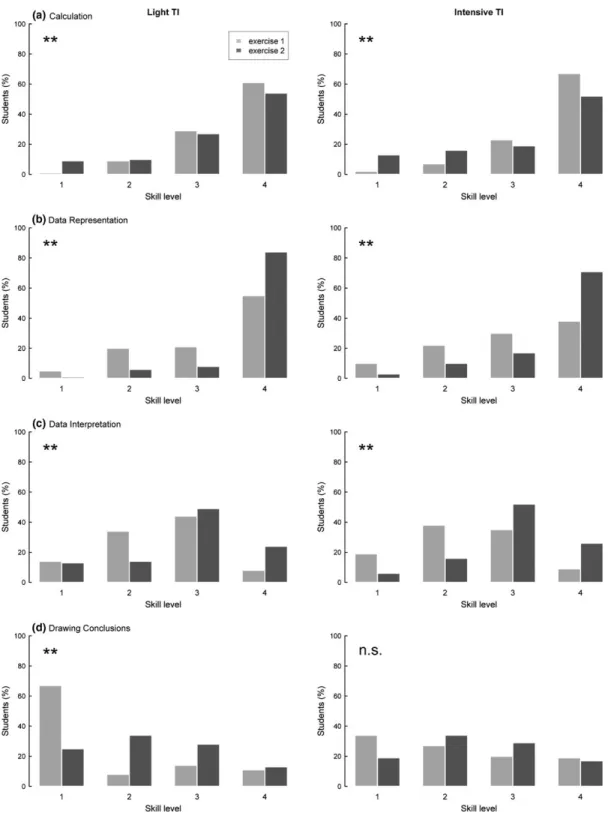
Fig. 4. Frequency distribution of students’ performance within the four levels of proficiency for data analysis skills (1 = lowest, 4 = highest) when using the instructional unit with the light (N = 238 students) and intensive (N = 300 students) teaching interventions. Asterisks and n.s. indicate significant (P <0.0025) and no significant differences (P >0.0125), respectively, between the pre- and post-assessment rubric scores tested with the paired Wilcoxon test with a Bonferroni correction.
2 varied among dimensions (Fig. 4). In terms of
Data representation, most students achieved the highest performance level in exercise 2 (Fig. 4b), while for Data interpretation most students first achieved a level- 3 followed by an increase in the percentage of students that achieved a level- 4 of performance (Fig. 4c). In the case of Drawing con-clusions, most students achieved the lowest level of performance in exercise 1 but they moved to higher levels in exercise 2 (Fig. 4d). In courses where the IU with the intensive teaching inter
-vention was used (N = 300 students), students improved significantly in Data representation
and Data interpretation (P <0.0025). However, al
-though they improved, they did not significantly change their performance in Drawing conclusions
(P <0.0125). In the case of Data representation and
Data interpretation, most students achieved the highest level of performance in exercise 2 (Fig. 4b and c). In all courses, students significantly de
-creased their level of performance in Calcula-tion (P <0.0025) although most students already showed the highest level of performance of this dimension in exercise 1 (Fig. 4a).
Gains in data analysis skills in ecology courses On average, students gained DA skills within a single Ecology course. In the three courses where the IU with a light teaching intervention was used, students (N = 70 students) on av
-erage improved their performance by 32%. In addition, students with scores in exercise 1 below the exercise 1 median score of 82% showed higher average gains than students with scores equal to or above the median score.
Similarly, for the ecology courses that used the IU with an intensive teaching intervention, students improved on average by 23%. Students with scores in exercise 1 below the exercise 1 me
-dian scores of 73% showed higher average gains compared to students with scores equal or above the median scores. We present detailed results of the analyses for the Ecology courses in Table 3.
Students improved their levels of performance in some of the rubric dimensions. In all three Ecology courses that used the light as well as in
-tensive teaching interventions, students signifi
-cantly improved their skills in Data representation
and Data interpretation (all P <0.0025) but did not Fig. 5. Normalized changes for Ecology (N = 70 students), Environmental Biology (Env Bio; N = 161 students), and General Biology II (Gen Bio II; N = 7 students) courses that used the IU with the light teaching intervention. Boxplots show the median, upper, and lower quartiles, highest and lowest data values.
improve in Drawing conclusions (P >0.0125). For
Data representation and Data interpretation, how
-ever, the level of achievement for exercises 1 and 2 varied between dimensions (Appendix S1: Fig. S1). For Data representation and Data interpretation
the patterns were similar to ones reported for all courses (Appendix S1: Fig. S1B, C), while for
Drawing conclusions, there was no improvement (Appendix S1: Fig. S1D). In the case of Calcula-tion, students did not improve their levels of skill in courses with the light teaching intervention, but they significantly decreased their level of
performance with the intensive teaching inter
-vention (P <0.0025). However, similar to what we reported for all courses, most students already showed the highest level of performance of this dimension in exercise 1 (Appendix S1: Fig. S1). Gains in data analysis skills in different courses
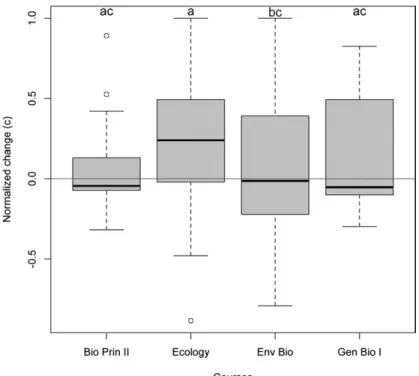
Gains in DA skills as measured by the nor
-malized change varied among courses. We found no significant differences among the level of DA skill gains (cave values) of the three courses— Ecology (N = 70 students), Environmental Fig. 6. Normalized changes for the Biological Principles II (Bio Princ II; N = 13 students), Ecology (N = 125 students), Environmental Biology (Env Bio; N = 149 students), and General Biology I (Gen Bio I; N = 13 students) that used the IU with the intensive teaching intervention. Boxplots show the median, upper, and lower quartiles, highest and lowest data values.
Table 4. Gains in students’ content knowledge measured as the average normalized change (cave) and changes in scores (%) between the pre- and post-content assessments of exercises 1 and 2 when using the instructional unit with the light and intensive teaching interventions (TI).
Content assessment
Light TI Intensive TI
N Gains (cave ± SE) V P N Gains (cave ± SE) V P
Exercise 1 137 0.12 ± 0.03 217 0.21 ± 0.02
Pre- vs. postscores 1338 <0.01 1194 <0.01
Exercise 2 110 0.27 ± 0.04 233 0.25 ± 0.03
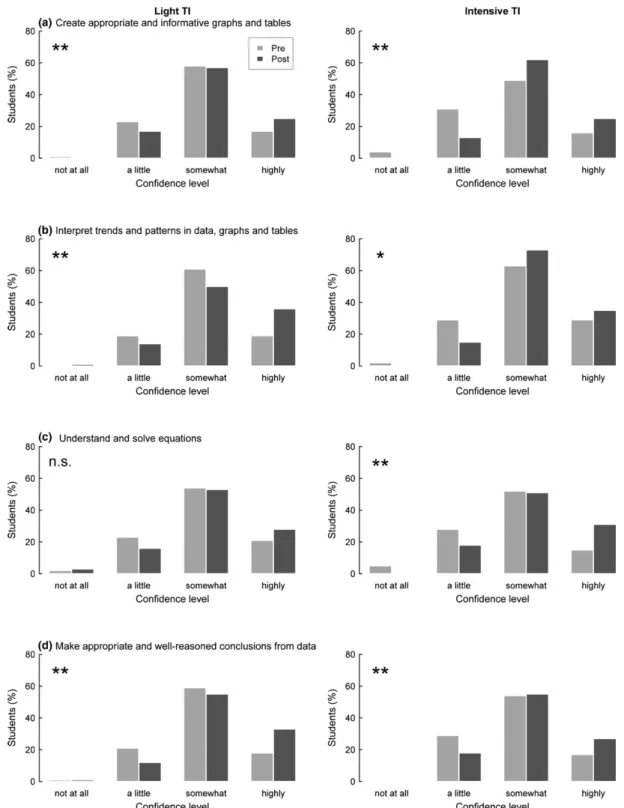
Fig. 7. Frequency distribution of students’ self- assessed confidence levels with their data analysis skills when using the instructional unit with the light (N = 207 students) and intensive (N = 123 students) teaching interventions. One and two asterisks indicate significant differences between pre- and post-assessment scores with P <0.0125 and P <0.0025, respectively, and n.s. indicates no significant differences (P >0.0125) tested with the paired Wilcoxon test with a Bonferroni correction.
Biology (N = 161 students), and General Biology II (N = 7 students)—that used the IU with the light teaching intervention (K = 4.35, P > 0.05; Fig. 5). On the other hand, we found significant differences among the level of gains of the four courses—Biological Principles II (N = 13 stu
-dents), Ecology (N = 125 stu-dents), Environmental Biology (N = 149 students), and General Biology I (N = 13 students)—that used the IU with the intensive teaching intervention
(K =18.32, P <0.01; Fig. 6). A post-comparative analysis among these courses shows a significant difference only between the Ecology and Environmental Biology course (W = 11998,
P < 0.001; Fig. 6).
In addition, within each course the differ
-ence between scores of exercises 1 and 2 varied. From the three courses that used the IU with a light teaching intervention, Ecology and Envi
-ronmental Biology showed significant improve
-ment between scores of exercise 1 and exercise 2
(V =807, P =0.01, and V =2476, P <0.01, respec
-tively), whereas General Biology II did not show a significant improvement (V =19, P >0.05). On the other hand, from the four courses that used the IU with the intensive teaching intervention, only Ecology showed a significant improvement
(P =1961, P <0.01), whereas Biological Principles
II, Environmental Biology, and General Biology I did not show significant improvement (V =56,
P >0.5; V =6032, P <0.05; and V =36, P >0.05, respectively).
Gains in content knowledge
Students gained content knowledge related to the topics of exercises 1 and 2 with the light and intensive teaching interventions. For exercise 1, the normalized change indicates a gain of 12 and 21% for students that experienced the light (N = 137 students) and intensive (N = 217 students) teaching interventions, respectively. For exercise 2, we found a gain of 27 and 25% with the light (N = 110 students) and intensive (N = 233 students) teaching interventions, re
-spectively. Values of normalized change (c) and number of paired assessment for exercises 1 and 2 under the two teaching interventions are shown in Table 4. In addition, we found sig
-nificant differences between the pre- and post-content assessment scores for exercises 1 and 2 (all P < 0.01; see Table 4 for details). Note that the numbers of paired assessments are lower than the number of students that completed both exercises as not all of them completed the pre- and post-assessments for exercises 1 or 2. We did not use data from students that completed the content assessments but not the exercises, as we were interested to know if students can learn content while prac
-ticing DA skills.
Gains in student self- confidence
Students’ self- confidence in their DA skills increased over a semester with the light (N = 207; cave = 0.10 ± 0.01) and intensive (N = 123; cave = 0.12 ± 0.02) teaching interven
-tions. Students self- reported confidence in
-creased when judging their abilities to create appropriate and informative graphs and tables (Fig. 7a), interpret trends and patterns in data, graphs, and tables (Fig. 7b), understand and correctly solve equations (Fig. 7c), and make appropriate and well- reasoned conclusions from data, graphs and tables (Fig. 7d). These increases in self- confidence were statistically significant
(P < 0.003; Table 5) with the exception of one instance: ability to understand and solve equa
-tions with a light teaching intervention
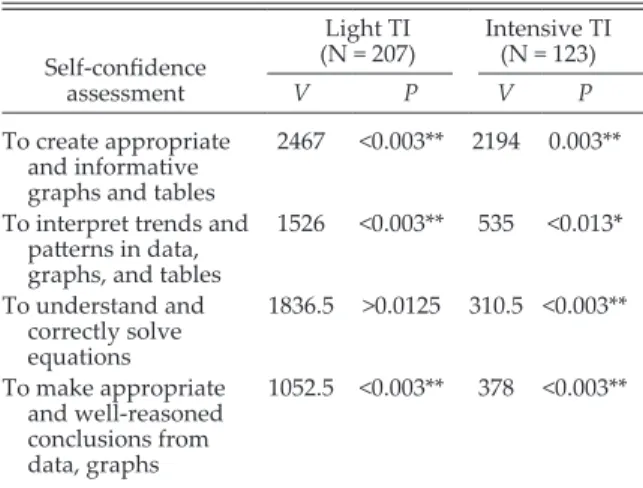
(P > 0.0125). Overall, most students reported Table 5. Changes in students’ self- confidence with
their data analysis skills before and after using the instructional unit with the light and intensive teach -ing interventions (TI). P values are Bonferroni adjusted. Self- confidence assessment Light TI (N = 207) Intensive TI (N = 123) V P V P To create appropriate and informative graphs and tables
2467 <0.003** 2194 0.003** To interpret trends and
patterns in data, graphs, and tables
1526 <0.003** 535 <0.013* To understand and correctly solve equations 1836.5 >0.0125 310.5 <0.003** To make appropriate
and well- reasoned conclusions from data, graphs
1052.5 <0.003** 378 <0.003**
Note: One and two asterisks indicate significant differences between the pre- and post-assessments scores with P < 0.0125 and P < 0.0025, respectively.
to be somewhat confident with their DA skills at the beginning of the semester (Fig. 7). Similar to the content knowledge assessment, we used data only of students that completed both pre- and post self- assessments and exercises 1 and 2, as we wanted to determine the effect of using the exercises on student self- confidence. Correlations between gains in skill, student self- confidence, and content knowledge
Our results indicate no correlation between skill gains and self- confidence (N = 315 students; ρ = 0.037; P = 0.5; Appendix S1: Fig. S2) or between skill gains and content knowledge (N = 216 students; ρ = 0.063; P >0.05; Appendix S1: Fig. S3) for students that participated in the study. No correlations were found either when students were separated by light and intensive teaching interventions. Note that over
-all more students completed the self- confidence than the content knowledge assessment. Effect of teaching intervention
Contrary to our expectations, the result of the linear mixed- effects model shows a signif
-icant effect of the light teaching intervention on skill gains (N = 476 students; F(1,471) = 9.75;
P < 0.01). However, when looking only at the three Ecology courses that used the light and intensive interventions, we found no effect of teaching intervention on student skill gains (N = 166 students; F(1,162) = 0.15; P = 0.7).
d
IscussIonStudents gain data analysis skills in a single semester Our results show that students can improve their data analysis (DA) skills in a single se
-mester. Despite the diversity of the biology courses in which the instructional unit was im
-plemented (e.g., size and type of institution, course level, course size), most students improved their overall DA skills with both the light and the intensive teaching interventions. Moreover, students who were less proficient at the begin
-ning of the semester made the most progress, which could indicate the effectiveness of our exercises, particularly for those students needing the most support (Dirks and Cunningham 2006).
We found, however, that some DA dimensions are more challenging to students than others.
A detailed analysis of the exercise components linked directly to each rubric dimension reveals that some dimensions may require different at
-tention and may be more effectively targeted through different activities than those used in this study (e.g., longer term or more intensive). In
Calculation, although there was a loss between ex
-ercises 1 and 2, most students achieved the high
-est level of proficiency in both exercises. Students in Ecology courses, most of which are upper lev
-el, were more proficient in Calculation (Appendix S1: Fig. S1A) compared to students in lower level courses (Fig. 3a). A study by Speth et al. (2010) found that although most students in Introducto
-ry Biology courses entered with low proficiency in calculation skills, practice of these through an entire semester significantly improved students’ performance. Thus, high levels of performance in calculation skills seem to be achievable through a single course and the high performance observed in the Ecology courses is probably the contribu
-tion of previous biology, math, chemistry, and physics courses taken by students. In addition, despite our efforts to make both exercises compa
-rable, the small loss observed in this dimension may be attributable to subtle differences in the difficulty of tasks required between exercises for this particular dimension.
Of the other skill dimensions, our exercises ef
-fectively targeted the development of Data repre-sentation. In contrast, for dimensions that required higher orders of thinking, such as Data interpre-tation and particularly Drawing conclusions, stu
-dents in general faced more challenges to achieve high- performance levels. In the former, although there was a significant improvement, most stu
-dents achieved a level- 3 performance, not the highest level of proficiency. In the latter, most students not only started with low- performance levels but also did not achieve high- performance levels in the second exercise. To assess this di
-mension of DA, in each exercise we presented students with a real- world conservation scenario in which they were tasked to provide recommen
-dations, justifications for the recommen-dations, and alternative scenarios that could change their recommendations. These questions tested the students’ ability to analyze, evaluate and draw conclusions, and, as other studies have shown (Kitchen et al. 2003, Picone et al. 2007, Colon- Berlingeri and Burrowes 2011), students find
these high levels of thinking skills challenging to achieve. However, despite the small propor
-tion of students who attained high proficiency levels toward the end of the semester, there is an overall positive trend toward higher proficiency levels that is encouraging considering the use of only two exercises over a semester with brief teaching interventions and minimal course mod
-ifications. The use of additional exercises or dif
-ferent interventions targeting these dimensions might enhance gains. Additionally, to minimize confounding factors when assessing the effect of our exercises on skill development of each indi
-vidual student, we used an experimental design that required students to complete exercises indi
-vidually. We, however, believe that collaborative and cooperative work when using these exercises has the potential to boost skill gains (Kitchen et al. 2003, Smith et al. 2009). Thus, we recom
-mend that faculty first encourage development of higher thinking and reasoning skills by using questions with similar constructs to the ones in this or other studies (e.g., Kitchen et al. 2003) for students to exercise their skill development on a regular basis, and second, to use these activities combined with collaborative work.
Student gains of data analysis skills vary among courses
Although most students participating in the study gained DA skills measured as a normal
-ized change value, we observed that on average these skill gains varied among courses. We observed that even though not all differences among courses were statistically significant, some courses performed better than others. An explanation for the observed differences could be related to the level of the students enrolled in each course evaluated. For instance, the courses oriented to freshman level students— Biological Principles II, General Biology I, and General Biology II—showed lower performance than a more advanced course such as Ecology. Interestingly, answers to a faculty questionnaire administered toward the end of the project indicate that professors of these first year courses felt the exercises were challenging for their students because of their limited level of math
-ematical skills (as also shown by Speth et al. 2010), and because of the lack of knowledge of some ecology concepts related to the
exercises. We, however, do not discard other explanations for the low or no gains observed as sample size (class size) of these courses was small. In the case of the Environmental Biology course—where students ranged from freshman to senior levels—we observed a mixed- pattern in gains between the IU with light and intensive teaching interventions. In the semester that used the IU with the intensive teaching intervention, we observed no significant gains for the whole course, whereas in the semester that used the IU with the light teaching intervention we ob
-served highly significant gains. A closer look at the scores of exercises 1 (pre-assessment) and 2 (post-assessment) in each semester, reveals that most students that used the IU with the intensive intervention started at a higher level (~70% of the total exercise 1 score) than most students in the semester that used the light teaching intervention (~60% of the total exercise 1 score; Appendix S1: Figs. S4 and S5), thus factors other than the proportion of freshman students enrolled may explain the lack of sig
-nificant gains for the whole course in the se
-mester that used the IU with the intensive teaching intervention such as exposure of stu
-dents to other courses. However, this lack of significant gains observed at the course level in some courses should not discourage profes
-sors of using the IU as almost 50% of the students gained DA skills (normalized gain values >0), for instance, in the Environmental Biology course. We believe the exercises are valuable tools for exposing students to DA skill development. If professors teaching at the fresh
-man level feel the exercises are too challenging for their students, we encourage them to use the construct of our exercises to build analogs for their courses and thus promote development of DA skills at early stages of students’ careers (Speth et al. 2010). Another explanation for the differences observed could be related to the teaching practices used in each course. For in
-stance, it is well documented that active teaching improves student performance in science courses (Handelsman et al. 2007, Smith et al. 2009, Freeman et al. 2014) and even though we de
-signed the exercises of the IU to promote active teaching, we did not control for the approach used toward the learning of concepts and an
the frequent use of active teaching activities between exercises 1 and 2 could have boosted the improvement level of students’ analytical skills (Kitchen et al. 2003).
Students gain content knowledge while practicing their data analysis skills
Learning content knowledge and DA skills are equally important in science education and can be achieved simultaneously by carefully designing exercises or questions framed in the topics of the course, as in this study. This approach not only allows students to acquire knowledge but also to apply it in a relevant thematic context while practicing process skills. We recognize that implementing these teaching approaches requires some degree of compromise with the amount of time designated to cover large volumes of content (Kitchen et al. 2003). However, we strongly believe that to achieve current science education goals, science educators may need to embrace the “less is more” approach (Handelsman et al. 2007) and accept it as a beneficial trade- off for science education (D’Avanzo et al. 2012). The lack of correlation between content and skill gains found in this study is consistent with previous evidence showing that gains in content knowl
-edge and scientific reasoning skills are not directly correlated (Bao et al. 2009). We therefore rec
-ommend these two components be assessed in
-dividually but taught together through learning experiences that target both.
Students gain confidence in their skills
We find an overall increase in students’ self- reported confidence with respect to their DA skills, although most of them took a conservative position when judging their abilities to perform different dimensions of DA. While there was an increase in the number of students feeling “highly” confident toward the end of the se
-mester, most students reported feeling “some
-what” confident even when asked about dimensions for which they performed well (e.g.,
Calculation) or not too well as in the case of
Drawing conclusions. An explanation for this po
-sition may be that the self- assessment survey served as a self- reflection tool for students, who rarely get questioned about their abilities to per
-form specific science skills and thus are imprecise at assessing them (Hagenbuch et al. 2009).
Furthermore, contrary to some studies, which argue that student self- assessment surveys can predict levels of academic achievement (Lent et al. 1984), we found no correlation between student gains in skills and confidence as in Bowers et al. (2005) and Beck and Blumer (2012). Thus, although self- assessment tools may provide valu
-able information at the level of student motivation or persistence to complete certain tasks, we be
-lieve that reported self- confidence levels have limitations as accurate measures of skill perfor
-mance. Therefore, we recommend caution when assessing skills with an indirect assessment tool such as a self- assessment survey.
Teaching intervention
Increasing the intensity of teaching interven
-tion did not lead to higher skill gains, and in fact, they were in some cases negatively cor
-related. While our original aim was to apply the interventions in different orders during the study, logistical constraints dictated that all courses in the final data set applied the inten
-sive teaching intervention first. Thus, the ob
-served results could be due to a higher level of experience or familiarity of the faculty with the IU in the second semester, when they ap
-plied the light teaching intervention. However, the fact that the positive effect of the light teaching intervention on skill gains did not persist when data from the ecology courses were analyzed separately suggests that the positive significant effect of the light interven
-tion is mainly driven by one Environmental Biology course. This course is offered to all levels of students—freshman to senior—and thus it is likely that both semesters were not as homogeneous in terms of student composi
-tion as the Ecology courses. This is also reflected in the lower initial student scores observed in this course in the semester that used the light teaching intervention (median = ~60%) com
-pared to the intensive (median = ~70%). Regardless, the information obtained from the Ecology courses suggests that our intensive intervention was probably not sufficient or ef
-fective so as to result in skill gains, as measured by our assessment tools. We are in the process of reviewing the teaching intervention to in
-corporate lessons learned during this first ap
emphasis on the dimensions of Data interpre-tation and Drawing conclusions in future versions. In addition, future studies where the order of the intervention is randomized would help elucidate the possible effect of faculty experience.
In conclusion, we are encouraged that it is fea
-sible to measurably improve DA skills in science undergraduate students over a single semester, with minimal course modifications. Our approach of linking rubrics to repeated classroom assign
-ments and student self- reflection can be consid
-ered a point of departure for additional instruc
-tional interventions in a diversity of disciplines. It is also a manageable strategy for individual professors to adapt their instruction toward skill development, and assess results themselves. Our study also provides important insights on the di
-mensions of DA for which this approach is likely to have an effect, and those that may require more intensive or different teaching approaches than the ones we used here. We strongly encourage professors to develop and test instructional tools targeting higher level thinking skills on a regular basis. The materials developed by our project can be readily downloaded, revised, and applied to almost any curricula in General Biology, Environ
-mental Biology, and Ecology but also to courses in Conservation Biology and Population Biology. Our methodology, however, is applicable to any science course. Integrating these tools with course content should reduce the trade- off between con
-tent and process skills, and provide insights on how to make content and skill instruction more harmonious and synergistic. Learning content and skills are both crucial in science education if we are to train competitive students capable of solving complex problems.
A
cknowledgMentsThis project would not have been possible without the data collection efforts, dedication, and contributions made by the project’s faculty participants, particularly those of the Critical Thinking and Oral Communication working groups. We also extend our gratitude to T. Theodose for collecting and contributing data, to G. Bowser, A. Gomez, S. Hoskins, K. Landrigan, D. Roon, and J. Singleton for their contributions to the initial design of the instructional materials, and to J. Gibbs for contributing the original exercises. This project is supported by the National Science Foundation CCLI/
TUES Program (DUE- 0942789). Any opinions, findings, and conclusions or recommendations expressed in this material are those of the author(s) and do not necessarily reflect NSF views.
l
IterAturec
ItedAmerican Association for the Advancement of Science – AAAS. 2011. Vision and change in undergradu -ate biology education. A call to action. American Association for the Advancement of Science, Wash -ington, DC, USA.
Anderson, W. A., et al. 2011. Changing the culture of science education at research universities. Science 331:152–153.
Bao, L., et al. 2009. Learning and scientific reasoning. Science 323:585–587.
Beatty, P. C., and G. B. Willis. 2007. Research synthesis: the practice of cognitive interviewing. Public Opin -ion Quarterly 71:287–311.
Beck, C. W., and L. S. Blumer. 2012. Inquiry- based ecology laboratory courses improve student con -fidence and scientific reasoning skills. Ecosphere 12:1–11.
Bowers, N., M. Brandon, and C. D. Hill. 2005. The use of a knowledge survey as an indicator of student learning in an introductory biology course. Cell Bi -ology Education 4:311–322.
Bowling, A.. 2009. Research methods in health. Inves -tigating health and health services. Third edition. Open University Press, Maidenhead, England. Coil, D., M. P. Wenderoth, M. Cunningham, and C.
Dirks. 2010. Teaching the process of science: facul -ty perceptions and effective methodology. CBE Life Sciences Education 9:524–535.
Colon-Berlingeri, M., and P. A. Burrowes. 2011. Teach -ing biology through statistics: application of statis -tical methods in genetics and zoology courses. CBE Life Sciences Education 10:259–267.
Cortina, J. M. 1993. What is coefficient alpha? An ex -amination of theory and applications. Journal of Applied Psychology 78:98–104.
Crawley, M.. 2007. The R book. John Wiley & Sons, Ltd., Chichester, West Sussex, UK.
D’Avanzo, C. 2003. Application of research on learn -ing to college teach-ing: ecological examples. Bio -Science 53:1121–1128.
D’Avanzo, C., C. W. Anderson, L. M. Hartley, and N. Pelaez. 2012. A faculty- development model for transforming introductory biology and ecology courses. BioScience 62:416–427.
Dirks, M., and M. Cunningham. 2006. Enhancing di -versity in science: is teaching science process skills the answer? CBE Life Sciences Education 5:218– 226.