SOCIAL SCIENCES & HUMANITIES
Journal homepage: http://www.pertanika.upm.edu.my/
ARTICLE INFO
Article history:
Received: 3 March 2014 Accepted: 20 November 2014
E-mail addresses:
ames1304@gmail.com / fazli@upm.edu.my (Mohamad Fazli Sabri), nfarhana23@gmail.com (Nurul Farhana Zakaria)
* Corresponding author
The Influence of Financial Literacy, Money Attitude, Financial
Strain and Financial Capability on Young Employees’ Financial
Well-being
Mohamad Fazli Sabri1,2* and Nurul Farhana Zakaria1
1Department of Resource Management and Consumer Studies, Faculty of Human Ecology,
Universiti Putra Malaysia, 43400 Serdang, Selangor, Malaysia
2Sustainable Consumption Research Center, Faculty of Human Ecology, Universiti Putra Malaysia,
43400 Serdang, Selangor, Malaysia
ABSTRACT
The rising cost of living and difficult economic conditions have made Malaysian individuals and households more conscious of their financial management. This study aims to (1) identify the levels of financial literacy, financial strain, financial capability and financial well-being
and the type of money attitude of young Malaysian employees; (2) explore the differences
in financial well-being based on the demographic characteristics of young employees; (3) analyse the relationships between the financial well-being of young employees and
their financial literacy, money attitude, financial strain and financial capability; and (4) identify the determinants of financial well-being among young employees. The sample
for this study consisted of 508 young employees in the public and private sectors aged 40 years and below from four urban areas in central Peninsular Malaysia, who were selected
through the multi-stage sampling technique. Data were collected through self-administered questionnaires. The findings indicate that respondents who had moderate levels of financial literacy, financial capability and financial well-being scored high in effort and retention money attitudes and had a low level of financial strain. Statistically significant differences emerged in the financial well-being of those of different marital status (married and single) and the different household income groups (lower, middle and high-income), while there were significant relationships between financial well-being and financial literacy, type of money attitude, financial strain and financial capability. Demographic characteristics
(gender and monthly household income),
financial literacy, retention-money attitude, effort-money attitude, financial strain and financial capability had significant influence
on financial well-being with financial strain being a major factor contributing to financial well-being.
Keywords: Financial literacy, money attitude,
financial strain, financial capability, financial
well-being
INTRODUCTION
The current difficult economic conditions
have made people more concerned about how they spend, save, invest and manage risks in order to protect their standard of living, especially for the long term. Financial management skills are crucial at every stage of life. However, young people face particularly challenging circumstances in making choices regarding their personal
finances. A young or prime adult is generally considered a person in the age range of 20 to 40 years. These individuals and their households have a relatively low income and few assets such as home and savings. Nevertheless, this stage of life is also a time when young adults make
decisions and significant investments for
their future, and most of these involve debt (Haveman & Wolff, 2005).
According to the Federation of Malaysian Consumers Associations (FOMCA) 2011 Report, many of those declared bankrupt due to credit card debt were under 40 years old and 72% of them had no retirement plans. In addition, the report stated that 47% of these young employees were in serious debt with monthly debt payment of 30% or more of their gross income and had, on average, savings to last only four months if they
had to stop working. These are considered
unfavourable financial management activities, especially for long-term planning. The combination of financial
problems such as high debt, low income
and low levels of financial literacy may adversely affect an individual’s financial well-being. Income uncertainty, rising
petrol prices and physical pain for instance,
have more severe effects on well-being.
Today’s young adults display
ignorance when it comes to their finances,
particularly with regard to retirement savings, smart investing, credit card use and debt (Lusardi, 2010). Young adults exhibit
a low level of financial literacy, especially when asked about interest rates, inflation and risk diversification. The results of a 2010 survey on the financial literacy of
Malaysians conducted by the Central Bank of Malaysia (Bank Negara Malaysia)
found the financial capability of Malaysian
consumers to be low. Research has shown
that when the level of financial capability
is low, there is impact on individuals, households and consumers in general, as
it leads to stress and financial exclusion
(Taylor, 2009; Lenton & Mosely, 2008).
This is seen as an obstacle to financial well-being as young adults find it difficult to manage their personal finances if they
have never learned how to budget and plan
to achieve financial security.
The increasing level of compulsive buying among young adults has contributed
to personal financial problems, personal bankruptcy filings and credit card debt
today face different financial challenges
than their parents did. They also accumulate greater debt at a younger age, largely due to high college costs. More than ever, they need to gain skills to take a more active,
responsible role in their personal finances. In addition, financial strain is an important indicator of well-being that is
strongly related to mental and physical health. Pressure to pay off debt, for instance, can increase stress and anxiety
levels (Szanton, Thorpe, & Whitfield,
2010) and affect workplace morale as
conflict between money and work can
diminish employee productivity (Garrett, 1993).
However, there has been limited
research on financial well-being in
Malaysia, particularly of young employees. Thus, this study explores the levels of
financial literacy, financial strain, financial capability and financial well-being and
type of money attitude, and explores the
relationship between the financial well-being and the financial literacy, money attitude, financial strain and financial
capability of young public and private sector employees in Peninsular Malaysia. Gaining a better understanding of the
contributors to financial well-being will, it is hoped, help young employees to acquire financial prudence and, in the long run,
decrease the number of young employees declared bankrupt. Understanding and
applying financial well-being concepts will help people to be satisfied with their financial status, improve their standard
of living, help them to be able to meet
their needs and feel safe, comfortable and
satisfied with their income. OBJECTIVES
This study was thus conducted with the
following specific objectives:
1. To identify the levels of financial literacy, financial strain, financial capability and financial well-being
and type of money attitude of young employees.
2. To explore the differences in financial well-being based on the demographic
characteristics of young employees. 3. To analyse the relationships between
the financial well-being of young employees and their financial literacy, type of money attitude, financial strain and financial capability.
4. To identify the determinants of
financial well-being among young
employees.
LITERATURE REVIEW
Financial Well-Being
“Financial well-being” can be defined as a feeling of being financially healthy, happy
and free from anxiety, and is usually based on a subjective appraisal of an individual’s
financial situation (Joo, 2008). Financial well-being is an important factor in determining one’s quality of life. Recession, for instance, has threatened financial
well-being and caused economic concerns, including concerns about health, income, debt and career development. According to Van Praag, Frijters and Carbonel (2003),
these concerns affect the psychological and physical health of employees, reduce
their confidence and productivity in the
workplace and increase absenteeism, work delays and lack of concentration in their jobs.
Determinants of Financial Well-Being
Researchers have reported that a number of variables appear to be consistently
associated with financial well-being.
Among the most common are demographic and socioeconomic characteristics such as gender, ethnicity, age, income, education and marital status (Hira & Mugenda, 1999). It has also been suggested that
while financial well-being is significantly
related to some demographic factors,
other variables such as financial literacy
(Joo & Grable, 2004; Shim et al., 2009), money attitude (Nickerson, Schwarz, &
Diener, 2007), financial strain (Drentea & Lavrakas, 2000) and financial capability
(Financial Service Authority [FSA], 2009)
can also affect financial well-being.
Financial Literacy
Financial literacy enables individuals to make informed decisions about their money and helps to minimise their chances
of being misled on financial matters (Beal & Delpachitra, 2003; Raven, 2005). Eitel and Martin (2009) explained that financial
literacy is important for the success of future generations. In the United States, for instance, young adults spend more than they earn and this has led to a negative savings rate. This situation is very serious
and needs to be addressed to ensure the
financial well-being of future generations
(Nellen & McWilliams, 2008). In fact, Hayslip, Bezerlein and Nichols (1997) have found that young adults tend to show high levels of retirement anxiety because of lack of information about retirement.
Consistent with that finding, Mitchell and
Moore (1998) reported that one reason individuals fail to plan for retirement is
because of insufficient knowledge.
Money Attitude
In today’s materialistic environment, money is not limited to being a medium of exchange but has also become a means
to achieving happiness and well-being. According to Diener and Seligman (2004),
money has four symbolic values, which are
status, respect, freedom and luxury.
Cross-sectional studies have found that there is a positive relationship between these values
and subjective well-being. Nickerson, Schwarz and Diener (2007) attempted to
relate the link between orientation toward money and life satisfaction. Their study showed that people with high materialism or who were obsessed with money tended to
be more satisfied with their finances due to
their ability to afford their material desires. The results indicate that the perception
that individuals have of their well-being is
determined by their life aspirations.
Financial Strain
A number of studies done by Delafrooz,
Paim, Sabri and Masud (2010), Bailey, Woodiel, Turner, and Young (1998) and
Falahati, Sabri, and Paim (2012) have examined the factors contributing to
financial well-being. Taylor (2009) found financial strain to be a good predictor of financial well-being. Worried about
being unable to pay medical bills and being depressed due to having little or no
savings were among the financial strain
that were highlighted in Taylor’s study. Financial strain is not only associated with
individuals’ financial well-being; it also
affects the productivity of individuals.
Financial Capability
A study on financial capability and
well-being was conducted in 2009 using data from the British Household Panel Survey
(BHPS). It was found that financially
capable individuals are able to learn how
to manage money and personal finances,
become critical consumers when purchasing goods and services and understand the risk in both positive and negative terms. It can
be demonstrated that increasing financial
capability can have an implication on the
wealth of individuals and families, financial security and financial well-being. A greater
participation in asset building can lead to
greater stability, thus enhancing financial well-being.
METHODOLOGY
Sample
The sample comprised 508 young employees working in public and private agencies in four urban areas in central Peninsular Malaysia i.e. in the states of
Perak and Selangor, the Federal Territory of Kuala Lumpur and the Federal Territory
of Putrajaya. This study used a multi-stage sampling technique in selecting the
sample study. The target was to obtain 300 respondents working in the public sector in Perak and the Federal Territory of Putrajaya and 300 respondents working in the private sector in the Federal Territory of Kuala Lumpur and the state of Selangor. Public sector agencies were selected from government websites and private sector agencies located in the Federal Territory of Kuala Lumpur and Selangor were selected from a list obtained from the Malaysian Employers Federation (MEF). Four stages were involved prior to administration and
collection of data. First, officers from the
human resource departments of the selected agencies were contacted through telephone
to explain the intention of the study.
Pre-approach letters were then sent to explain about the study and to get approval. Once approval had been given, the agencies each provided the name, personal contact
number, postal and e-mail address of the
person assigned to assist in the survey. After this, personal visits were made to the agencies to meet the person in charge and they were given a more detailed explanation of the study in terms of objectives of the study, the expected outcome from the study and the target group of respondents. In the
final stage, the person in charge provided a list of participants who met the requirement of being aged from 20 to 40 years. Self-administered questionnaires were provided
to the participants, whose consent had
first been obtained. The person in charge
then set the date for the collection of the
completed questionnaires.
Each state was equally distributed with 150 sets of questionnaires. Among the 600 questionnaires, 92 were returned
as undeliverable due to some departments
having distributed the questionnaires to
the individual respondents, resulting in the misplacement of the forms and some of the respondents withdrawing from participation in the survey. Therefore, the total sample size was reduced to 508. This number represents a total return rate of 84.7%.
The data obtained were coded and analysed using SPSS to identify the
determinants of financial well-being among
young Malaysian employees.
Variables Measurement
Financial Well-Being: To measure
financial well-being, this study used the Malaysian Financial Personal Well-Being
Scale (MPFWBS) developed by Garman and Jariah (2006). This scale comprises
12 statements with a 10-point scale,
with 1 as the lowest score and 10 as the highest score. Respondents were asked to respond to statements that best described
their financial situation. Cronbach’s alpha
reported in this study was 0.935.
Financial Literacy: Financial literacy was measured using an instrument developed
by Sabri, MacDonald, Hira and Masud
(2010) based on the Malaysian context.
Thirty-four statements were designed to measure the respondents’ level of financial
literacy. Respondents were asked to indicate whether the statements given were true or false. One point was given for a
“true” response while a “false” response
was given zero points. Higher percentage
scores indicated a higher level of financial literacy. In this section, financial literacy
was divided into three categories, namely,
low mean score (0-10), medium mean score (11-21) and high mean score (22-34). The
average score was 17.81, with a standard deviation of 5.53.
Money Attitude
Money attitude in this study was measured by adopting six dimensions from the Furnham’s Money Beliefs and Behaviours Scale (MBBS), which were obsession,
retention, inadequacy, effort, power and
security. Money attitude was measured using 24 items that described the feelings and experiences of the respondents with
a 5-point Likert scale ranging from
strongly disagree (1) to strongly agree (5). Cronbach’s alpha was used to test the reliability of each factor. It was determined that all factors except power and security had acceptable values of 0.6 to 0.7, while the power and the security factors had reliability values of 0.37 and 0.36, respectively. In view of this, the power and the security factors were dropped from further analysis.
Financial Strain
Financial strain was measured using an instrument involving seven items developed
by Aldana and Liljenquist (1998). Respondents were asked about financial strain in these questions: “I am unable to
sleep well due to inability to get bills paid
on time”, “I’ve been depressed due to lack of money” and “My current financial situation makes me anxious”. Respondents were required to rate the situation
experienced by them in the previous six
months on a 3-point Likert scale ranging
from never (1), sometimes (2) and always
(3). This subjective appraisal of financial
situation was coded 1 to 3 so that the higher
scores referred to higher levels of financial
strain. Cronbach’s alpha reported for this study was 0.838.
Financial Capability
To measure financial capability, 20
statements encompassing four different domains (managing money, staying informed, choosing products and planning ahead) used in the following studies on
financial capability were used: Financial
Capability Survey (2004), Scottish
Household Survey (2005-2009), British
Household Panel Survey (2006) and Central Bank of Malaysia Survey on Financial Literacy of Malaysian Adults (2010).
Each domain comprised five questions
and the respondents were asked to rate their responses from strongly disagree (1) to strongly agree (5). Cronbach’s alpha reported was 0.896.
RESULTS AND DISCUSSION
Demographic Details of the Respondents
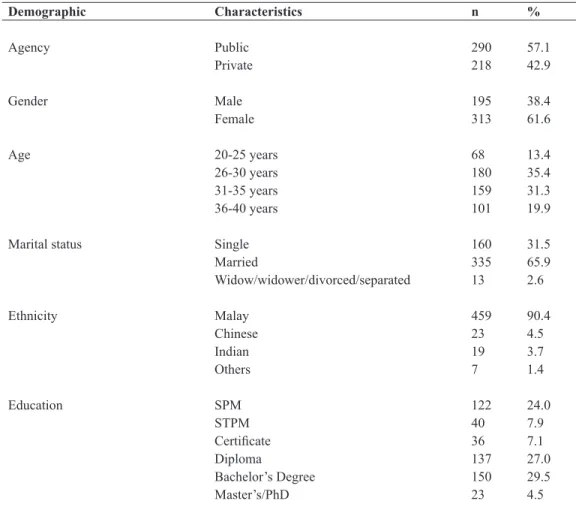
Table 1 provides details of the respondents’
profiles. The respondents consisted of 290
employees from the public sector and 218 from the private sector. The majority of the respondents were female (61.6%), while males constituted 38.4%. The majority of the respondents were between the ages of 26 and 30 years. A total of 90.4% (459) were of Malay ethnicity, 4.5% (23) were Chinese, 3.7% (19) were Indians and 1.4% (7) were of other ethnic backgrounds. More than half of the respondents were married (65.9%). Most of the respondents were bachelor’s degree holders (29.4%).
More than half of the respondents had a monthly household income of above RM3,500 (51.1%) and 11.8% of them were reported to earn less than RM1,500 per month. The mean monthly household income of the respondents was RM4,937.66, which is slightly lower than the mean monthly urban household income of RM5,742 as stated by the Economic Planning Unit of The Prime
Minister’s Department, Malaysia in 2012. Even though the high-income level as
categorised in the Tenth Malaysia Plan is RM3,500 and above, this level seems too low for urban areas, especially Kuala Lumpur and Selangor, given the high cost of living in these areas.
Respondents were asked about the percentage of their income they saved each month. The results showed that slightly more than half (53.1%) of the respondents saved at least 1 to 10% of their income.
Almost a third (32.2%) of the respondents saved about 10 to 20% and 7.9% of the respondents were able to save more than 20% of their income. However, it was found that 6.7% of the respondents never put their income aside as savings.
The respondents were also asked about
their current income adequacy. Half of the
respondents (52.8%) felt that their current income was good enough to meet only their basic needs while 26.2% of the respondents reported that their current income was enough for most things and 12.4% of the respondents were able to buy anything that
they wished and could also save money from their income. Only one tenth (8.7%) of the respondents stated they felt that their current income was not enough even to meet their basic necessities.
In terms of financial status, the results showed an almost equal percentage
of responses. One third (35%) of the respondents had asset values more than their outstanding debt values, followed by
32.7% who had equal values of asset and
outstanding debt, while 32.3% of them felt their asset values were less than their outstanding debt values.
TABLE 1 Profile of Respondents Demographic Characteristics n % Agency Public 290 57.1 Private 218 42.9 Gender Male 195 38.4 Female 313 61.6 Age 20-25 years 68 13.4 26-30 years 180 35.4 31-35 years 159 31.3 36-40 years 101 19.9
Marital status Single 160 31.5
Married 335 65.9 Widow/widower/divorced/separated 13 2.6 Ethnicity Malay 459 90.4 Chinese 23 4.5 Indian 19 3.7 Others 7 1.4 Education SPM 122 24.0 STPM 40 7.9 Certificate 36 7.1 Diploma 137 27.0 Bachelor’s Degree 150 29.5 Master’s/PhD 23 4.5
Financial Literacy levels
In order to identify the levels of financial
literacy, the respondents were asked
thirty-four questions concerning general
knowledge, credit card, debt and loan, savings and investment, and Islamic banking and products. In general, most of the respondents understood the concept
of credit as three quarters (78.3%) of the respondents knew that credit-card holders
cannot spend without limit. More than half (64.2%) of the respondents gave the correct answer that making cash
withdrawals using credit cards is not a low-cost financial source. Meanwhile, 69.3%
of the respondents answered correctly
that credit-card holders will be charged
for making cash withdrawals using credit cards.
The results also indicate that a large number of respondents (72.0%) gave the right answer when asked about loan repayment. However, 33.3% of the respondents did not know that they could not spend more than 40% of their monthly income to pay instalments while 39.8% of them gave the wrong answer to this statement. Only the remaining 27.0% of the respondents provided the correct answer. According to Garman and Forgue (2004), savings should be included in spending plans (budgeting). However, most of the respondents had the wrong interpretation
Number of financial dependents 1 217 42.7
2 112 22.0
3 74 14.6
4 35 6.9
5 28 5.5
More than 5 11 2.2
Monthly household income < RM1, 500 57 11.8
RM1, 500- RM3, 500 179 37.1 Above RM3,500 247 51.1 Monthly savings 0% 34 6.7 1%-< 10% 270 53.1 10%-< 20% 164 32.3 ≥ 20% 40 7.9
Financial status Asset values less than outstanding debt 164 32.3
Asset values equal to outstanding debt 166 32.7
Asset values more than outstanding debt 178 35.0
Current income adequacy Not enough 44 8.7
Enough for basic needs 268 52.8
Enough for most things 133 26.2
Enough to buy all the things wished for 63 12.4 and could save money
of savings. The results showed that 74.8% of the respondents agreed that savings were extra income after deducted expenses. The answer given was wrong and contrary to the
recommendations of experts in the field of finance, who state that savings are actually
the portion of income not spent on current expenditure. Individuals should understand the various concepts involved in savings, including reasons for saving, the importance of saving, setting saving targets, the saving process, places to save, available types of savings instrument, advice for becoming a disciplined saver, special purpose accounts, comparison of savings accounts and savings plans. A saving mindset must be cultivated, and individuals must understand such matters as why spending less should be easier than saving more and how to apply savings strategies for purchasing large appliances (Tohey & Tohey, 2000).
In addition, respondents were also asked
on their knowledge of Islamic financial
products. The tremendous growth in Islamic banking has encouraged global movement of banks into this area that has become increasingly popular with consumers. However, the results revealed that the respondents were less knowledgeable about
Islamic banking and finance products. Malaysia’s Islamic finance industry has been
in existence for over 30 years and Malaysia’s
Islamic banking assets have reached USD750
billion with an average growth rate of 15 to 20% annually (Islamic Financial Industry Stability Report, 2013). Islamic banking and
finance is not only expanding in nations with
majority Muslim populations, but also in the countries with Muslim minorities such as the United Kingdom and Japan (International Monetary Fund Survey, 2007). Increased efforts by conventional banks to offer Islamic banking products to a larger segment of consumers may help to diversify the choices available to them.
Less than one third (19.5%) of the respondents gave the right answer to the
question on borrowings in Islamic banking
and only 23.0% of the respondents gave the
correct response to the question on interest
rates and returns when making investment in Islamic banking.
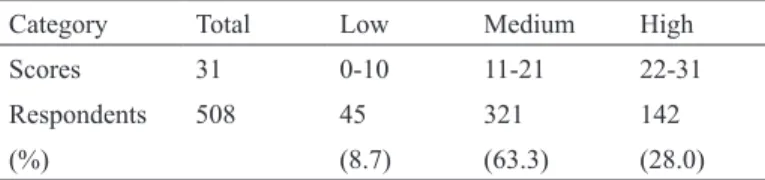
Table 2 shows the financial literacy
scores by categories. The results indicate that 321 (63.3%) of the respondents had
medium levels of financial literacy. This
finding is consistent with that of the pilot survey conducted by OECD in 2012, which
made an assessment of the national level of
financial literacy in several countries such
as Germany, Peru, Norway and Malaysia. Based on the pilot survey, Malaysia
reported a moderate level of financial
literacy with a knowledge score of 51%. TABLE 2
Financial Literacy Score Levels
Category Total Low Medium High
Scores 31 0-10 11-21 22-31
Respondents 508 45 321 142
Money Attitude Levels
The respondents were asked to describe their experience and feelings regarding money based on four dimensions of money
attitude. The first dimension of money
attitude was obsession. The results show that most of the respondents were not obsessed about money. By combining categories, only 32.1% of the respondents agreed that money could solve their problems. Meanwhile only 16.8% of the respondents believed that money is the only thing that they could depend on in their lives. The majority (84.0%) of the respondents were not interested to show
off their financial success to their friends.
This indicates that most of the respondents did not consider money as the main means to solve the problems they encountered
in their daily lives. However, the findings
of this study are found to be in contrast with a study of young Chinese consumers
conducted by Durvasula and Lysonski
(2010), which indicates that young Chinese consumers are fascinated with money and consider money as an important means to solve problems in their daily lives. Money is seen as a symbol of wealth and is likely to be associated with one’s level
of materialism. This finding contradicts the findings on the money attitude of Malaysian
individuals, which may be different due to personal traits or demographic factors such as family life cycle (Tang, 1993). Apart from that, it can be assumed that the Malaysian culture makes people rely on religion, family, career satisfaction, health and friends instead of on money. In other
words, without these elements, their lives would not have any meaning even if they had a lot of money.
The second dimension was retention of money, which illustrates the attitude of people who keep track of their money through budgeting and planning, and
prepare for their future financial needs.
The results showed that 41.9% of the respondents had mixed feelings as to whether they felt guilty spending their money on necessities even though they had enough money at the time. More than one third (45.7%) of the respondents had
difficulty making decisions regarding
spending their money, regardless of the amount involved and their actual ability to afford it. It can be concluded that most of the respondents had high retention of money attitude.
The third dimension was inadequacy of money. People who are financially inadequate are those who worry about their financial situation most of the time, feel
that most of their friends have more money
than they do and believe other people over-estimate their actual financial resources
(Furnham & Argyle, 1998). By combining categories, the results showed that 53.4% of the respondents did not spend their money on leisure or pleasurable activities. Nearly half (42.9%) of the respondents did not agree that their friends had more money than they did while only 18.7% of the respondents felt anxious about their
personal finances. It can be concluded that
the respondents had a good degree of the perception of having enough money. This
may have been because the respondents were still at a young age and had few
financial dependents.
The final dimension was effort of
money. One third (30.3%) of the respondents did not agree they were thrifty while 30.1% of them agreed with that statement. Less than half (45.9%) of the respondents
were satisfied with their present income as
being what they deserved based on their jobs. A high percentage of the respondents (73.0%) believed that the amount of money that a person earns is closely related to their ability and effort. More than two thirds (66.8%) of the respondents kept track of their money and knew how much they had in their bank or savings account, including the credit or loan incurred. It can be concluded that most of the respondents felt that their achievement or ability was
reflected in the amount of money they
earned.
Scores for each of the four dimensions were computed by summing the mean
score for all of the items. Dimensions with
a high score represented a high level of the attitude. Fig.1 shows that the respondents scored high for effort of money attitude (mean=16.9). The other scores were retention of money (mean=10.7), obsession
with money (mean=9.3), and inadequacy
of money (mean=7.9).
Financial Strain Levels
Respondents were asked to answer if they had experienced seven situations
that indicated their financial strain in
the last six months. The results showed
that the statement “Delay in paying bills makes me worried” yielded the highest
percentage (35.03%) among the young
employees, followed by “Current financial situation makes me anxious” (17.13%) and “Worried about medical costs” (15.75%).
Meanwhile, the four lowest scores were for “Unable to sleep well due to inability
to pay bills on time” (14.96%); “Worried about being unable to get a balanced diet”
(10.63%); “Have fallen sick due to worry
about self or family spending” (6.9%); and “Depressed due to lack of money” (6.3%).
Financial strain levels were divided into three, which were low, moderate and high. Fig.2 shows that a high percentage of the respondents (46.2%) had a low level of
financial strain. However, there was a subtle
difference between those respondents
reporting a low level of financial strain and those reporting a moderate level of financial strain (44.6%). However, this finding was
found to be different from that in a study conducted by Alley and Kahn (2012), which involved 6,287 respondents. Using the Health and Retirement Survey, they demonstrated that economic resources, psychological resources and health explain
financial strain across the demographic
subgroups. They found that people who
experienced high levels of financial strain were young adults who had few financial
resources in terms of income.
Financial Capability Levels
The respondents’ financial capability was
measured by twenty statements comprising four domains, which were managing
Fig.1: Type of money attitude score.
Fig.2: Financial strain levels. money, staying informed, choosing
products and planning ahead. In terms of managing money, most of the respondents agreed that they managed their money properly as 64.1% of them made plans for their expenses and paid their bills on time and 60.5% of the respondents regularly set money aside for possible unexpected
expenses. With regard to planning ahead, less than half of the respondents planned ahead, especially for their retirement life. The results indicated that only 48.7% of the
respondents made financial provision for
retirement. In terms of staying informed, 30% of the respondents were interested in keeping up to date with information
on financial management. Only 22.4% of them willingly obtained advice from the professionals. In terms of choosing products, most of the respondents considered several policies or loans from different companies before making decisions, read the terms and conditions in detail before agreeing or signing and
made personal considerations rather than believing and accepting what had been
recommended by financial advisers. Fig.3 shows the financial capability scores by
categories. The results indicate that 73.6% of the respondents had a moderate level of
financial capability.
Fig.3: Financial capability levels.
Financial Well-Being Levels
The respondents’ financial well-being was
measured using 12 statements indicating
their financial status. The respondents were
asked about their satisfaction with their
current financial situation, current financial adequacy and how confident they were of
having enough money to cover their life after retirement. In general, the highest
mean score for financial well-being was
reported for the statement regarding the
frequency of having trouble paying bills.
The mean score of 7.32 indicates that most
of the respondents did not frequently face
a problem in paying their bills. In addition,
the respondents were confident that they could control their finances (mean=6.57) and they were confident that they had the power to control their personal finances
(mean=6.36). Even though most of the respondents believed they were in good
financial condition, they were still worried about their current financial situation as
the statement “Worry about your current
financial situation” reported the lowest
mean score of 4.93. The results illustrated in Fig.4 show that the majority of the respondents (78.5) had a moderate level of
financial well-being.
An independent sample t-test was conducted to compare the financial
well-being scores for married and single young employees. Table 3 shows that there was
a significant difference in the scores for married respondents (M=73.00, SD=14.11)
and for single respondents (M=70.14,
SD=16.12; t (508)=1.97, p=0.04). The results thus revealed that there was a
significant difference between married and
single young employees. Married couples
tended to be financially better off compared
to single young employees. According to Sweeny (2002), entering into marriage is
related to an increase in economic
well-being. Married couples typically manage their resources jointly, thus allowing them to adjust better to economic circumstances compared to singles (Brines & Joyner, 1999).
A one-way between-groups analysis
of variance was conducted to explore
financial well-being among the income
groups. Income groups were divided into three based on monthly household income
classification used in Malaysia in the 10th
Malaysia Plan, which is low, middle and high (Group 1: less than RM1,500; Group 2: RM1,500 to RM3,500; Group 3: Above RM3,500). Table 4.4 reveals that there was
a statistically significant difference at the p<0.05 level in financial well-being for the
three income groups [F(2,480)=12.810, TABLE 3
Marital Status Comparison for Financial Well-Being
Marital status n Mean SD t Sig.
Married 335 73.003 14.11 1.974 0.04
Single 173 70.145 16.12
TABLE 4
Income Group Comparison for Financial Well-being
Income group n Mean SD F P
Low 57 65.92 19.764 12.810 0.000
Middle 179 69.52 13.633
High 247 75.05 13.999
*Significant p<0.05 TABLE 5
Pearson’s Correlation Coefficients Results
Variables Pearson Correlation (r) p
1. Financial literacy 0.205** 0.000
2. Type of money attitude
a) Obsession -0.072 0.107 b) Retention 0.151** 0.001 c) Inadequacy 0.001 0.989 d) Effort 0.330** 0.000 3. Financial strain -0.409** 0.000 4. Financial capability 0.358** 0.000 Significant: **p<0.01 TABLE 6
Multiple Regression Results of Determinants of Financial Well-Being
Variable b Beta t Sig.
Constant 20.308 3.107 0.002
Gender (Male) -3.363 -0.109 -3.059 0.002**
Marital status (Married) 1.33 0.042 1.187 0.236
Household income 2.662 0.122 3.249 0.001**
Money attitude (Retention) 0.789 0.097 2.721 0.007**
Money attitude (Effort) 1.123 0.218 5.866 0.000**
Financial literacy 0.26 0.095 2.508 0.012**
Financial capability 0.47 0.301 8.136 0.000**
Financial strain -1.697 -0.379 -10.512 0.000**
R=.647; R2 =.418; Adjusted R2=.408; F=42.199; Sig. F=.000
p=0.001). Post-hoc comparisons using the Tukey HSD test indicated that the mean score for Group 3 (M=75.05, SD=13.99) was significantly different from Group 1 (M=65.92, SD=19.76) and Group 2 (M=69.52, SD=13.63). Meanwhile, Group 1 (M=65.92, SD=19.76) did not differ significantly from Group 2 (M=69.52, SD=13.63). This shows that the respondents in the high-income group were more financially well off compared
to the other groups. Incomes help people to meet their needs. People with greater incomes are more likely to be able to meet their needs such as healthy food, safety, health and comfortable housing, leading to
subjective financial well-being compared
to those with lower incomes.
The relationship between financial well-being and financial literacy, type of money attitude, financial strain and financial capability was investigated using Pearson’s correlation coefficient. The
results revealed a positive relationship
between financial well-being and financial
literacy [r=0.205, p<0.01], retention money attitude [r=0.151, p<0.01], effort money attitude [r=0.330, p<0.01] and financial
capability [r=0.358, p<0.01]. However, there was a negative relationship between
financial strain and financial well-being [r=-0565, p<0.01].
Based on the multiple regression results in Table 6, eight variables explained 40.8%
of the variance of financial well-being. This
also suggests the potential of other factors
explaining the financial well-being of the
respondents. The Beta value in the Table
of Coefficient shows which variable makes the strongest unique contribution to explain the dependent variable while the significant
value explains whether the variable
makes a significant unique contribution
to the prediction of dependent variable. From three demographic characteristics, two demographic characteristics were
significant at the 0.01 level: gender and
household income. However, marital status did not contribute to the variance.
By comparing the beta coefficients among the two significant variables, household income had slightly higher influence on the financial well-being of young
employees compared to gender with beta values of 0.122 and 0.109, respectively.
From the results obtained, the total of five
independent variables were also shown
to be significant: financial literacy, effort-money attitude, retention-effort-money attitude, financial capability and financial strain. Overall, financial strain was the greatest predictor of financial well-being among young employees (Beta=-0.379).
The results indicated that the male
respondents showed more financial
well-being compared to the female respondents. This is supported by Gottschalck (2008) who reported that women held lower levels
of wealth and had significantly lower
earnings compared to men. Furthermore,
women may spend as many as five more
years than men in retirement due to a longer life expectancy. Marital status did
not make a unique contribution to financial well-being. It can be assumed that positive
the concept of self-esteem and different
perceptions of the individuals, regardless of whether they are married or single. It is proposed that overall life satisfaction comes from each individual’s personal values,
which are unique and different. Apart
from that, household income also made
a unique contribution to financial
well-being. The positive correlation between
income and financial well-being indicated
that higher income could allow people to more comfortably meet their basic needs as well as to confer status advantages.
The results also indicated that financial
literacy, retention and effort money
attitude and financial capability positively predicted financial well-being. The results
further indicated that those with a higher
level of financial literacy, positive money attitude and a higher level of financial capability had greater financial well-being.
Individuals who had knowledge of the
various aspects of finance, particularly in relation to their financial needs, were more
likely to make the right decisions and be capable of using the skills to manage
their personal finances. In addition, a
positive attitude towards money such as retention and effort money attitude can
help individuals to manage their finances
through budgeting and intensifying their efforts to generate income and protect
their future financial needs. Conversely, financial strain was found to be negatively related to financial well-being. Those who
experienced problems related to lack of money for essential expenses reported
lower levels of financial well-being.
CONCLUSION AND IMPLICATIONS
This study explored the determinants of
perceived financial well-being among
young employees. Multiple regression analysis was used to explore the factors
contributing to financial well-being.
The results of this study suggest several important conclusions. First, being
financially capable is an indicator of financial well-being as financial capability
will help young employees to keep track of their money so that they can make ends meet and be helped in making sound choices in the event of any circumstances or unexpected situations. Second, a positive attitude towards money helps individuals to be careful in spending their money through budgeting and planning for their
future financial needs. Third, it is apparent
that positive early consumer experiences
improve young employees’ financial literacy, which in turn has a significant effect on their financial management and
in turn, increases their perceived level
of financial well-being. Providing basic knowledge of personal finance to this
group of young employees would seem to be an effective approach to educate them to become responsible and prudent consumers. The results also indicate that rising household income is associated with
increasing financial well-being. A large
number of studies have been conducted to see the relationship between subjective
well-being and income (Rogers & DeBoer,
2001; Hamermesh, 2004). Access to greater economic resources infers higher living
higher incomes are more able to meet their material aspirations and will feel better off (Easterlin, 2001). Most importantly,
the negative effect of financial strain on financial well-being needs more attention. Financial difficulties can make people
blame each other for their situation.
The findings of this study can serve as a
guide to the government, in particular to the Economic Planning Unit (EPU), in setting
economic policy. The findings indicate that
the mean household monthly income of the respondents was RM4,937.66, much lower than the RM5,742 indicated by
EPU in 2012. The findings also reveal that
11.8% of the respondents earned less than RM1,500 per month and almost half of the respondents said that their current income
adequacy was enough to meet only their basic needs. Due to those circumstances,
6.7% of the respondents were unable to save money at all, as the income earned was only enough to meet their expenses for that particular month. The increasing cost of living in urban areas may further complicate matters for this group to
survive, and this would affect their financial well-being in the long run, especially in life
after retirement. Although more than half
of the respondents were in the high-income
group and earned more than RM3,500 a month, this value is seen as too low to be
categorised as high-income as the cost of
living is high, especially in Kuala Lumpur and Selangor. There are still a number of people who need more attention due to low income and circumstances not being in their favour. Therefore, the development of
an inclusive approach that will expand the ability of Malaysians to participate in and
benefit from economic activity is needed. It is important to promote financial
education to young employees, as this initiative will provide the necessary knowledge, skills and tools for them to
make informed decisions with confidence.
Apart from that, this initiative may
highlight the importance of financial
literacy as living skills for young employees to educate them on how to develop and
maintain healthy financial behaviour and habits for financial well-being. FOMCA, for instance, is one of the national
non-governmental organisations (NGO) that
can help to deliver financial education
to young employees. Efforts to provide
quality financial literacy to Malaysians can
help to improve consumers’ understanding
of their financial well-being so that they can establish and achieve personal financial goals and build financial security.
Young employees who are in a
moderate level of financial strain may
have the tendency to fall into low or high
level of financial strain if they do not
overcome the problems that they face. These problems will not only affect their
personal finances but may also affect their
job productivity, as they will not be able to
focus on their work. Due to this, employers
may take the initiative to introduce
financial counselling and education in the workplace. In fact, financial counselling
and education for employees makes good
financial sense for employers as well. This is because employees’ financial
problems affect their job productivity and employers have to bear the cost of reduced productivity, absenteeism, rising health care costs or tardiness. As such,
employer-sponsored workplace financial
counselling and education can become a strong investment for the future. Good
financial wellness programmes such as group seminars on appropriate financial topics or in-person programmes between employees and financial counsellors may help employees. Reduced financial strain
may help employees to be more focussed at
the workplace, thus benefiting employers.
REFERENCES
Aldana, S. G., & Liljenquist, W. (1998). Validity and reliability of a financial strain survey. Financial Counseling and Planning, 9(2), 11–18.
Bailey, W., Woodiel, D., Turner, M., & Young, J. (1998). The relationship of financial stress
to overall stress and satisfaction. Personal Finances and Worker Productivity, (2)2, 198– 207. Retrieved February 14, 2004.
Bank Negara Malaysia (2010). Annual Report.
Retrieved from http://www.bnm.gov.my/files/
publication/ar/en/2010/ar2010_book.
Bank Negara Malaysia (2010). Appointment of
research company to conduct survey on financial
literacy. Bank Negara Malaysia: Kuala Lumpur. Retrieved from http://www.bnm.gov.my/
documents/tender/2010/briefing_oecd_survey.
doc
Beal, D. J., & Delpachitra, S. B. (2003). Financial
literacy among Australian University students. Economic Papers: A journal of applied economics and policy, 22(1), 65–78.
Brines, J., & Joyner, K. (1999). The ties that bind: Principles of cohesion in cohabitation and marriage. American Sociological Review, 333– 355.
Delafrooz, N., Hj Paim, L., Saberi, M. F., & Masud, J. (2010). Effects of financial wellness on the relationship between financial problem
and workplace productivity. World Appl. Sci. J, 10(8), 871–878.
Diener, E., & Oishi, S. (2004). Money and happiness: Income and subjective well-being across nations.
InE. Diener, & E. M. Suh (Eds.), Culture and subjective well-being (pp. 185-218). MIT Press,
Cambridge.
Drentea, P., & Lavrakas, P. J. (2000). Over the
limit: The association among health, race and debt. Social Science & Medicine, 50(4), 517– 529.
Easterlin, R. A. (2001). Income and happiness:
Towards a unified theory. Economic Journal, 111, 465–484.
Eitel, S. J., & Martin, J. (2009). First-generation female college students’ financial literacy: Real
and perceived barriers to degree completion.
College Student Journal, 43(2), 616-630.
Falahati, L., Sabri, M. F., & Paim, L. H. (2012).
Assessment a model of financial satisfaction
predictors: Examining the mediate effect of
financial behaviour and financial strain. World Applied Sciences Journal, 20(2), 190–197. Federation of Malaysian Consumers Associations
(2011). Retrieved from http://www.fomca.org. my/kewangan/images/stories/pub/FLM2011 (ENG)
Garrett, J. T., & Garrett, M. W. (1993). The path of good medicine: Understanding and counseling Native American Indians. Journal of Multicultural Counseling and development, 22(3), 134–144.
Gottschalk, P. (2008). Categories of financial
crime. Journal of Financial Crime, 17(4), 441– 458.
Hamermesh, D. S. (2004). Subjective outcomes in
economics. Southern Economic Journal, 71, 2–11.
Haveman, R., & Wolff, E. N. (2005). Who are the asset poor? Levels, trends, and composition,
1983-1998. Inclusion in the American dream: Assets, poverty, and public policy, 61–86. Hayslip Jr, B., Beyerlein, M., & Nichols, J. A.
(1997). Assessing anxiety about retirement: The case of academicians. International Journal of Aging and Human Development, 44, 15–36. Hira, T. K., & Mugenda, O. (1999b). The
relationships between self-worth and financial
beliefs, behavior, and satisfaction. Journal of Family and Consumer Sciences, 91(4), 76. Islamic Financial Services Board, Survey Report.
(2013). Revised guidance on key elements in the supervisory review process of institutions
offering Islamic financial services. Islamic Financial Services Board.
Joo, S. (2008). Personal financial wellness. In J.
J. Xiao (Ed.). Handbook of consumer finance
research (pp. 21–33). New York: Springer. Joo, S., & Grable, J. E. (2000). Improving employee
productivity: The role of financial counseling and
education. Journal of Employment Counseling, 37(1), 2-15.
Joo, S., & Grable, J. E. (2004). An exploratory
framework of the determinants of financial
satisfaction. Journal of Family and Economic Issues, 25(1), 162–171.
Lenton, P., & Mosley, P. (2008). Incentivising trust. Journal of Economic Psychology, 32(5), 890–897.
Lusardi, A., Mitchell, O. S., & Curto, V. (2010). Financial literacy among the young. The Journal of Consumer Affairs, 44(2), 358–380.
Masud, J. (2007). Testing of Malaysia’s financial
well-being scale. Paper presented in the Seventh Biennial Conference 2007 ACFEA, Purajaya,
Malaysia, July 4-7.
Mitchell, O. S., & Moore, J. F. (1998). Can Americans afford to retire? New evidence on
retirement saving adequacy. Journal of Risk and Insurance, 371–400.
Nellen, A., & McWilliams, J. (2008). Financial
literacy: University-focused activities. Tax Advisor, May, 314–316.
Rogers, S. J., & DeBoer, D. D. (2001).Changes in wives’ income: Effects on marital happiness,
psychological well-being, and the risk of
divorce. Journal of Marriage and Family, 63, 458–472.
Roberts, J. A., & Jones, E. (2001). Money attitudes, credit card use, and compulsive buying among American college students. Journal of Consumer Affairs, 35(2), 213–240.
Sabri, M. F., MacDonald, M., Hira, T. K., & Masud,
J. (2010). Childhood consumer experience
and the financial literacy of college students
in Malaysia. Family and Consumer Sciences Research Journal, 38(4), 455–467.
Shim, S., Xiao, J. J., Barber, B. L., & Lyons, A. (2009). Pathways to life success: A conceptual
model of financial well-being for young adults.
Journal of Applied Developmental Psychology, 30(6), 708–723.
Sweeney, M. M. (2002). Two decades of family change: The shifting economic foundations of marriage. American Sociological Review, 67, 132–147.
Szanton, S. L., Thorpe, R. J., & Whitfield, K. (2010). Life-course financial strain and health in African-Americans. Social Science and Medicine, 71, 259–265.
Taylor, J. B. (2009). The financial crisis and the
policy responses: An empirical analysis of what went wrong (No. w14631). National Bureau of Economic Research.
Toohey, B., & Toohey, M. (2000) The average
family’s guide to financial freedom. John Wiley & Sons.
Van Praag, B. M. S., Frijters, P., & Ferrer-i-Carbonel, A. (2003). The anatomy of subjective
well-being. Journal of Economic Behavior and Organisation, 51, 29–49.