CHAPTER 3
REAL TIME SCHEDULER SIMULATOR
3.1 INTRODUCTION
The main objective of this research work is to develop a model for the simulation of real-time tasks. The proposed model can be used for preprogrammed scheduling policies. This model provides user friendly Graphical User Interface (GUI). Task ID, deadline, priority, period, computation time and phase are the input task attributes to the scheduler simulator and chronograph imitating the real-time execution of the input task set and computational statistics of the schedule are the output. The proposed framework for the scheduler simulator can be used as a teaching tool. Evaluation of the performance of real-time schedulers can be done as well. Evaluation criteria are based on the mean response time, number of deadline misses, processor utilization, number of preemptions and context switches. The Task Scheduler Co-Processor is intended to be a task controller and perform the controlling function in accordance with a specified scheduling policy. Within the co-processor, a number of scheduling policies may be made available.
The study of existing frameworks clearly reveals that each tool is better in its own way. The appreciable combination of values of each of the tools is chosen and an earnest attempt has been made to make the proposed framework to be more flexible for the future users for trying different other combinations of evaluation criteria that may be of interest for different
real-time resource capacities. The experimentation results obtained from the analyzed simulators were compared to form the reference data for functional verification of the tool under development.
3.2 EXISTING SIMULATORS Vs PROPOSED SIMULATOR
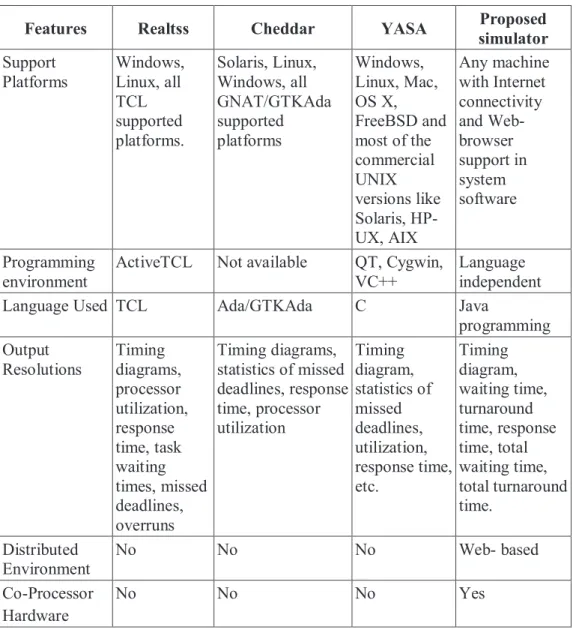
Table 3.1 shows the differenes between the existing and proposed simulators.
Table 3.1 Existing Simulators Vs Proposed Simulator
Features Realtss Cheddar YASA Proposed
simulator Support Platforms Windows, Linux, all TCL supported platforms. Solaris, Linux, Windows, all GNAT/GTKAda supported platforms Windows, Linux, Mac, OS X, FreeBSD and most of the commercial UNIX versions like Solaris, HP-UX, AIX Any machine with Internet connectivity and Web-browser support in system software Programming environment
ActiveTCL Not available QT, Cygwin, VC++
Language independent
Language Used TCL Ada/GTKAda C Java
programming Output Resolutions Timing diagrams, processor utilization, response time, task waiting times, missed deadlines, overruns Timing diagrams, statistics of missed deadlines, response time, processor utilization Timing diagram, statistics of missed deadlines, utilization, response time, etc. Timing diagram, waiting time, turnaround time, response time, total waiting time, total turnaround time. Distributed Environment No No No Web- based Co-Processor Hardware No No No Yes
3.3 DESIGN OF ARCHITECTURAL MODEL FOR REAL TIME SCHEDULER SIMULATOR
The block diagram of the simulator with its hardware setup is shown in Figure 3.1. The front-end of the simulator is GUI- based and acts as user interface. The software in the front-end of the system gets the value from the user and transfers the value to the processor via serial port. The processor gets the values from the system, performs the requested function in the hardware and displays the output in the form of chronographic graph to the user interface.
Figure 3.1 Block diagram of the simulator
3.3.1 Front-End Software Design
This section describes the development of the proposed simulator framework in LabVIEW. Scheduling algorithm evaluation and analysis tool performs the task definition, task sets generation, execution of selected algorithms, execution, analysis of the execution and results displaying. The performance evaluation of the real-time scheduling algorithms is carried out
Back End Electrical Device
Electrical Device Electrical Device Electrical Device Electrical Device Processor Relay Relay Relay Relay Relay Front End RS 232
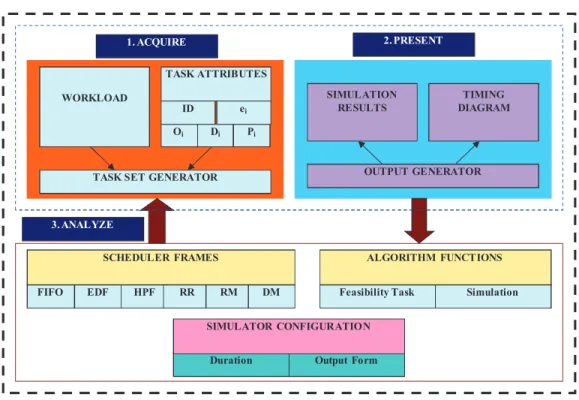
based on the results obtained through computational analysis. Various stages of evaluation procedure are: Identification of the tasks, Task set implementation, Selection of algorithms, Simulation Timing definition, Simulation execution and Scheduling algorithms evaluation. The architectural model for proposed software part of real time simulator is shown in Figure 3.2.
WORKLOAD
TASK ATTRIBUTES
ID ei
Oi Di Pi
TASK SET GENERATOR
SIMULATION RESULTS
OUTPUT GENERATOR TIMING DIAGRAM
SCHEDULER FRAMES ALGORITHM FUNCTIONS
FIFO EDF HPF RR RM DM Feasibility Task Simulation
Duration Output Form SIMULATOR CONFIGURATION
1. ACQUIRE 2. PRESENT
3. ANALYZE
Figure 3.2 Architectural model of software part of real-time simulator
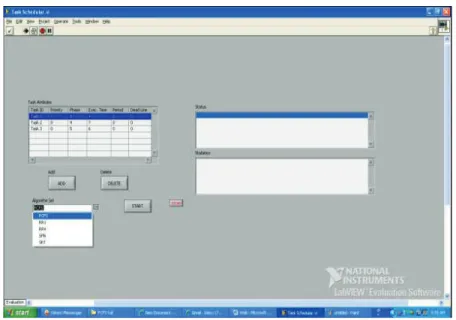
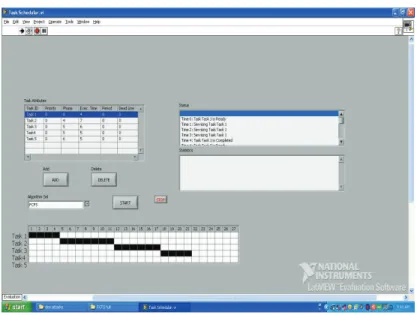
Real-time Scheduler Simulator is being developed to be used for teaching real-time scheduling as well as to test and evaluate the real-time scheduling policies used in embedded real-time applications. A framework for evaluation of a scheduling algorithm must satisfy characteristics such as simplicity, compatibility with the PC platform and the operating system, usage of the standard operating system functions, accuracy of results, ease of use, etc. Majority of these requests are aimed for use in the visual user interface that looks as shown in Figure 3.3.
Figure 3.3 Software front end of the simulator
The most successful scheduling algorithm for the periodic tasks scheduling is the one that has minimal response times, minimal number of tasks with missed deadlines and maximal resource utilization in the given workload and with other parameters. In real-time systems two characteristics of tasks are considered to be of primary interest: criticality or importance; and timing. Task importance is frequently a subjective issue, whereas timing is objective. The essential timing attributes of tasks are deadline (TD), worst-case computation time (Tcw) and period (Tp).
Elements of the simulator: Task Attributes are part of the simulator that allows the user to add a Task with parameters like Task ID, Priority, Phase, Execution Time, Period and Deadline. Among these parameters, Task ID should be unique for each input task. All other parameters are numerals. All the parameters are required to save a new task to a task set, modify the parameters of a task from the declared task set, delete task from the input task set.
Resource Usage: Add a resource to specific task for its execution (critical section) with Resource ID, Task ID, Start, and Time. Figure.3.5 shows the adding and deleting of a task in simulator.
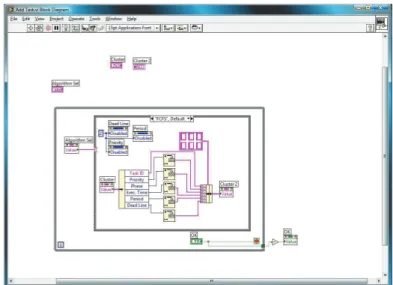
Figure 3.4 shows the sample graphical code for Adding and Deleting a task in simulator panel.
Figure 3.4 Graphical source code for Add Task.vi
Figure 3.5 Adding and deleting a task in simulator
Simulator Controls: This is the main part of the simulator which provides the following functions to the user: selection of Scheduling Policy, selection of Task Synchronization Protocol, choice of preemptive or non-preemptive scheduling and running the feasibility Test. The software output is shown in Figures 3.6 and 3.7.
Figure 3.6 Output view – Software
Figure 3.7 Output view – Status report 3.3.2 Web-Based Real Time Simulator
A web-based model for real time simulator has been developed. Any new algorithms can be tested in the proposed web-based simulator. There are vital reasons behind the implementation of the simulator as a Web-enabled framework and Web-based deployment as listed out here. They are ease in deployment and enhancement of functionality. Anytime, anywhere access to users – any computer with Web connectivity can use the proposed simulator. It offers easy access to users over the Internet, since no extra hardware or software is required to access the proposed simulator.
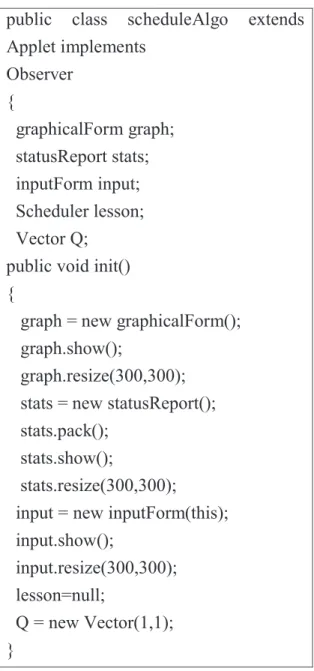
The web-based simulator consists of three panels :front end panel, graphical panel and output panel. Three panels are configured individually and integrated with code shown in Figure 3.8.
public class scheduleAlgo extends Applet implements Observer { graphicalForm graph; statusReport stats; inputForm input; Scheduler lesson; Vector Q;
public void init() {
graph = new graphicalForm(); graph.show();
graph.resize(300,300); stats = new statusReport(); stats.pack();
stats.show();
stats.resize(300,300);
input = new inputForm(this); input.show();
input.resize(300,300); lesson=null;
Q = new Vector(1,1); }
Figure 3.8 Sample code for integration of three panels of real time simulator
INPUT FORM
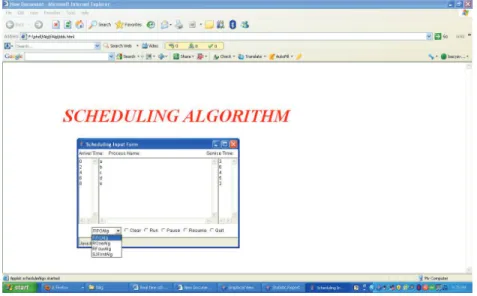
The developed web-based simulator has been published in http//:www.360degreeinfo.net
When user types the web address, the form will be displayed to the user where the user can enter the attributes of the tasks such as task id execution time etc. The simulator gets the task attributes and scheduling policies as input from the user. The user view of input form is shown in Figure 3.9.
Figure 3.9 Input form for web-based real-time scheduler simulator
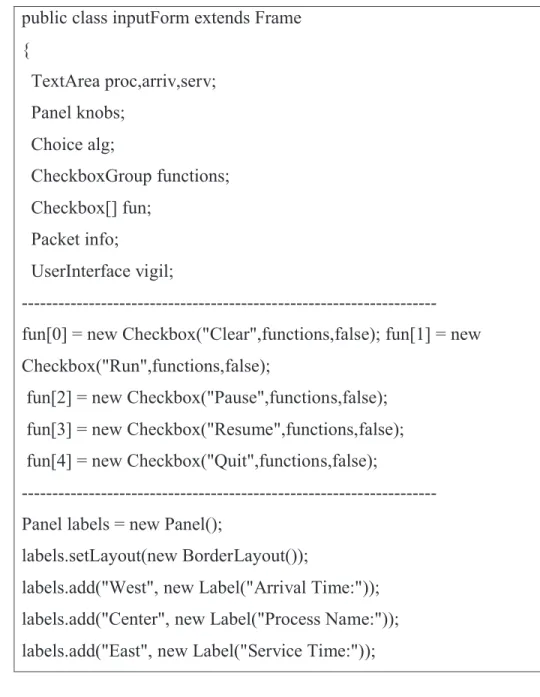
The input form has been designed and the sample code is shown in Figure 3.10.
public class inputForm extends Frame { TextArea proc,arriv,serv; Panel knobs; Choice alg; CheckboxGroup functions; Checkbox[] fun; Packet info; UserInterface vigil; --- fun[0] = new Checkbox("Clear",functions,false); fun[1] = new Checkbox("Run",functions,false);
fun[2] = new Checkbox("Pause",functions,false); fun[3] = new Checkbox("Resume",functions,false); fun[4] = new Checkbox("Quit",functions,false);
--- Panel labels = new Panel();
labels.setLayout(new BorderLayout());
labels.add("West", new Label("Arrival Time:")); labels.add("Center", new Label("Process Name:")); labels.add("East", new Label("Service Time:"));
Figure 3.10 Sample code for input form
GRAPHICAL FORM
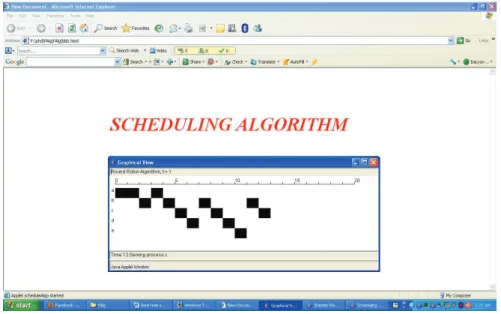
The graphical panel, based on the input received from the user, displays the output in the form of chronographic graph. Figure 3.11 shows the output of graphical panel of web-based simulator and Figure 3.12 is the the sample code for design of graphical panel.
Figure 3.11 Graphical panel output of web based real-time scheduler simulator
public graphicalForm () {
super("Graphical View"); board = new Canvas();
statusLine = new TextField(30); statusLine.setEditable(false); algTitle = new TextField(30); algTitle.setEditable(false); this.setLayout(new BorderLayout()); add("North", algTitle); add("South", statusLine); add("Center", board); }
STATISTICS FORM
Based on the input from the panel, statistics form displays the statistics result to the user. The output of the statistics form is shown in Figure 3.13. The sample code for statistics form is shown in Figure 3.14.
Figure 3.13 Statistics form of web based real- time scheduler simulator
public statusReport() { super("Statistic Report"); this.setLayout(new BorderLayout());
pad = new TextArea(30,30); pad.setEditable(true);
this.add("Center", pad); } // set display
public void report(Vector R,String title) {
pad.appendText("\n"+title+"\n\n"); out = R;
display();
} // report statistics to notepad ---
---private void display() { onWork temp; P = "Process"; A = "Arrival Time"; S = "Service Time"; F = "Finish Time"; Tq = "Turnaround Time"; Tqs = "Tq/Ts
Figure 3.14 Sample code for statistics form
3.4 CONCLUSION
This chapter makes a comparative study of various existing real-time scheduling simulation frameworks and highlights the features of the proposed simulator. Numerous benefits were quoted in support of the web-based deployment technique employed. The framework which is proposed can be used as an invaluable teaching tool. Further, the GUI of the framework will allow for easy comparison of the framework of existing scheduling policies and also simulate the behavior and verify the suitability of custom defined schedulers for real-time applications.