activation in [
15
O]-H
2
O PET scans
Manuel Desco,
a,* Mo´nica Penedo,
aJuan D. Gispert,
bJuan J. Vaquero,
aSantiago Reig,
aand Pedro Garcı´a-Barreno
aaLaboratorio de Imagen Me´dica, Unidad de Medicina y Cirugı´a Experimental, Hospital General Universitario
bGregorio Maran˜o´n,Q
E-28007 Madrid, Spain
bInstitut d’Alta Tecnologia, Parc de Recerca Biome`dica de Barcelona (PRBB), Barcelona, Spain
Received 29 April 2004; revised 12 August 2004; accepted 25 August 2004
This paper presents and evaluates a wavelet-based statistical analysis of PET images for the detection of brain activation areas. Brain regions showing significant activations were obtained by performing Student’s
ttests in the wavelet domain, reconstructing the final image from only those wavelet coefficients that passed the statistical test at a given significance level, and discarding artifacts introduced during the reconstruction process. Using Receiver Operating Characteristic (ROC) curves, we have compared this statistical analysis in the wavelet domain to the conventional image-domain Statistical Parametric Mapping (SPM) method. For obtaining an accurate assessment of sensitivity and specificity, we have simulated realistic single subject [15O]-H2O PET studies with different hyperactivation levels of the thalamic region. The results obtained from an ROC analysis show that the wavelet approach outperforms conventional SPM in identifying brain activation patterns. Using the wavelet method, activation areas detected were closer in size and shape to the region actually activated in the reference image.
D2004 Elsevier Inc. All rights reserved.
Keywords:ROC; Wavelet-based analysis; [15O]-H2O PET
Introduction
Statistical parametric mapping (SPM) methods are commonly used for the analysis of functional neuroimaging studies. These methods consist in performing a statistical test independently at every voxel of the brain image, yielding at orFmap where each voxel expresses the evidence against a null hypothesis of no effect
at that voxel (Frackowiak, 1997). In the broadly used software package SPM2 (from the Welcome Department of Cognitive Neurology, London, UK) (Frackowiak, 1997), the methodological procedure for studying functional neuroimaging data requires a pre smoothing step that improves signal to noise ratio and, to some extent, introduces neighboring information in the analysis. This prior manipulation of the images leads to a certain loss of resolution depending on the size of the filter kernel used, theoretically chosen to match the signal to be detected. Normally, the neighboring information is exploited in a post processing step to enhance the shape of the activation areas detected (McColl et al., 1994) or to correct the significance levels according to the spatial extent of the activated region (Poline et al., 1997).
Several multiresolution approaches have been proposed to detect statistically significant brain activation regions taking advantage from spatial neighborhood information (Poline and Mazoyer, 1994a,b; Shafie et al., 2003; Siegmund and Worsley, 1995, 2001; Worsley et al., 1996a). These methods are based on applying a sequence of smoothing kernels of different width, and performing the statistical analysis in the set of low pass filtered images obtained. As the decomposition used in these methods is redundant and non orthogonal, the number of statistical tests unnecessarily increase, incurring in a reduction of the specificity of the detection method due to multiple testing unless the significance level is corrected (Ruttimann et al., 1998).
Another alternative for studying functional brain images with multiresolution methods is to use wavelet transform, which decomposes a signal into different spatial scale sub bands. It is possible to analyze functional studies taking advantage of this spatial correlation if the statistical tests are applied in the wavelet domain. Moreover, the wavelet transform clusters the relevant information into a few coefficients while maintains the distribution of the Gaussian noise, thus permitting the use of parametric statistical tests and improving the signal to noise ratio (SNR) (Ruttimann et al., 1998; Unser et al., 1995).
Several approaches for the statistical analysis of functional brain studies in the wavelet domain have been reported with 1053-8119/$ - see front matterD2004 Elsevier Inc. All rights reserved.
doi:10.1016/j.neuroimage.2004.08.052
* Corresponding author. Laboratorio de Imagen Me´dica, Unidad de Medicina y Cirugı´a Experimental, Hospital General Universitario
bGregorio Maran˜o´nQ, C/ Dr. Esquerdo, 46, E-28007 Madrid, Spain. Fax: +34 426 51 08.
E-mail address:[email protected] (M. Desco).
promising results. A wavelet methodology for detecting differ ences in activity of [18F] FDG PET images was first proposed by Unser et al. (1995). In their approach using bidimensional orthogonal spline wavelets, v2 tests with Bonferroni correction permitted to discard those wavelet sub bands not significantly different from noise. Then, the method applied ztests to the coefficients in the remaining sub bands and reconstructed a final image showing activation regions from only those statistically significant wavelet coefficients. A similar procedure has also been applied to functional magnetic resonance images (fMRI) using cubic spline wavelets (Ruttimann et al., 1998).
Brammer (1998) proposed a slightly different wavelet based methodology for fMRI studies using a three dimensional discrete wavelet transform (DWT) with the orthogonal 12 tap Daubechies’ base. In this method, a Kolmogorov Smirnov test determined which wavelet coefficients showed statistically significant differences.
All these initial multiresolution studies using wavelet transform claimed better results than the standard statistical analysis in the image domain on the sole basis of an increase in sensitivity. However, sensitivity rate alone provides incomplete information: an accurate assessment should be based on both sensitivity and specificity values.
Following this idea, Feilner et al. (2000) presented an improvement of the procedure proposed in Ruttimann et al. (1998) for fMRI data usingt tests instead of z tests. Based on the false detection rate (Type I + Type II errors), they comparatively assessed different bidimensional fractional spline basis and decompositions, Daubechies basis, and SPM. In their experiments, they defined ellipses as activation patterns. They found that spline basis outperformed Daubechies wavelets, reporting that their approach was quite competitive with SPM. In another study, Desco et al. (2001)used a computer simulated phantom and Receiver Operating Characteristic (ROC) curves for comparing the performance of bidimensional multiresolution analysis versus SPM in the detection of brain activation in fMRI. The Gabor transform and several families of wavelets were included in the study (Daubechies, Lemarie, Symmlets,
Spline), testing different orders and decomposition levels. The study showed that multiresolution analysis provided better results than SPM, the Gabor decomposition offered the best results, and the other wavelet basis did not show major differences among them.
The present study proposes a three dimensional wavelet based method for the detection of brain activations in PET images, and compares this approach against the conventional SPM using ROC analysis. To enable a comprehensive ROC evaluation of the two methods, a set of realistic [15O] H2O PET studies was simulated to create a reference gold standard.
Materials and methods Simulated PET studies
We generated a simulated series of [15O] H2O PET studies, each one consisting of three baseline [IBi(x,y,z); i 1,2,3] and
three activation [IAi(x,y,z);i 1,2,3] scans (matrix size of 128
128 55 and voxel size of 1.8 1.8 3.0 mm), following a procedure similar to the one proposed by Davatzikos et al. (2001). Hyperactivation in the thalamic region was simulated
increasing the intensity level of the region by 2%, 5%, 10%, 15%, and 20%.
For the simulation of baseline [15O] H
2O PET scans, we started from a single 3 D magnetic resonance image (MRI) of a healthy subject (T1 weighted 3D gradient echo sequence, flip angle 308, TR 15.4 ms, TE 4.6 ms; matrix size of 256
256 110 and voxel size of 0.9 0.9 1.5 mm). An experienced radiologist manually set to zero extra cranial voxels (Fig. 1a). Using a thoroughly validated automatic method (Ashburner and Friston, 2000), we segmented this edited image into grey matter (GM), white matter (WM), and cerebral spinal fluid (CSF). The radiologist checked and corrected, if necessary, any inconsistency of the automatic segmentation. On the basis of the segmentation mask obtained, relative gray level intensities of 100:25:2 were assigned to GM, WM, and CSF, respectively (Fig. 1b) (Davatzikos et al., 2001). Then, we filtered the image volume with a smoothing Gaussian kernel (FWHM 886 mm) to simulate the point spread function of the PET camera. Each slice of this smoothed image was projected at 128 angles and decimated at 2:1. The global count level of the entire volume was set to 5106. Poisson noise was added to each voxel, with a standard deviation equal to the voxel intensity value. Finally, we applied the inverse Radon transform to the volume image using a back projection algorithm with a ramp filter multiplied by a Hann window (Fig. 1c). As a result of this process, we obtained a realistic phantom image of a [15O] H2O PET scan in baseline condition.
For generating the activation [15O] H
2O PET scans, we used the same MRI image. An expert radiologist segmented the thalamus manually (Fig. 1d) and its intensity value was increased by factors of 2%, 5%, 10%, 15%, and 20% before applying the PET simulation procedure (Fig. 1e). All the baseline and activation scans were normalized in intensity with proportional scaling, thus forcing all of them to have the same mean intensity value.
Selection of the wavelet base
The choice of an appropriate wavelet base should be aimed towards an efficient representation of the signal in the wavelet domain for the subsequent statistical analysis, considering the following properties (Ruttimann et al., 1998): (1) any orthogonal transformation preserves white noise distribution in the wavelet domain; (2) symmetric wavelets do not introduce phase distortion in the decomposition and consequently permit a more reliable signal localization in the wavelet domain; (3) a wavelet with a higher number of vanishing moments obtains better signal decorrelation in the wavelet domain; and (4) a wavelet with small support size (number of filter wavelet coefficients) obtains a better localization of the signal in the spatial domain.
However, the support size of the wavelet increases with its number of vanishing moments, which makes it necessary to establish a trade off between data decorrelation and spatial localization (Mallat, 1999). In the light of the theoretical properties mentioned above, and also considering the results reported in a previous study (Desco et al., 2001), we selected the symmlets
filters with four vanishing moments. Symmlets are separable orthogonal wavelets bases, almost symmetrical and with the minimum support size associated to a given number of vanishing moments (Mallat, 1999).
Statistical Parametric Mapping (SPM)
A usual analysis of functional neuroimaging data with SPM (Frackowiak, 1997) consists of two phases: a pre processing step and a voxel wise statistical analysis. The pre processing includes three stages: realignment, spatial normalization, and filtering. The realignment step corrects the effects of possible subject movements during the scanning session. The spatial normalization transforms the data into a standard anatomical space of reference. The pre filtering step in SPM is applied with several aims: (1) to increase signal to noise ratio, (2) to conform the data more closely to a Gaussian field model in the case of using Random Fields Theory to make statistical inference, (3) to ensure that activation changes from subject to subject are assessed on a spatial scale at which homologies in functional anatomy are typically expressed. In our case, the analysis of the one subject [15O] H2O PET functional study did require neither realignment nor normalization, since all images were generated from the same MR volume.
In the second phase, the voxel wise statistical analysis, SPM constructs a statistical parametric map where each voxel represents a statistic expressing evidence against a null hypothesis of no effect. Afterwards, SPM examines this parametric map to locate the voxels showing statistically significant effects at a pre established significance levela. The multiple comparisons problem is usually addressed making use of the theory of Gaussian random fields. In our case, we have not applied Random Fields Theory for computing a correctedPvalue.
Statistical analysis in the wavelet domain
In this work, we present a wavelet based multiresolution method as an alternative to the statistical study performed by SPM. The
wavelet based multiresolution approach carries out the statistical analysis in the wavelet domain, independently for every wavelet coefficient of the transformed images. As with SPM, it was not necessary to realign and spatially normalize image data. Our wavelet based statistical analysis proceeds according to the follo wing steps:
1. A three dimensional DWT (3D DWT) (symmlets 4; fourth decomposition level) is applied to all the baseline and activation scans of the simulated [15O] H2O PET study, obtaining the resultant wavelet baselineWBi(wx,wy,wz) and wavelet activation
volumesWAi(wx,wy,wz),i 1,2,3. For the implementation of the
three dimensional DWT, we used the bUvi WaveQ toolbox for Matlab (The Mathworks, Inc.) (Gonza´lez and Ma´rquez, 1996; Ma´rquez and Gonza´lez, 1996).
2. A between condition difference imageWBA (wx,wy,wz) is
calculated by subtracting the mean images for baseline WB
(wx,wy,wz) and activationWA(wx,wy,wz) conditions.
3. A tmap is constructed by means of Student’s ttests independently applied to each wavelet coefficient (without multi ple comparison correction see Discussion for details). The contrast statistic is:
tðwx;wy;wzÞ¼ WBAðwx;wy;wzÞ ˆ ssw2ðwx;wy;wzÞ p : 1 1 nB þ 1 nA q ð1Þ
where sˆw(wx,wy,wz) is the pooled standard deviation, calculated
as: ˆ ss2wðwx;wy;wzÞ ¼ðnB 1Þssˆ 2 WBðwx;wy;wzÞ þðnA 1Þˆss2W Aðwx;wy;wzÞ nBþnA 2 ð2Þ
Fig. 1. Simulation of PET scans: (a) initial MR image, (b) segmented image representing relative tracer concentrations, (c) simulated baseline [15O]-H2O PET
where sˆWB2 and sˆWA2 represent the baseline and activation
estimated variances, respectively, calculated coefficient by coefficient: ˆ ss2 W Bðwx;wy;wzÞ ¼ XnB i 1 WBiðwx;wy;wzÞ WgBðwx;wy;wzÞ nB 1 2 ð3Þ ˆ ss2W Aðwx;wy;wzÞ ¼ X nA i 1 WAiðwx;wy;wzÞ WgAðwx;wy;wzÞ nA 1 2 ð4Þ
and nB and nA are the number of images of each condition. 4. The tmap is analyzed to determine those coefficients statistically significant at a certain significance level (aWAV). These coefficients are considered to reflect the brain activation signal. The nonsignificant coefficients are considered to represent noise.
5. A 3D Inverse DWT (3D IDWT) is applied to WBA
(wx,wy,wz) after setting to zero all the statistically nonsignificant coefficients. As a result, we obtain an image volume of the significant activation regions in the spatial domain:Iresult(x,y,z). This image shows ringing artifacts produced by the reconstruction process as a consequence of the finite support size of the wavelet filter (Feilner et al., 2000).
6. Similarly, a noise image g (x,y,z) is reconstructed by applying another 3D IDWT toWBA (wx,wy,wz), using only the
wavelet coefficients that showed no significant differences in the statistical inference.
7. A final image Iresult(x,y,z) showing only brain regions with significant activations is obtained by thresholding Iresult (x,y,z). As threshold value, we chose the maximum difference in activity that a Student’s ttest in the spatial domain would
have not considered as significant, for a given statistical power b 0.8 (a 0.01): dmaxN:S:¼ tcdf1 1 a 2;df tcdf1ðb;dfÞˆssg ð5Þ
where tcdf1 is the inverse of Student’s t cumulative distribution function, a is the significance level, b is the required statistical power, df is the degrees of freedom of the t
distribution (nB + nA 2), and sˆg is the noise standard
deviation calculated from g (x,y,z). The activation voxels below this threshold are then considered as false activation voxels due to the wavelet reconstruction process and, thus, discarded.
Fig. 2shows a flow chart of the statistical wavelet analysis used in this study.
Evaluation
Receiver Operating Characteristic (ROC) analysis
The comparative evaluation between the wavelet based and the conventional SPM approaches in detecting activation regions on the simulated studies was performed in terms of sensitivity, specificity, and area under the ROC curve. Sensitivity was defined as the percentage of voxels correctly detected as activated, and specificity as the percentage of voxels correctly detected as nonactivated. These parameters were obtained by comparing the result of the statistical methods with the original binary mask of the thalamus as defined for the simulation (Fig. 1d).
For each [15O] H2O PET study, we varied the significance level of the statistical analysis from 109to 0.99 (aWAVin the wavelet domain andain the spatial domain) providing 75 pairs sensitivity/ specificity to build the ROC curve. Additionally, to provide parameters easier to interpret in a clinical context than the ROC
Fig. 2. Overview of the wavelet-based statistical analysis: a wavelet transform is applied to the simulated [15O]-H
2O PET scans normalized in intensity, then a
Student’sttest is applied in the wavelet domain and a final image in the spatial domain is recovered from the statistically significant coefficients after correcting ringing artifacts.
curve area, we also present the sensitivity at 95% and 99% of specificity for each method and activation level. For the SPM approach, the specificities of 95% and 99% were obtained at their corresponding significance levels (a) of 0.05 and 0.01, respec tively, whereas for the wavelet approach aWAV corresponded to 0.15 and 0.25 for the same specificity levels.
To deal with the random fluctuations derived from noise in these measurements, we worked with 15 different replications of each [15O] H2O PET study. An averaged ROC curve across the 15 experimental replications was obtained for each activation level of the thalamic region. Additionally, to assess whether the number of baseline/activation scans may affect our results, we repeated the analysis on five replications of [15O] H2O PET studies consisting of six baseline and six activation scans, with activation levels of the thalamus of 2%, 5%, 10%, 15%, and 20%.
Pre smoothing of images
To evaluate the effect of pre smoothing in both methods, we performed all the experiments with and without applying a Gaussian filter with a kernel size of FWHM 5 5 5 mm. To evaluate the dependency of sensitivity and specificity on the kernel size, we have also tested the sensitivity at 95% and 99% of specificity on five replications of one subject [15O] H2O PET study, using kernels sizes of 4 and 6 mm.
Consistency of the false positive fraction yielded by the wavelet based statistical approach
To further validate our wavelet based analysis, we tested whether the false positive fraction (FPF) remains below or equal to a given significance level (aWAV
) when there is no activation signal. We used five replications of one subject simulated [15O] H2O PET study and plotted the averaged FPF vs. the significance level of the Student’sttest in the wavelet domain (aWAV), with and without pre smoothing.
Results
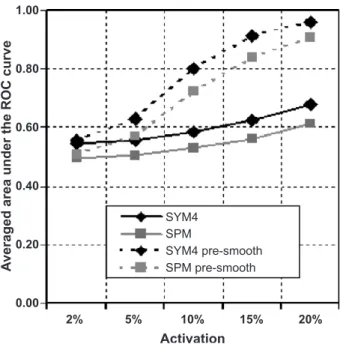
Fig. 3shows the area under the averaged ROC curves obtained for each activation level with the wavelet based statistical method usingSymmlets 4 (SYM4) and the conventional statistical method (SPM). A noticeable increase in performance was observed for both methods when operating on pre smoothed images, partic ularly at higher activation levels. In terms of area under the ROC curve, the statistical analysis in the wavelet domain outperforms the statistical analysis in the image domain for all activation levels, even when the number of activation and baseline scans in the study was raised to six.
Sensitivity rates at 95% and 99% of specificity for the wavelet based and the conventional SPM are shown in Fig. 4. At both specificity rates, the statistical wavelet approach achieved better sensitivity than SPM, both with original and pre smoothed images. More noticeable advantage of the wavelet analysis over conven tional SPM is observed at the highest specificity rate tested (99%). We have also found that the sensitivity increases with the kernel size using either the wavelet based approach or SPM. When changing the kernel size to 4 and 6 mm, the sensitivity at 95% and 99% of specificity varied up toF20%, with respect to the results obtained with a kernel size of 5 mm.
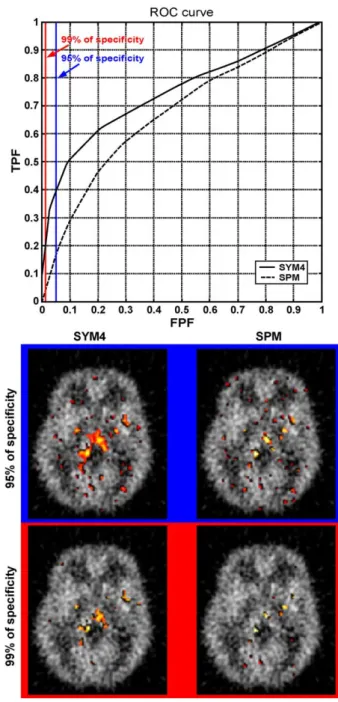
Fig. 5 shows an example of the results obtained with both methods. It corresponds to a case with 10% of activation level of the thalamus, using pre smoothed images. At specificity rates of 95% and 99%, significant hyperactivation areas are closer in size and shape to real activations with the wavelet method than with conventional SPM. The ROC curve for this example confirms that the statistical analysis in the wavelet domain offers a globally better accuracy for the detection of activation voxels, since for any FPF, the true positive fraction (TPF) provided by the wavelet based approach is higher.
The results of the consistency checking of the FPF yielded by our statistical analysis in the wavelet domain are shown inFig. 6. The FPF obtained with our approach stays below or equal toaWAV in a wide range of specificity rates (30 100%), corresponding to a FPF range of 70 0%. The reason why the line in this plot is not close to the diagonal is thataWAVis a parameter that predicts the proportion of false positives in the wavelet domain, not in the image domain. The significance level of the Student’sttest in the wavelet domain aWAV
has no a straightforward translation into the image domain, provided that each significant coefficient contributes to various voxels in the image domain. However, the results showed supports the consistency and validity of the wavelet based statistical procedure.
Discussion
In this work, we present and evaluate a wavelet based statistical analysis for the detection and localization of brain activation regions in functional neuroimage studies. We follow an approach similar to that ofRuttimann et al. (1998)andUnser et al. (1995), applying a statistical test in the wavelet domain to detect significant differences between two groups. These previous works used a single pooled variance value for the statistical inference in the wavelet domain, assuming constant variance among coefficients in the wavelet transformed images. Particularly, Ruttimann et al. (1998) pooled the variance over all intra cranial voxels in the wavelet domain to obtain a single variance value.
Fig. 3. Averaged areas under the ROC curve vs. activation level, obtained using the wavelet-domain (SYM4) and spatial-domain (SPM) statistical analysis, with and without pre-smoothing.
Contrary to these previous works,Feilner et al. (2000) made use of a voxel wise variance for the statistical test, after concluding that the variance is not homogenous over the wavelet space. In their work, they also propose the use of a final thresholding step for discarding false activation voxels associated to the ringing artifacts of the wavelet based method. As threshold, they used the noise level of the averaged between condition difference image, calcu lated in the spatial domain. Other previous studies (Brammer, 1998; Desco et al., 2001; Ruttimann et al., 1998; Unser et al., 1995) did not include any post processing step for eliminating the artifacts introduced in the wavelet reconstruction process.
In our study, we first applied a Levene’s test for determining whether the variance of the wavelet coefficients was homogeneous (Levene, 1960). The test showed that the difference image did not comply with the assumption of variance homogeneity across
wavelet coefficients (Pb0.001). This allowed us to discard the use of a single variance value, as inRuttimann et al. (1998)andUnser et al. (1995), and to consider a voxel by voxel variance for the Student’s ttest, in agreement with Feilner et al. (2000). Our statistical approach also includes a final thresholding in the image domain for eliminating ringing artifacts. In contrast to the denoising method employed byFeilner et al. (2000), we tried to determine the threshold using parameters with a statistical interpretation more intelligible for the user, as are power and effect size. The threshold chosen was the difference in brain activity that would be considered as significant by a Student’sttest applied in the image domain for a statistical power of 80%.
Fig. 5. ROC curves obtained for a [15O]-H2O simulated PET study with
10% of thalamus activation with pre-smoothing of images using statistical analysis in the wavelet domain and conventional SPM. The corresponding hyperactivation areas obtained at 95% and at 99% of specificity are also shown.
Fig. 4. Sensitivity at specificity levels of 95% and 99% obtained with the wavelet-based and spatial-domain statistical methods.
Differences lower than this threshold are, thus, more likely to correspond to ringing artifacts during the wavelet reconstruction process than to real activations. The level of 80% chosen for the power is quite standard in statistical studies, although a different value could have been selected. Another difference with respect to
Feilner et al. (2000)is that they calculate the noise variance from all activation and baseline images of the study. This approach may overestimate the overall noise figure as it merges two sources of variance: actual noise and between condition differences. With our method, we estimate this noise variance from the image recon structed from those wavelet coefficients not associated to brain activity. Our results show an increase of sensitivity of the multiresolution wavelet based approach as compared to SPM, in accordance with previous reports (Brammer, 1998; Ruttimann et al., 1998; Unser et al., 1995). However, these previous studies did not provide a quantitative assessment of the improvement. Other studies have evaluated multiresolution wavelet based approaches based on the simultaneous measurement of sensitivity and specificity (Desco et al., 2001; Feilner et al., 2000) using geometrical shaped activation patterns as reference gold standard. As a difference to previous works (Desco et al., 2001; Feilner et al.,
2000; Ruttimann et al., 1998; Unser et al., 1995), our statistical approach considers 3D neighborhood information applying a three dimensional wavelet transform. In our study, we have assessed our wavelet based statistical methodology with realistic 3D PET images. Using our methodological approach for the simulation of realistic PET scans, it is possible to reproduce a wide variety of clinical research situations and test the influence of the different parameters (such as activation foci size, activated brain structure, smoothing, spatial normalization, etc.) in the detection of brain activation areas.
Other authors in the literature have stated that, theoretically, to discard the nonsignificant coefficients in the wavelet domain is somewhat equivalent to apply a low pass filter in the images (Ruttimann et al., 1998; Turkheimer et al., 1999; Unser et al., 1995). However, they have not explicitly shown that its effect is similar to that obtained when pre smoothing the images. For this reason, we considered worthy to study the influence of the pre smoothing in our wavelet based statistical approach, as compared to SPM. Although we do not apply Random Field Theory, we decided to make use of the most commonly applied kernel size in SPM studies, which is two or three times the voxel size of the images (Friston et al., 1995). Additionally, we investigated the influence of the kernel size on the results obtained with simulated PET studies. Our results indicate that pre smoothing improves the overall performance of both the conventional and the multi resolution methods, as it was also suggested in Desco et al. (2001).
Both spatial domain and wavelet domain analysis pose the problem of multiple comparisons. When several statistical tests are performed independently (in our case, Student’sttests are applied for every wavelet coefficient in the scan), the probability of making a Type I error increases. The correction of the multiple comparisons problem consists in properly adjusting the signifi cance level to a more strict value. SPM addresses this problem through the Random Field Theory (Poline et al., 1997; Worsley et al., 1996b), whose application requires a pre smoothing of the images. Although this multiple comparison problem also appears with wavelet domain approaches, its solution is not the purpose of this work. For the ROC evaluation of our wavelet based method on simulated images, correction for multiple comparisons has not been necessary since we obtain the ROC curve by sweeping a wide range of significance level values and the use of any multiple test correction technique would lead to exactly the same ROC curve, obtained at higheraWAVoravalues. Nevertheless, a correction for multiple comparisons should be considered when applying any method to real data. Some previous studies have applied a Bonferroni correction in the wavelet domain (Feilner et al., 2000; Ruttimann et al., 1998; Unser et al., 1995). However, this adjustment for multiple testing may not be entirely appropriate because of some residual statistical dependence among intracranial voxels in the wavelet space.
Our wavelet based approach has been tested on a PET data set with a particularly poor SNR (high noise variance), mainly due to the characteristics of the tracer chosen for the simulated study (15O H2O), and to the low number of scans. Although the type of functional studies we have used may represent a common case in practice, further research should investigate the performance of the method in data sets with a larger number of condition scans, or acquired with other radiotracers, where the wavelet approach could not take so much benefit from the SNR improvement intrinsic to the wavelet transform.
Fig. 6. Plots of averaged FPF vs. significance level for the statistical analysis in the wavelet domain obtained from a simulated [15O]-H2O PET
Another limitation of our ROC analysis is that the results have been obtained using only one region (thalamus) as activation area. Although we have made no attempts tobtuneQthe parameters of our method, it could be argued that it is particularly well suited to areas of that size. This issue is, to a great extent, shared by the conventional approach, in which the use of different filter kernels may alsobfitQthe procedure to different expected activation sizes. For a thorough assessment of this aspect, additional analysis should be accomplished using simulated PET studies with other activated brain regions of different sizes.
Also, the [15O] H2O PET scans simulated for this study are perfectly aligned with respect to each other, since all were generated from the same MR image. However, in real cases, the patient’s head may have moved from scan to scan, and the shape and size of the brain may vary significantly from one patient to another in multi subject studies, being necessary a realignment and normalization process as a previous step before the statistical analysis. Additional analysis should study how the process of realigning the functional images onto a common reference frame work could affect the outcome of the statistical analysis in the wavelet domain. Application of our statistical wavelet based methodology to real data, where intensity, size, and localization of activations are unknown, is straightforward.
Conclusion
Our statistical wavelet based method outperforms conventional SPM for detecting differences in simulated functional neuro imaging [15O] H2O PET studies in terms of ROC curve area and values of sensitivity and specificity. The wavelet analysis shows better fidelity than conventional SPM in preserving the shape and size of the activation areas. Pre smoothing increases performance of both statistical approaches.
Acknowledgments
This work has been partially supported by grants TIC2001 3697 C03 03 and Red Tematica Im3.
References
Ashburner, J., Friston, K.J., 2000. Voxel-based morphometry the methods. NeuroImage 11, 805 821.
Brammer, M.J., 1998. Multidimensional wavelet analysis of functional magnetic resonance images. Hum. Brain Mapp. 6, 378 382. Davatzikos, C., Li, H.H., Herskovits, E., Resnick, S.M., 2001. Accuracy
and sensitivity of detection of activation foci in the brain via statistical parametric mapping: a study using a PET simulator. NeuroImage 13, 176 184.
Desco, M., Hernandez, J.A., Santos, A., Brammer, M., 2001.
Multi-resolution analysis in fMRI: sensitivity and specificity in the detection of brain activation. Hum. Brain Mapp. 14, 16 27.
Feilner, M., Blu, T., Unser, M., 2000. Optimizing wavelets for the analysis of fMRI data. In SPIE International Society for Optical Engineering, San Diego, CA, USA, pp. 626 637.
Frackowiak, R.S.J., 1997. Human brain function. Academic Press, San Diego.
Friston, K.J., Holmes, A.P., Worsley, K.J., Poline, J.P., Frith, C.D., Frackowiak, R.S.J., 1995. Statistical parametric maps in functional imaging: a general linear approach. Hum. Brain Mapp. 2, 189 210. Gonza´lez, N., Ma´rquez, O.W., 1996. Uvi_wave, the ultimate toolbox for
wavelet transforms and filter banks. Proc. 4th Workshop on Intelligent Methods in Signal Processing and Communication.
Levene, H., 1960. Robust tests for the equality of variance. In: I.O. (Ed.), Contributions to Probability and Statistics. Stanford University Press, Stanford, CA, pp. 278 292.
Mallat, S.G., 1999. A Wavelet Tour of Signal Processing. Academic Press, San Diego.
Ma´rquez, O.W., Gonza´lez, N., 1996. An interactive software for a hypertext course in wavelets. Proc. 7th IEEE Digital Signal Processing Workshop. McColl, J.H., Holmes, A.P., Ford, I., 1994. Statistical methods in neuroimaging with particular application to emission tomography. Stat. Methods Med. Res. 3, 63 86.
Poline, J.B., Mazoyer, B.M., 1994a. Analysis of individual brain activation maps using hierarchical description and multiscale detection. IEEE Trans. Med. Imag. 13, 702 710.
Poline, J.B., Mazoyer, B.M., 1994b. Enhanced detection in brain activation maps using a multifiltering approach. J. Cereb. Blood Flow Metab. 14, 639 642.
Poline, J.B., Worsley, K.J., Evans, A.C., Friston, K.J., 1997. Combining spatial extent and peak intensity to test for activations in functional imaging. NeuroImage 5, 83 96.
Ruttimann, U.E., Unser, M., Rawlings, R.R., Rio, D., Ramsey, N.F., Mattay, V.S., Hommer, D.W., Frank, J.A., Weinberger, D.R., 1998. Statistical analysis of functional MRI data in the wavelet domain. IEEE Trans. Med. Imag. 17, 142 154.
Shafie, K., Sigal, B., Siegmund, D.O., Worsley, K.J., 2003. Rotation space random fields with an application to fMRI data. Ann. Stat. 31, 1732 1771.
Siegmund, D.O., Worsley, K.J., 1995. Testing for a signal with unknown location and scale in a stationary Gaussian random field. Ann. Stat. 23, 608 639.
Turkheimer, F.E., Brett, M., Visvikis, D., Cunningham, V.J., 1999. Multiresolution analysis of emission tomography images in the wavelet domain. J. Cereb. Blood Flow Metab. 19, 1189 1208.
Unser, M., The´venaz, P., Lee, C., Ruttimann, U.E., 1995. Registration and statistical analysis of PET images using the wavelet transform. IEEE Eng. Med. Biol. Mag. 14, 603 611.
Worsley, K.J., 2001. Testing for signals with unknown location and scale in a chi^2 random field, with an application to fMRI. Adv. Appl. Probab. 33, 773 793.
Worsley, K.J., Marrett, S., Neelin, P., Evans, A., 1996a. Searching scale space for activation in PET images. Hum. Brain Mapp. 4, 74 90. Worsley, K.J., Marrett, S., Neelin, P., Vandal, A.C., Friston, K.J., Evans,
A.C., 1996b. A unified statistical approach for determining signifi-cant signals in images of cerebral activation. Hum. Brain Mapp. 4, 58 73.
![Fig. 1. Simulation of PET scans: (a) initial MR image, (b) segmented image representing relative tracer concentrations, (c) simulated baseline [ 15 O]-H 2 O PET scan, (d) thalamus segmentation mask, (e) simulated scan with activation in the thalamic region](https://thumb-us.123doks.com/thumbv2/123dok_us/9496830.2432157/3.892.144.741.102.512/simulation-segmented-representing-concentrations-simulated-segmentation-simulated-activation.webp)
![Fig. 2. Overview of the wavelet-based statistical analysis: a wavelet transform is applied to the simulated [ 15 O]-H 2 O PET scans normalized in intensity, then a Student’s t test is applied in the wavelet domain and a final image in the spatial domain is](https://thumb-us.123doks.com/thumbv2/123dok_us/9496830.2432157/4.892.137.771.742.1055/overview-statistical-analysis-transform-simulated-normalized-intensity-student.webp)
![Fig. 6. Plots of averaged FPF vs. significance level for the statistical analysis in the wavelet domain obtained from a simulated [ 15 O]-H 2 O PET study with no activation (with and without pre-smoothing of images).](https://thumb-us.123doks.com/thumbv2/123dok_us/9496830.2432157/7.892.90.393.107.689/averaged-significance-statistical-analysis-obtained-simulated-activation-smoothing.webp)
