HAL Id: hal-01391193
https://hal.archives-ouvertes.fr/hal-01391193
Submitted on 3 Nov 2016
HAL is a multi-disciplinary open access archive for the deposit and dissemination of sci-entific research documents, whether they are pub-lished or not. The documents may come from teaching and research institutions in France or abroad, or from public or private research centers.
L’archive ouverte pluridisciplinaire HAL, est destinée au dépôt et à la diffusion de documents scientifiques de niveau recherche, publiés ou non, émanant des établissements d’enseignement et de recherche français ou étrangers, des laboratoires publics ou privés.
Distributed under a Creative Commons Attribution| 4.0 International License
Tonal noise of a controlled-diffusion airfoil at low angle
of attack and Reynolds number
Thomas Padois, Paul Laffay, Alexandre Idier, Stéphane Moreau
To cite this version:
Thomas Padois, Paul Laffay, Alexandre Idier, Stéphane Moreau. Tonal noise of a controlled-diffusion airfoil at low angle of attack and Reynolds number. Journal of the Acoustical Society of America, Acoustical Society of America, 2016, 140 (1), pp.113-118. �10.1121/1.4958916�. �hal-01391193�
Tonal noise of a controlled-diffusion airfoil at low
angle of attack and Reynolds number
Thomas Padois, Paul Laffay, Alexandre Idier, and Stephane Moreau
Department of Mechanical Engineering, Universite de Sherbrooke, 2500 Boulevard de l’Universite, Sherbrooke, Quebec J1K 2R1, Canada
thomas.padois@usherbrooke.ca, paul.laffay@usherbrooke.ca, alexandre.idier@usherbrooke.ca, Stephane.Moreau@usherbrooke.ca
Abstract:Theacousticsignatureofacontrolled-diffusionairfoilim-mersedinaflowis experimentallycharacterized.Acousticmeasure-mentshavebeencarriedoutinan anechoicopen-jet-wind-tunnelforlowReynoldsnumbers(from5 104to4.3 105)and severalanglesofattack.AswiththeNACA0012,theacousticspectrumisdominatedby discretetones.Thesetonalbehaviorsaredividedintothreedifferentregimes.Thefirstone ischaracterizedbyadominantprimarytonewhichissteadyovertime,surroundedby secondarypeaks.Thesecondconsistsoftwounsteadyprimarytonesassociatedwith secondarypeaksandthethirdconsistsofahumpdominatedbyseveralsmallpeaks.A waveletstudyallowsonetoidentifyanamplitudemodulationoftheacousticsignal mainlyfortheunsteadytonalregime.Thisamplitudemodulationisequaltothe frequencyintervalbetweentwosuccessivetones.Finally,abispectralanalysisexplains thepresenceoftonesathigherfrequencies.
1. Introduction
In 1973, Paterson et al. investigated the noise emitted by a NACA0012 profile im-mersed in flow.1 For low to moderate Reynolds number, they showed that the acoustic spectrum is dominated by discrete tones. They defined a formula describing the evolu-tion of the frequency of the dominant tone as a funcevolu-tion of the flow velocity, the chord profile, and the air viscosity. However, the ladder-type structure of the frequency evo-lution was not explained. A year later, Tam2 suggested a feedback loop process to ex-plain the ladder-type structure. Since then several studies have been conducted experi-mentally and numerically on NACA0012 profiles, mainly to understand the feedback loop mechanism.3–5 These studies seem to converge towards a boundary layer instabili-ty triggering an acoustic feedback between the transition zone and the trailing edge. Recent studies have also shown that the secondary tones are linked by an amplitude modulation of the acoustic signal.6,7 In this study, the interest is not focused on the NACA0012 but on an industrial cambered controlled diffusion airfoil, called the CD profile. This profile reduces drag and has been used for turboengine compressor blades, automotive engine cooling fan systems, and heat and ventilation air-conditioning sys-tems. The aerodynamic and acoustic characteristics of this profile have been investigat-ed both numerically and experimentally8–12 especially at moderate and high angles of attack. In the present study, noise generated by this profile at low angle of attack is ex-perimentally studied. The results are compared with previous observations derived from the NACA0012, and advanced signal processing tools are used to understand the presence of discrete tones.
2. Experimental set-up
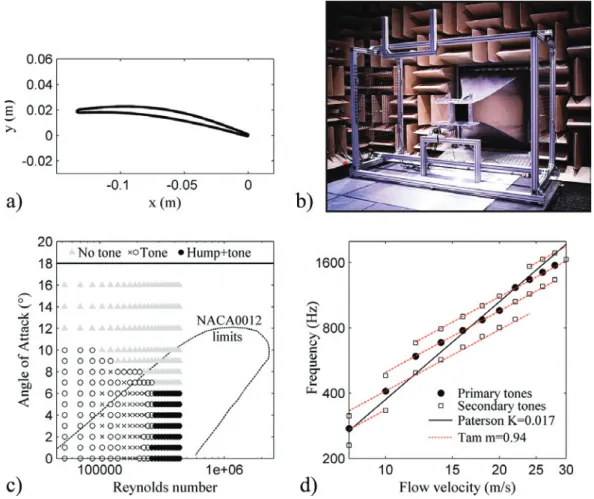
Acoustic measurements have been carried out on a CD profile in the anechoic open-jet-wind-tunnel at Universite de Sherbrooke. This open-jet wind tunnel is found to have a uniform mean flow in the test section with limited boundary layers due the strong contraction (1:25) and to have consequently a low inlet turbulence intensity (less than 0.4%).13 The CD profile is a thin cambered profile with a 4% relative thick-ness [Fig. 1(a)]. The test model has a chord length of c¼135 mm and a span of
l¼300 mm, placed vertically at the exit of a square 300300 mm2 nozzle between two horizontal Plexiglas plates [Fig. 1(b)]. Measurements were conducted for flow velocities between U0¼[6–50] m/s which correspond to Reynolds numbers based on the chord
(Rec¼U0c/ with the air kinematic viscosity) from Rec¼5104 to 4.3105. The
was controlled at 21 C by a heat and ventilation air-conditioning system. Far-field acoustic measurements have been carried out in order to characterize the acoustic sig-nature of the CD profile. Two Bruel&Kjaer microphones No. 4957 were placed per-pendicular to the flow direction on both sides of the airfoil at 1.34 m from the trailing edge. Acoustic signals were acquired with Bruel&Kjaer LAN-XI modules for 100 s at 65 536 Hz. The experimental set-up has been described in detail by Padois et al.13
3. Acoustic signature of the CD profile
As in Paterson’s study on the NACA0012 profile, the acoustic signature of the CD profile is studied with respect to the flow velocity (or the Reynolds number) and the AoA. For each couple (Rec, a), the power spectral density (PSD) of the microphone
signal on the airfoil pressure side is computed. The acoustic signature on the suction side is similar to that shown in Padois et al.13 The PSD is obtained with 65 536 points per time segment weighted by a flattop window and 50% overlap which lead to a fre-quency resolution of Df¼1 Hz. The PSD of the microphone signal exhibits two main behaviors which are broadband and tonal. For each case, the presence of a tone was searched for and reported in Fig. 1(c) in relation to the AoA and the Reynolds num-ber. For a>12 and all flow velocities, the acoustic signature of the CD profile is al-ways characterized by a broadband noise, without tones, caused by an early transition to turbulence on the suction side and consequently a fully turbulent flow near the trail-ing edge. For a<10, the two behaviors (broadband and tonal) can be clearly distin-guished. For a<6 and Rec>2.6105, the PSD of the microphone signal exhibits a
hump with tones similar to the results of Arbey et al.3 and more recently by Chong and Joseph14 and Salas and Moreau.15 When the AoA increases, the tones disappear and the acoustic signature becomes broadband. Indeed tonal noise does not appear when increasing both the Reynolds number and the angle of attack as already noted by Desquesnes et al.6 on the NACA0012. For low Reynolds number (Rec<2.6105)
and low AoA (a<10), the PSD of the microphone signal is characterized by discrete tones commonly associated with amplified boundary layer instabilities that are scat-tered at the trailing edge. The zone of tonal noise on the CD profile seems to be more upright than on the NACA0012 taken from Desquesnes et al.6 In order to compare
Fig. 1. (a) (Color online) Controlled-diffusion airfoil and (b) experimental set-up. (c) Presence of discrete tones in relation to the Reynolds number and angle of attack. The gray triangles represent the broadband behavior. The black dots, crosses, and circles are the tonal behavior. The black crosses and circles distinguish the steady and unsteady cases (see Sec.4). (d) Evolution of the frequency of the discrete tone versus the flow velocity.
with the NACA0012 results, the case a¼0, which is in the NACA0012 limits of tonal noise, is investigated.
For each PSD of the microphone signal, the frequency f of the primary and secondary tones are searched and reported with respect to the flow velocity in Fig.
1(d). Overall, the frequency of the primary tone seems to follow Paterson’s law, which refers to a vortex shedding regime
f ¼KU1:5=pffiffiffiffiffic; (1)
where K is a constant equal to 0.017 for the CD profile (0.011 for a NACA0012). However, the tones follow the ladder-type structure described by Tam’s model and found in several previous studies.14,16 Therefore, the evolution of the frequency sug-gests that the tones on the CD profile are also generated by an acoustic feedback due to instabilities in the boundary layer.
4. Power spectral density and spectrogram of the microphone signal
To highlight the different acoustic signatures of the CD profile, three flow velocities are investigated U0¼[16–20–34] m/s (with a¼0). All of these cases correspond to a
tonal behavior. Figures 2(a)–2(c) show the PSD of the microphone signal on the pres-sure side. The background noise, which corresponds to the noise generated without the profile, is also shown. For each case, the noise generated by the interaction of the flow with the profile clearly emerges from the background noise.
When U0¼16 m/s, the PSD of the microphone signal exhibits a primary tone
at 779 Hz which is 20 dB/Hz above the secondary tones. The frequencies of the second-ary tone are 653 and 904 Hz, respectively. The frequency spacing between the primsecond-ary tone and the secondary tones are 126 and 125 Hz, respectively. Two tones at higher frequencies with lower sound pressure levels are also present (1558 and 2337 Hz).
When U0¼20 m/s, the PSD of the microphone signal exhibits two primary
tones at 963 and 1120 Hz with almost the same magnitude. Two secondary tones on each side are present, 808 and 1284 Hz. At higher frequencies, three peaks are present at 1771, 1928, and 2238 Hz. The frequency spacing between the primary tones and the secondary tones is in average 159 Hz.
When U0¼34 m/s (hump with tonal case), the tone detection is more difficult
because of the higher background noise level and the decrease of the sound pressure level of the broader tones. However, a primary tone exists at 2843 Hz with secondary tones at 2577 and 3310 Hz. A tone at 2363 Hz is also present.
The PSD is a good estimator of the frequency content of a signal, however, it does not bring information about the time evolution. In the following the spectrogram of the microphone signal is computed in order to obtain the time history of the
Fig. 2. (Color online) Power spectral density (top) and spectrogram (bottom) of the microphone signal on the pressure side. The flow velocity is set to (a),(d)U¼16 m/s, (b),(e)U¼20 m/s, and (c),(f)U¼34 m/s and the an-gle of attack is set toa¼0.
frequency content [Figs. 2(d) to 2(f)]. When U0¼16 m/s or U0¼34 m/s, the primary
tone exists during the 100 s of the acquisition, especially for the lowest flow velocity where the spectrogram depicts a continuous line at the frequency of the primary tone. These two tonal cases are referred to as the steady case. When U0¼20 m/s, the
acous-tic behavior of the primary tone is completely different. The primary tone frequency switches between the two frequencies previously identified. When the tone at 963 Hz appears, the tone at 1120 Hz disappears, and conversely. Moreover, the presence of the tone at 963 Hz is shorter but the sound pressure level is higher. This case is referred to as the unsteady case and is shown by crosses in Fig. 1(c). To summarize, the tonal be-havior has three different cases, the steady tones [Fig. 2(a) and 2(d)], the unsteady tones [Fig. 2(b)and 2(e)] and the steady hump with tones [Fig.2(c) and 2(f)]. The three cases are investigated with advanced signal processing tools in the Sec. 5.
5. Wavelet transform of the microphone signal
In order to investigate the unsteady behavior of the acoustic signal, a wavelet analysis is used. The acoustic signal is divided into a time segment of 16 384 samples and a Morlet wavelet is used.17 This signal processing tool is used to perform a time frequen-cy analysis of the acoustic signal with a better time resolution. Figures 3(a) to 3(c)
show the normalized square modulus of the wavelet transform coefficients for a time segment. In all cases, maxima at steady time intervals occur. Moreover, these maxima appear at the frequency of the primary tone. This phenomenon has been assigned to an amplitude modulation of the acoustic signal by Pr€obsting el al.7 To get better in-sight into the amplitude modulation, the maximum of the wavelet transform coeffi-cients is searched and the time signal is extracted. Then, the PSD of the time signal is computed. This processing is repeated for all the acoustic time history in order to aver-age the PSD. Figures 3(d) to 3(f) show the PSD for the three cases. For the steady cases, peaks at 120 and 268 Hz hardly emerge from the PSD. These frequencies corre-spond to the frequency spacing obtained in the PSD of the microphone signal. For the unsteady case, the PSD clearly exhibits a peak at 160 Hz and a second at twice the fre-quency which means that the amplitude modulation is stronger in this case.
Fig. 3. (Color online) Normalized square modulus of the wavelet coefficients of the microphone signal on the pressure side (top). The black line is the extracted time signal. Power spectral density of the extracted time signal (bottom). The flow velocity is set to (a),(d)U¼16 m/s, (b),(e)U¼20 m/s and (c),(f)U¼34 m/s and the angle of attack is set toa¼0.
Table 1. Bicoherence concept.
Linear interaction Non-linear interaction
Three independent sources atf1,f2,f3 Two sourcesf1andf2withf3¼f1þf2
6. Bicoherence of the microphone signal
In order to understand the presence of high frequency peaks in the PSD of the acoustic signal, the bicoherence is computed for each case. This advanced signal processing tool allows one to find the quadratic nonlinear interactions and phase coupling between three waves. It corresponds to a third order Fourier transform or cumulant spectrum of the three signals that measures their phase coherence, whereas the PSD is a second order Fourier transform or cumulant spectrum that is independent of the phases of the waves. Therefore, if several tones are present in the PSD, the total number of indepen-dent sources cannot be iindepen-dentified. The only information provided by the PSD is the fre-quency and the magnitude of the tones. The bicoherence, by providing the phase cou-pling, allows one to discover if a tone has been created by the quadratic nonlinear interaction between two signals. For example, if three tones at frequencies (f1, f2, f3)
are present in the PSD of the microphone signal, it is impossible to identify the total number of independent sources, i.e., three independent sources or two sources which non-linearly interact to create a third one. Similar to the coherence, the bicoherence is bounded between 0 and 1. A bicoherence value of 1 means that a non-linear interac-tion creates the third peak (see Table 1). The bicoherence result is a two dimensional map with frequency axes in both directions. Therefore in the case of the CD airfoil noise, the bicoherence determines if the tones in the PSD are created by a single or sev-eral sources.
The acoustic signal is divided into time segments of 4096 points and 800 aver-ages are used to compute the bicoherence. The two dimensional maps are shown in Fig. 4 for each case. For the highest flow velocity [Fig. 4(c)], the bicoherence exhibits a maxima at 2577 Hz with a value of 0.6. This frequency corresponds to the second peak of the PSD of the microphone signal. However, no peak exists at twice this frequency maybe due to the high background noise or a weak non-linear interaction. For the lowest flow velocity [Fig. 4(a)], the maxima is found at the frequency of the primary tone 779 Hz and the bicoherence value at this frequency is 0.82. Therefore, the peak at twice this frequency (f¼2779¼1558 Hz) is created by a non-linear interaction of the primary tone. Moreover, a peak at 1681 Hz emerges from the PSD of the micro-phone signal with a low sound pressure level. The bicoherence shows that this peak is caused by the non-linear interaction of the primary tone at 779 Hz and the secondary tone at 904 Hz. Another interaction occurs between the primary tone at 779 Hz and the secondary tone at 653 Hz but no peak is visible in the PSD of the microphone sig-nal. This suggests that the sound pressure level of the secondary tone is too low which prevents the emergence of this peak from the background noise. The bicoherence of the unsteady case exhibits two main maxima with high values. These maxima corre-spond to the primary tones at 963 and 1120 Hz which alternately appear in the spec-trogram of the microphone signal. These primary tones interact to create the two peaks at 1928 and 2238 Hz. The peak at 1771 Hz is created by the interaction of the primary tone at 963 Hz and the secondary tone at 808 Hz.
7. Conclusion
A detailed acoustic study has been carried out on a CD airfoil in order to characterize its acoustic signature at low Reynolds numbers. Three different tonal noise regimes have been identified. The first one is characterized by a primary tone steady over the time associated with several secondary tones. The second one consists in two unsteady primary tones still associated with secondary tones, and the third one that appears for larger Reynolds number is a hump dominated by several small steady peaks. Overall, the frequency of the primary tone seems to follow Paterson’s law with respect to the
Fig. 4. (Color online) Bicoherence of the microphone signal on the pressure side. The flow velocity is set to (a)
flow velocity but with a different coefficient than the NACA0012. Moreover, the ladder-type structure described by Tam’s law fits with the experimental data well. A wavelet analysis has allowed the identification of an amplitude modulation of the acoustic signal mainly in the unsteady case. This amplitude modulation is equal to the frequency interval between two successive tones. Finally the presence of peaks at higher frequency has been associated with a non-linear interaction of the primary and secondary tones with the bicoherence of the microphone signal.
References and links
1
R. W. Paterson, P. G. Vogt, M. R. Fink, and C. L. Munch, “Vortex noise of isolated airfoils,”J. Aircraft 10(5), 296–302 (1973).
2
C. K. W. Tam, “Discrete tones of isolated airfoils,”J. Acoust. Soc. Am.55(6), 1173–1177 (1974). 3
H. Arbey and J. Bataille, “Noise generated by airfoils profiles placed in a uniform laminar flow,”J. Fluid Mech.134, 33–47 (1983).
4
E. C. Nash, M. V. Lowson, and A. McAlpine, “Boundary-layer instability noise on aerofoils,”J. Fluid Mech.382, 27–61 (1999).
5C. K. W. Tam and H. Ju, “Aerofoil tones at moderate Reynolds number,”J. Fluid Mech.
690, 536–570 (2012).
6G. Desquesnes, M. Terracol, and P. Sagaut, “Numerical investigation of the tone noise mechanism over laminar airfoils,”J. Fluid Mech.591, 155–182 (2007).
7S. Probsting, J. Serpieri, and F. Scarano, “Experimental investigation of aerofoil tonal noise generation,”
J. Fluid Mech.747, 656–687 (2014).
8S. Moreau, M. Henner, G. Iaccarino, M. Wang, and M. Roger, “Analysis of flow conditions in freejet experiments for studying airfoil self noise,”AIAA J.41(10), 1895–1905 (2003).
9M. Roger and S. Moreau, “Broadband self-noise from loaded fan blades,” AIAA J.
42(3), 536–544 (2004).
10S. Moreau and M. Roger, “Effect of airfoil aerodynamic loading on trailing edge noise source,”AIAA J.
43(1), 41–52 (2005).
11M. Wang, S. Moreau, G. Iaccarino, and M. Roger, “LES prediction of wall-pressure fluctuations and noise of a low-speed airfoil,”Int. J. Aeroacoust.8(3), 177–197 (2009).
12J. Christophe, S. Moreau, C. W. Hamman, J. A. S. Witteveen, and G. Iaccarino, “Uncertainty quantifi-cation for the trailing-edge noise of a controlled-diffusion airfoil,”AIAA J.53(1), 42–54 (2015).
13T. Padois, P. Laffay, A. Idier, and S. Moreau, “Detailed experimental investigation of the areoacoustic field around a controlled-diffusion airfoil,” in21th AIAA/CEAS Aeroacoustics Conference, Dallas, TX, 22–26 June, 2015.
14
T. P. Chong and P. Joseph, “Ladder structure in tonal noise generated by laminar flow around airfoil,” J. Acoust. Soc. Am.131(6), EL461–EL467 (2012).
15
P. Salas and S. Moreau, “Aeroacoustic simulations of a simplified high-lift device accounting for installa-tion effects,” in21th AIAA/CEAS Aeroacoustics Conference, Dallas, Texas, 22–26 June, 2015.
16
D. J. Moreau, L. A. Brooks, and C. J. Doolan, “On the aeroacoustic tonal noise generation mechanism of a sharp-edged plate,”J. Acoust. Soc. Am.129(4), EL154–EL160 (2011).
17
C. Torrence and G. Compo, “A practical guide to wavelet analysis,”Bull. Am. Meteorol. Soc.79, 61–78 (1998).