Contents lists available atScienceDirect
North American Journal of Economics
and Finance
journal homepage:www.elsevier.com/locate/najef
Affiliated block shareholders and analyst optimism
Shi Li
a, Chaopeng Wu
b, Shijie Yang
c,⁎aXiamen National Accounting Institute, Huandao South Road, Xiamen, Fujian 361005, China
bSchool of Management, Xiamen University, 422 Siming South Road, Xiamen, Fujian 361005, China
cSchool of Management and Economics, Chinese University of Hong Kong, Shenzhen, 2001 Longxiang Boulevard, Shenzhen, Guangdong 518172,
China
A R T I C L E I N F O Keywords:
Sell-side analyst optimism Conflicts of interest Block shareholder Affiliated mutual fund Earnings forecast bias Stock recommendations JEL classification: G14
G24
A B S T R A C T
We investigate several previously under-documented conflicts of interest that may result in analyst optimism by utilizing two unique features of brokerage firms in China, namely, the dominant ownership of large shareholders within the brokerage firms and the mandatory dis-closure of brokerage firms’ commission income derived from each mutual fund client. We show that controlling shareholders of an analyst’s brokerage-firm put pressure on the analyst to report more optimistically biased earnings forecasts and recommendations to the stocks they hold larger positions in. We also find that the magnitude of analyst optimism increases with the share-holdings of the mutual funds that contribute commission fees to the analyst’s brokerage firm. These findings remain robust after incorporating a regulation change that reduces conflicts of interest in the brokerage industry and higher dimensional fixed effects, and thus are unlikely to be driven by reverse causality or omitted variable bias.
1. Introduction
Financial analysts play an important information role in the equity markets. How well they play this role depends on whether their conflicts of interest are constrained. Analyst optimism, as documented as a common phenomenon due to conflicts of interest, has been empirically examined and theoretically discussed in prior literature. This strand of the literature provides several explanations for analyst optimism in stock recommendations and earnings forecasts. First, the preference of cultivating management relationship may encourage analysts to report optimistic earnings forecasts (e.g.,Francis & Philbrick, 1993; Das, Levine, & Sivaramakrishnan, 1998; Lim, 2001). Second, the incentives of favoring their investment bank’s client relations push the underwriter affiliated analysts to bias some reports (e.g.,Lin & McNichols, 1998; Michaely & Womack, 1999; Bessler & Stanzel, 2009). Third, the brokers’ objective of generating trading commissions also leads analysts to issue optimistic reports to attract orders from investors (e.g.,Hayes, 1998; Irvine, 2001; Jackson, 2005; Cowen, Groysberg, & Healy, 2006). Building on current literature, this paper extensively tests an additional explanation of analyst optimism, i.e., the affiliated block shareholders of listed companies press sell-side analysts to issue optimistic opinions to support their stock positions.
Specifically, in this study, we distinguish three types of affiliations between block shareholders of listed companies and sell-side analysts, as illustrated inFig. 1. First, the block shareholders of the covered companies are also the controlling shareholders of the analysts’ brokerage firms (Type I affiliation inFig. 1); second, the block shareholders are the analysts’ brokerage firms themselves (Type II affiliation inFig. 1); third, the block shareholders are those mutual funds that contribute commission fees to the analysts’ brokerage firms or pay sales commissions to them for marketing their fund shares (Type III affiliation inFig. 1).
https://doi.org/10.1016/j.najef.2019.101135
⁎Corresponding author.
E-mail addresses:[email protected](S. Li),[email protected](C. Wu),[email protected](S. Yang).
1062-9408/ © 2019 Elsevier Inc. All rights reserved.
Please cite this article as: Shi Li, Chaopeng Wu and Shijie Yang, North American Journal of Economics and Finance, https://doi.org/10.1016/j.najef.2019.101135
Unlike the U. S. that has well-developed financial markets, China, with an emerging equity market and analyst industry, presents a useful laboratory setting for this analysis for at least four reasons. First, the usual brokerage firms in the U. S. and most European countries do not have dominant shareholders because these firms have relatively long history and their ownership is fully diversified or diluted before IPOs. In contrast, the brokerage firms in China usually have a large shareholder that holds dominant ownership. The controlling shareholder of brokerage firms can also hold the listed stocks covered by their brokerage firms. This unique characteristic of Chinese brokerage firms greatly facilitates our investigation on whether the shareholders of brokerage firms could exert pressure on their analysts to issue favorable reports.
Second, a typical brokerage firm in China has both research department and investment department. Its investment department can hold the listed stocks covered by its own research department. Third, mutual funds in China could press sell-side analysts through generating trading commissions, sales commissions, or voting selection for “Annual New Fortune Best Analyst” which are directly linked to the income of the analysts. These unique features of affiliations in China are different from the U.S. stylized fact that documented inMola and Guidolin (2009), which arises from the ownership of brokerages firms in mutual funds. They show that analysts are likely to assign frequent and favorable ratings for the stocks held by funds that their brokerages have an ownership stake. Finally, one of the distinguishing characteristics of Chinese listed companies is the lack of transparency in financial statements (Claessens, Djankovand, & Lang, 2000; Fan & Wong, 2002). This makes it more likely that potential investors will rely upon analysts’ forecasts and strengthens the incentive of block shareholders to exert pressure on analysts. Moreover, relative weak of investor protection and riddled with insider trading, market manipulation (Allen, Qian, & Qian, 2005) in China’s stock market also facilitates block shareholders’ pressing on analysts due to lower litigation costs.
Given the aforementioned uniqueness in the institutional environment and financial markets in China, we investigate the impact of block shareholders on analyst optimism by utilizing a large sample of analysts’ earnings forecasts and stock recommendations in China. We begin with developing a theoretical model to investigate how financial analysts maximize their own benefits from cul-tivating various benefit-based relationships by releasing earnings forecasts. Our theoretical model proposes three hypotheses as followed. First, analysts are likely to release optimistically biased earnings forecasts and favorable stock recommendation on the stocks held by the controlling shareholders of the analysts’ brokerage-firm. Second, analysts are more likely to provide optimistic coverage on the stocks held by the investment department of their brokerage-firm. Third, analyst optimism is higher for those stocks heavily held by mutual fund companies that contribute commission fees to the analysts’ brokerage firm.
To test our hypotheses and corollaries, we collect a sample of 105,945 earnings forecasts and stock recommendations of 1,322 Chinese listed companies that made by 2,452 financial analysts from 124 security companies in the period between 2004 and 2015. Our empirical studies show that analysts release optimistically biased earnings forecasts and favorable stock recommendations for those stocks largely held by the controlling shareholders of the analysts’ brokerage firms. Moreover, the magnitude of analyst’s optimism increases with the shareholdings of the mutual funds that contribute commission fees to the analysts’ brokerage firm. Finally, analysts provide more optimistically biased earnings forecasts and stock recommendations for those stocks which their brokerages invest in or underwrote by their own investment banking departments.
Moreover, these main findings are obtained after controlling for the effects of reputational concern (i.e., being awarded “New Fortune Best Analyst” in China), institutional ownership, and underwriter relations, as well as other firm characteristics and firm and year fixed effects. Overall, we provide empirical evidence supporting our three main hypotheses. The conflicts of interest related to block shareholders indeed induce analyst optimism in earnings forecasts and stock recommendations.
To address the concern that our results are possibly driven by the endogeneity problem, we perform further robustness tests. First, we address the endogeneity problem by using a policy shock to the brokerage industry in China. The “One Control & One Participation” policy was adopted by China Securities Regulatory Commission (CSRC) in 2008, and implemented in 2009 and 2010. After this policy, the conflicts of interest in brokerage firms are reduced, and we predict that the effect of conflicts of interest on analyst optimism is weaker after 2010. Indeed, our results confirm this conjecture, suggesting that our results are driven by conflicts
Fig. 1.Three types of affiliations between block shareholders and sell-side analysts. In this figure, we show the interrelationship among sell-side
of interests due to block shareholders, instead of driven by the endogeneity problem.
Second, we further address the omitted variable bias by including high-dimensional fixed effects, in additional to firm and year fixed effects. Specifically, in a robustness check, we include industry-by-year fixed effects, industry-by-province-by-year fixed effects, or firm-by-year fixed effects in the regression model. All results are still similar to our main regression results with only Firm FE and Year FE, which help mitigates the concern that our findings are driven by the omitted variable bias.
This paper is related to existing research on conflicts of interest of financial analysts. Previous literature has shown that the incentives for analysts’ optimistic forecast include maintaining management relationship (e.g.,Francis & Philbrick, 1993; Das et al., 1998; Lim, 2001; Hodgkinson, 2001), supporting underwriting activities (e.g.,Lin & McNichols, 1998; Michaely & Womack, 1999; Kolasinski & Kothari, 2008; Bessler & Stanzel, 2009), obtaining sales and trading activities to fund research (Cheng, Liu, & Qian, 2006; Cowen et al., 2006; Dechow, Hutton, & Sloan, 2000; Irvine, 2001; Jackson, 2005) and career concerns (Hong & Kubik, 2003; Hong, Kubik, & Solomon, 2000).
More importantly, this study adds to our understanding on the effects of conflicts of interest on analyst optimism in China. Prior relevant studies have documented that analysts in China face the pressure from state shareholding (Huang & Wright, 2015) and generating trading commission fees from mutual funds (Firth, Lin, Liu, & Xuan, 2013; Gu, Li, & Yang, 2013), that social ties between financial analysts and mutual fund managers affect their information sharing and business decisions (Gu, Li, Yang, & Li, 2019), that the quality of earnings forecasts by analysts are affected related party sales of goods and services (Wang & Yuan, 2012), and that analyst optimism is positively related to crash risks (Xu, Jiang, Chan, & Yi, 2013). We contribute to this strand of the literature in two aspects. First, to our best knowledge, this study is one of the first papers to investigate how large shareholders of brokerage firms affect analyst optimism. Second, by utilizing a unique database which discloses the brokerage firms’ commission income derived from each mutual fund client, our paper also extends the existing literature on affiliated mutual fund and analyst optimism (e.g.,Mola & Guidolin, 2009; Gu et al., 2013). Furthermore, our study differs fromGu et al. (2013) and Firth et al. (2013) by analyzing the effects of fee affiliation on earnings forecast bias, while they look at the effects on stock recommendations.
The paper is organized as follows.Section 2develops the theoretical model and empirical hypotheses of conflicts of interest in analysts’ earnings forecast bias and stock recommendations.Section 3introduces the research design.Section 4reports the empirical results relating analysts’ brokerage’s interests, mutual fund shareholding and analysts’ reputation to forecast bias and stock re-commendations.Section 5addresses the endogeneity problems and related issues.Section 6concludes.
2. Theoretical model and empirical hypotheses
In this section, we develop a theoretical model to examine the impact of various conflicts of interest on financial analysts’ earnings forecasts. In the introduction, we review empirical evidence suggesting that analysts face three major conflicts of interest: (1) cur-rying favor with block shareholders, (2) maintaining and enhancing personal reputation, and (3) cultivating the relationship with investment banking department. In this regard, the objective of the analysts is to maximize their own benefits from cultivating various benefit-based relationships by releasing earnings forecasts. We thus construct the model for analysts’ earnings forecasts by incorporating these components of the conflict of interest in our theoretical design simultaneously. For the sake of brevity and highlighting our contribution, we only develop the theoretical model based on the interaction of the first two types of conflicts of interest (namely, maintaining the relationship with block shareholders and maintaining reputation). Our proposition and empirical hypothesis are unchanged if we generalize the model to include all three types of conflicts of interest.
2.1. Analyst’s value function
The analyst’s value function consists of three components of conflicts of interests. In periodt, the analyst releases earnings forecast to maximize his own total value,Valuet, which is formally constructed as the following objective function:
= +
Valuet V BSt( ) V Rept( ) (1)
where,V BSt( )denotes the value obtained from currying favor with block shareholders, andV Rept( )represents the value obtained
from maintaining and enhancing personal reputation. Eq.(1)indicates that the analyst’s decision is to maximize the total value by balancingV BSt( )andV Rept( ).
2.1.1. Value of currying favor with block shareholders
In this study, we investigate the block shareholders in three major parties, namely the brokerage firms themselves, the controlling shareholder of the brokerage firms and the affiliated mutual funds that contribute commission fees to the analyst’s brokerage firm (seeFig. 1). For the stocks with high shareholding from the block shareholders, there is an incentive for analysts to make optimistic earnings forecast to improve recognition of those institutions that hold the stocks. Therefore, the value of cultivating the relationship with block shareholders for the analyst can be represented as follows:
=
V BSt( ) kBS [(Xt X It) ]t (2)
Eq.(2)assumes that the analyst release the earnings forecast (Xt) after observing a noisy private signal (It) from actual earnings (Xt) by visiting companies, and contacting the management of companies, etc.kBSis a proportional constant, which is independent of It,Xt, andXt. The larger the optimistic bias of earnings forecast is, the higher the value analysts obtains from block shareholders, i.e.,
>
the larger the shareholding of block shareholders is, the greater the incremental value is obtained from the analyst’s positive forecast bias. The expectation ofV BSt( )is:
= =
E V BS[ (t )] E k[ BS [(Xt X It) ]]t kBS [Xt E X I( t t)] (3) We definebt=[Xt E X I( t t)], which is the forecast bias made by the analyst. Eq.(3)indicates that the expectation ofV BSt( )is
positively related tobt.
2.1.2. Value of analyst’s reputation improvement
In each period, the value of analyst’s reputation improvement is negatively proportional to the square of the earnings forecast bias. The objective of the analyst is to minimize the earnings forecast bias in order to improve the value of the analyst’s personal reputation. This relation can be represented by the following equation:
=
V Rept( ) kRep [(Xt Xt)2It] (4)
V Rept( )is the value of personal reputation obtained from the earnings forecast in periodt.kRepis a proportional constant that is independent ofIt, Xt, and Xt. The smaller the earnings forecast bias is, the higher the value analysts obtained from reputation improvement will be, i.e.,kRep>0. The expected value of improving reputation from the earnings forecast is:
= =
E V Rep[ (t )] E[ kRep [(Xt Xt)2It]] kRep E X[( t Xt)2It] (5) We then derive the following equation from Eq.(5):
= +
E V Rep[ (t )] kRep E X[( t E X I( t t))2 Var X I( t t)] (6)
whereE X I( t t)is an unbiased estimate ofXtunder the information setIt. Letbt=[Xt E X I( t t)], wherebtis the forecast bias made deliberately, not randomly. The biasbtis made according to the situation in periodt. Without loss of generality, we assume that b b0, ,1 ,bt 1, are independent of each other. This property will be used in the derivation of the subsequent equations.It is the information set used by analysts to forecast actual earningsXt in periodt.Itcan be represented as follows:
= +
It Xt t, t N 0, 1
t (7)
where t= t( , , ,b b0 1 bt 1)is the precision of the information that the analyst observes. The larger the value of t( , , ,b b0 1 bt 1), the
more precise the information is, and thus the smaller the random error term twill be. From the above discussion, we have:
= + = Var X I b b b b b b ( ) 0 1 ( , , , ) 1 ( , , , ) t t t 0 1 t 1 t 0 1 t 1 (8)
Note that t( , , ,b b0 1 bt 1)increases with the earnings forecast bias prior to periodt. This is because the analyst can establish better relationship with the company’s management team by producing a positively biased forecast. This company will offer him more precise private information about the company’s actual earnings in following periods. Hence:
> = > b b b b i t t ( , , , ) 0, 0, 1, , 1, 0 t t i 0 1 1 (9) Note that the improvement of management relationship by making designed forecast bias in the current periodtonly affects the precision of private information of the following periods. For any current or future periodk(k t), the forecast bias does not affect the precision of private information in the current period, which means t bk=0. Based on these assumptions, we substitute Eq.(8) into Eq.(6), and the analyst’s value function of personal reputation is derived as follows:
= +
E V Rep[ (t )] kRep bt 1 t 2
(10)
2.2. Analyst’s optimal decisions
Assume that the analyst will generate earnings forecasts in the next n periods. He must design the forecast biasbt=[Xt E X I( t t)] for each period0, 1, ,nin order to maximize the total value that he could obtain from the earnings forecasts:
= + = + + + = + + + = = = = =
Max E Total Value Max
r E Value Max r E V BS r E V Rep
Max k r b k r b [ ( )] 1 (1 ) ( ) 1 (1 ) [ ( )] 1 (1 ) [ ( )] · 1 (1 ) · · 1 (1 )· 1 t n t t t n t t t n t t BS t n t t Rep t n t t t 0 0 0 0 0 2 (11) In Eq.(13),ris the discount rate applied to the value obtained in the future periods.E Total Value( )is a concave function and the first-order condition for the maximization is E Total Value( ) bt=0(t=0, 1, , )n. Due to the fact thatb b0, ,1 ,bt 1are pairwise independent, we can take anyt=k to derive the general equation forbk. Now, given E Total Value( ) bt=0, we arrive at the
following equation, + + = = + k k b r b 2 (1 r) (1 )· 0 BS Rep k t k n t t k t 1 k 2 (12) which gives: = + + + = + b k k r r b 2 1 2 (1 ) (1 ) · k BS Rep t k n k t t k t 1 2 (13)
Hence, we have the following proposition:
Proposition:.Given that t bk 0(from Eq.(9)), ifkRepandkBSare non-negative at the same time fort>k, then the optimal forecast bias bkwill be positive and increasing inkBS.
2.3. Empirical hypotheses
2.3.1. Determinants of analysts’ earnings forecasts
2.3.1.1. Relationship with block shareholders. In our study, block shareholders include the brokerage firms themselves, the controlling shareholder of the brokerage firms and affiliated mutual funds that contribute commission fees to the analysts’ brokerage firm. The incentive to cultivate the relationship with these block shareholders will influence analysts’ forecast bias. In Eq.(13),kBSis the value obtained from block shareholders for a unit of earnings forecast bias.kBS is positively correlated with the shareholding of block shareholders. This is because analysts could gain greater value by releasing optimistically biased forecast of stock i if block shareholders’ shareholding is larger. As shown in Eq.(13),bkis positively correlated withkBS. Based on these arguments, we develop the first hypothesis as follows:
Hypothesis 1:.Analysts release more optimistically biased earnings forecast to the companies with larger percentage of shares held by affiliated block shareholders (i.e., the shareholdings by the brokerage firms themselves, the controlling shareholder of brokerage firms, and the affiliated mutual funds).
2.3.1.2. Analysts’ reputation. The research reports on listed companies released by the analysts with higher reputation have stronger market influence, thus management of listed companies also has the incentive to maintain the relationship with high-reputation analysts. From this perspective, the term t bkis smaller for high-reputation analysts. Moreover, Eq.(13)shows thatbkis decreasing inkRep, other things being equal. This means high-reputation analysts have larger concern about releasing positively biased forecast, comparing with obtaining value from currying favor with block shareholders. Collectively, for analysts with high reputation, earnings forecast biasbkis smaller. We propose that given other factors being held constant, high-reputation analysts make less optimistically biased earnings forecast than other analysts (Corollary 1).
We test Hypothesis 1 and control for the effect of Corollary 1 in our empirical model. 2.3.2. Determinants of analysts’ stock recommendations
In a similar fashion, the argument on how conflicts of interest affect analysts’ earnings forecast bias could be extended to the analysts’ stock recommendations. First, analysts’ stock recommendations could directly affect the investment returns of the block shareholders who are holding the stocks. Hence, to cultivate the relationship with block shareholders, analysts have incentive to issue more favorable stock recommendations. Accordingly, we propose the following hypothesis.
Hypothesis 2:.Analysts’ stock recommendations are more favorable for those companies with larger percentage of shares being held by affiliated block shareholders (i.e., the shareholders by brokerage firms themselves, the controlling shareholder of brokerage firms, and the affiliated mutual funds).
Meanwhile, analysts’ reputation could also affect their stock recommendations. There is less incentive for the analysts with higher prestige to curry favor with the management of listed companies by making favorable recommendations. Therefore, the analysts with higher reputation are less likely to report over-optimistic stock recommendations than other analysts (Corollary 2).
We test Hypothesis 2 and control for the effect of Corollary 2 in our empirical model. 3. Research design
3.1. Data
Our data for empirical analyses are obtained from two data sources: Wind Information Database (Wind) and Chinese Securities Market and Accounting Research Database (CSMAR). Both databases are standard data sources used in China studies, especially the studies on financial analysts in China (e.g.,Firth et al., 2013; Gu et al., 2013; Gu et al., 2019). We retrieve analysts’ earnings forecasts and stock recommendations from January 1, 2004 to December 31, 2015, and the shareholding data, commission fee data, and firm accounting data for the same sample period to construct the dependent and independent variables. We perform the analysis at the
analyst report level, and keep the observations with available data to calculate all dependent and independent variables. The final sample consists of 105,945 observations, including those earnings forecasts and stock recommendations made for 1,322 listed companies by 2,452 financial analysts from 124 brokerages firms.1
3.2. Empirical model and variable definitions
To testHypothesis 1, we construct a regression model to examine the impact of block shareholders, analysts’ reputation, un-derwriter affiliation on the optimistic bias of earnings forecasts. Our model is specified as follows:
= + + + + + +
+ + + + + + +
BIAS BROKERAGE BRO SHAREHOLDER AFFILIATE REPUTATION UNDERWRITER
HORIZON FOLLOWING SIZE STDROE ROE FirmFE YearFE
_
1 2 3 4 5 6
7 8 9 10 (14)
Following the definition inGu and Wu (2003), the optimistic bias of earnings forecasts (BIAS) is defined as the difference between the analyst’s earnings forecast and the actual earnings per share (EPS), divided by the stock price at the beginning of the fiscal year. We are also concerned that the EPS could be diluted because of releasing of stock dividends, stock splits, and seasoned equity offering, etc. Therefore, to make the actual EPS comparable with forecasted EPS, we adjust the actual EPS by multiplying it with the total share at reported date and then divided by the total shares at the forecast date.
The independent variables are defined as follows.BROKERAGEis the shareholding of the brokerage-firm on the stocks covered by their brokerage analysts.BRO_SHAREHOLDERis the shareholding of brokerage-firm’s controlling shareholders on the stocks covered by their brokerage analysts.AFFILIATEis the shareholding of the affiliated mutual funds on the stocks covered by the analysts whose brokerage firms receive commission revenue from those affiliated mutual funds.REPUTATIONis a dummy which equals one if the analyst has ever been awarded top 3 “New Fortune Best Analyst2” of a specific industry before the forecast date, and zero otherwise. UNDERWRITERis also a dummy which equals one if the analyst’s brokerage firm has ever been the lead underwriter for the com-pany’s initial public offering (IPO) or secondary equity offering (SEO) within two years prior to forecast date, and zero otherwise. In addition, we include a number of control variables based on previous research on the determinants of the earnings forecast bias. Previous studies suggest that the accuracy of analysts’ forecasts is positively correlated with the quantity of information released by the company (e.g.,Lang & Lundholm, 1996; Brown, 2001; Behn, Choi, & Kang, 2009). We use three variables to measure the quantity of public information released by listed companies: a)HORIZONis defined as the logarithm of one plus the number of calendar days between the analyst’s earnings forecast date and the corresponding announcement date of the annual reports. The shorter is the forecast horizon, the more public information will be available; b)FOLLOWINGis the logarithm of one plus the number of analysts releasing the earnings forecast in the same year for a given company. More analysts following a stock could indicate larger amount of public information and/or stronger competition among analysts; c)SIZE(firm size) is defined as the natural logarithm of the average market value of the covered firms at the beginning and the end of the year. We control for the firm size because the problem of information asymmetry is less serious for larger firms. We also control for the uncertainty in forecasting earnings. FollowingBehn et al. (2009), we add the earnings volatility (STDROE) as a control variable, which is calculated as the standard deviation of the company’s return on equity over the prior 5 years.Eames and Glover (2003)shows that forecast accuracy is negatively correlated with earnings level, so we use the return on equity (ROE) as the control variable for the earnings level. All the independent variables in the regression model are lagged by one-year to alleviate endogeneity problem. Finally, we include firm fixed effects and year fixed effects in the regression model.
To testHypothesis 2, we construct the following regression model to examine the influence of block shareholders, analyst re-putation, and underwriter affiliation on stock recommendations.
= + + + + + +
+ + + + + + +
RANK BROKERAGE BRO SHAREHOLDER AFFILIATE REPUTATION UNDERWRITER
HORIZON FOLLOWING SIZE STDROE ROE FirmFE YearFE
_
1 2 3 4 5 6
7 8 9 10 (15)
whereRANKis the recommendation issued by the analyst when he gives earnings forecasts. The stock recommendation ranks from 1 to 5: 1-strong buy recommendation, 2-buy recommendation, 3-hold recommendation, 4-sell recommendation, and 5-strong sell recommendation. A lower rank means more favorable recommendation. To better capture the optimism in issuing stock re-commendations, in a robustness check, we replaceRANKwithAdj. RANK, which is defined asRANKminus the consensus stock recommendation (the averageRANKof the company under review over the year). The definitions of other variables are the same as those in Model(14).
1105,945 observations represent the same number of analyst reports. Each report contains one stock recommendation and earnings forecast for at least one year. If a report issues more than one year of earnings forecast, we calculate the average forecast bias in this report to construct our dependent variable.
2“New Fortune Best Analyst” is awarded to star analysts in China annually since 2003 by New Fortune Magazine published by Shenzhen Stock Exchange. For each of the 32 industries, “New Fortune Best Analyst” is elected by institutional voters including public fund, insurance companies, the National Social Security Fund Council, securities companies, qualified foreign institutional investor (QFII), banks, private equity companies, trust companies, finance companies and overseas investment institutions.
4. Empirical results
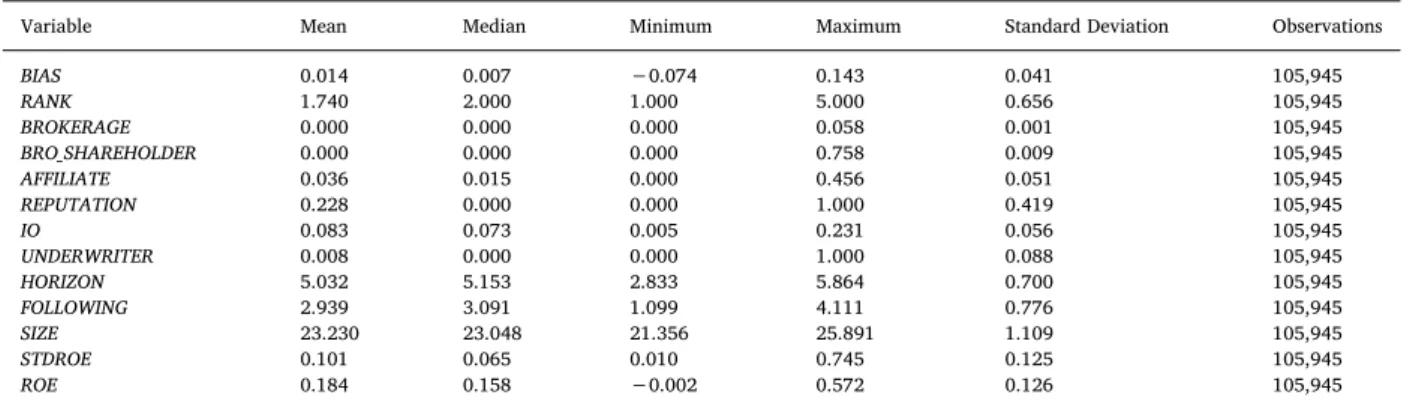
4.1. Summary statistics and correlation analysis
Table 1presents the summary statistics for the dependent and independent variables in Models(14) and (15). We winsorize all continuous variables (except shareholding measures, which are bounded between 0 and 1) at the 2nd and 98th percentiles to mitigate the influence of outliers. The positive mean value (0.014) ofBIASsuggests that analysts exhibit optimistic bias in earnings forecasts on average in China. The mean value of stock recommendations (RANK) is 1.740, indicating that the average recommendation is favorable to the “buy” side. There are two potential explanations for this result: first, analysts tend to make optimistic re-commendations, and second, analysts are more likely to cover high-quality stocks.
Table 2reports the matrix of Pearson and Spearman correlations. We find that optimistic bias of earnings forecast (BIAS) is either insignificantly or negatively related toBROKERAGE,BRO_SHAREHOLDER, andAFFILIATE, while stock recommendations (RANK) is significantly negatively related toBROKERAGE,BRO_SHAREHOLDER, andAFFILIATE. Given that the correlation matrix does not take into account the other factors that affect both analyst optimism and block shareholdings, the correlation coefficients do not precisely reflect the effects of block shareholdings on analyst optimism. Therefore, we move on to perform the multivariate regression analysis based on Models (15) and (16).
4.2. Determinants of earnings forecast bias
We use Model (15) to examine the determinants of earnings forecast bias. The OLS regression results are presented inTable 3. The significantly positive estimated coefficient of brokerage-firm shareholding (BROKERAGE) in Column (1) indicates that the larger is the shareholding of brokerage-firm on a stock, the more optimistic earnings forecasts from the analysts of the brokerage-firm will be. On average, one-percentage increase in brokerage-firm shareholding leads to 0.23% increase in forecast bias, withp-value < 0.10. Translated to economic significance, this change is about 16.4% of the sample mean ofBIAS. In Column (2), the coefficient of shareholding of brokerage-firm’s controlling shareholder on the stocks covered by their brokerage analysts (BRO_SHAREHOLDER) is significantly positive (p-value < 0.05). One-percentage increase in the shareholding of brokerage firm leads to 0.023% increase in forecast bias. In Column (3), affiliated mutual fund shareholding (AFFILIATE) also has a positive and significant impact on analysts’ earnings forecasts (p-value < 0.01). On average, one-percentage increase in affiliated mutual fund shareholding results in a 0.007% increase in analysts’ forecast bias. Collectively, the results in Columns (1) to (3) are consistent withHypothesis 1that sell-side analysts make optimistically biased forecasts to a stock if their brokerage firms, controlling shareholder of their brokerage firms, or affiliated mutual fund invest in that particular stock.
The insignificant estimated coefficient of the analysts’ reputation (REPUTATION) in Column (4) suggests that there is no sig-nificant difference in the earnings forecasts between “New Fortune Best Analysts” and non-“New Fortune Best Analysts”. We further examine whether “New Fortune Best Analysts” are more likely to report optimistic earnings forecasts to the stocks heavily held by institutional investors who participate the voting of “New Fortune Best Analyst” award. To test the conjecture, we add into the model the institutional investor shareholdings (IO) and its interaction term with analyst reputation (REPUTATION). We find the coefficient of the interaction term is negative but statistically insignificant. Therefore, the results do not support our conjecture in Corollary 1. In Column (6), the estimated coefficient of lead underwriter analyst dummy (UNDERWRITER) is positive and significant at the 5% level, which suggests that underwriter analysts are more optimistic than non-underwriter analysts when forecasting the same company. The result is consistent with the findings of previous studies (Lin & McNichols, 1998). To eliminate the suspicion that those variables we examine in Columns (1) to (6) may capture similar effects, we put all these variables into the regression models in Column (7). Our Table 1
Summary Statistics.
Variable Mean Median Minimum Maximum Standard Deviation Observations
BIAS 0.014 0.007 −0.074 0.143 0.041 105,945 RANK 1.740 2.000 1.000 5.000 0.656 105,945 BROKERAGE 0.000 0.000 0.000 0.058 0.001 105,945 BRO_SHAREHOLDER 0.000 0.000 0.000 0.758 0.009 105,945 AFFILIATE 0.036 0.015 0.000 0.456 0.051 105,945 REPUTATION 0.228 0.000 0.000 1.000 0.419 105,945 IO 0.083 0.073 0.005 0.231 0.056 105,945 UNDERWRITER 0.008 0.000 0.000 1.000 0.088 105,945 HORIZON 5.032 5.153 2.833 5.864 0.700 105,945 FOLLOWING 2.939 3.091 1.099 4.111 0.776 105,945 SIZE 23.230 23.048 21.356 25.891 1.109 105,945 STDROE 0.101 0.065 0.010 0.745 0.125 105,945 ROE 0.184 0.158 −0.002 0.572 0.126 105,945
This table reports the descriptive statistics for the dependent and independent variables used in our regression models. To mitigate outliers, all continuous variables (except shareholding measures, which are bounded between 0 and 1) are winsorized at the 2nd and 98th percentiles. Please refer to Appendix for variable definitions.
Table 2 Correlation Matrix. (1) (2) (3) (4) (5) (6) (7) (8) (9) (10) (11) (12) (13) (1) BIAS 1 −0.054 a −0.027 a −0.007 c −0.014 a 0.002 −0.061 a −0.004 0.073 a −0.079 a −0.041 a 0.118 a −0.025 a (2) RANK −0.044 a 1 −0.078 a −0.005 −0.186 a −0.027 a −0.063 a −0.005 0.010 b −0.127 a −0.057 a −0.007 c −0.120 a (3) BROKERAGE −0.006 −0.032 a 1 −0.004 0.189 a 0.052 a 0.029 a 0.013 a 0.010 b 0.144 a 0.139 a −0.003 0.078 a (4) BRO_SHAREHOLDER 0.001 −0.005 −0.002 1 0.008 c 0 −0.025 a −0.003 0.004 0.016 a 0.032 a −0.001 −0.012 a (5) AFFILIATE −0.040 a −0.144 a 0.083 a 0.001 1 0.170 a 0.337 a 0.027 a 0.014 a 0.284 a 0.151 a 0.012 a 0.218 a (6) REPUTATION −0.002 −0.035 a 0.017 a 0.007 c 0.171 a 1 −0.032 a 0.045 a 0.033 a 0.033 a 0.018 a 0.002 −0.029 a (7) IO −0.064 a −0.054 a 0.041 a −0.019 a 0.400 a −0.031 a 1 0.013 a 0.007 c 0.120 a −0.121 a −0.067 a 0.252 a (8) UNDERWRITER −0.006 c −0.006 −0.002 −0.003 0.028 a 0.045 a 0.014 a 1 0.001 0.024 a 0.035 a 0.015 a 0.018 a (9) HORIZON 0.080 a 0.022 a 0.001 0.003 0.014 a 0.033 a 0.001 0.001 1 0.040 a 0.018 a 0.014 a 0.021 a (10) FOLLOWING −0.057 a −0.132 a 0.015 a 0.007 c 0.250 a 0.044 a 0.119 a 0.020 a 0.052 a 1 0.610 a 0.090 a 0.339 a (11) SIZE −0.042 a −0.052 a −0.014 a 0.027 a 0.068 a 0.009 b −0.152 a 0.037 a 0.029 a 0.591 a 1 0.198 a 0.320 a (12) STDROE 0.104 a 0.015 a −0.017 a 0 −0.061 a 0.009 b −0.056 a 0.010 a 0.006 c −0.020 a 0.098 a 1 0.256 a (13) ROE 0.003 −0.109 a 0.001 −0.013 a 0.209 a −0.028 a 0.174 a 0.015 a 0.019 a 0.281 a 0.306 a 0.282 a 1 This table presents the pair wise correlations on the variables used in our regression models. Pearson's relation coefficients are reported in the lower-left triangle, and Spearman's relation coefficients are reported in the upper-right triangle. a, b,and cindicate that the correlation coefficient is statistically significant at the 1-, 5-, and 10-percent levels, respectively.
main results still hold. In all columns, we include firm fixed effects that allow us to control for the constant average forecast bias of each firm, making each firm comparable in the OLS regression model. Therefore, our results are unlikely driven by the different average forecast bias levels in different companies. To better alleviate the omitted variable bias, we further include more fixed effects in the robustness checks inSection 5.2.
4.3. Determinants of stock recommendations
Panel A ofTable 4reports the results from OLS regression of Model (16). Columns (1) to (3) show that the estimated coefficients of the brokerage-firm shareholding (BROKERAGE), the shareholding of brokerage-firm’s controlling shareholder (BRO_SHAREHOL-DER) and the affiliated mutual fund shareholding (AFFILIATE) are all negative and statistically significant at 1% level. These results support the prediction ofHypothesis 2. On average, sell-side analysts assign more favorable recommendations to the stocks in which their brokerage firms, the controlling shareholders of their brokerage-firm or their affiliated mutual funds hold larger positions.
The results in Column (4) ofTable 4show that the coefficient of analysts’ reputation (REPUTATION) is insignificant, suggesting that the recommendations made by “New Fortune Best Analysts” are not significantly different from non-“New Fortune Best Ana-lysts”, which is inconsistent with Corollary 2. To further test this argument, we also add the interaction term between the institutional investor shareholdings (IO) and the analyst reputation (REPUTATION) into the models. The interaction term is shown to be positive in Column (5). It suggests that “New Fortune Best Analysts” are less likely to assign favorable ratings than other analysts when in-stitutional investors holding larger position in the stock, which is inconsistent with Corollary 2. In Column (6), the negative coef-ficient onUNDERWRITERindicates that the lead underwriter analyst’s recommendations to their client stocks are more favorable than those of the unaffiliated counterpart. To rule out the possibility that these variables we test in Columns (1) to (6) are capturing similar effects, we put all these variables into the same regression model in Column (7). Our findings in Columns (1) to (6) still hold in Column (7). Again, in all columns, we include firm fixed effects that allow us to control for the constant average stock re-commendation of each firm, making each firm comparable in the OLS regression model. Therefore, our results are unlikely driven by the different average stock recommendation levels in different companies. To better alleviate the omitted variable bias, we further Table 3
The Effect of Conflicts of Interest on Earnings Forecast Bias.
(1) (2) (3) (4) (5) (6) (7)
BIAS BIAS BIAS BIAS BIAS BIAS BIAS
BROKERAGE 0.232** 0.206* (1.97) (1.75) BRO_SHAREHOLDER 0.023** 0.023** (2.16) (2.16) AFFILIATE 0.007*** 0.008*** (3.20) (3.84) REPUTATION 0.000 0.001* 0.001* (1.05) (1.76) (1.66) REPUTATION×IO −0.006 −0.008** (−1.43) (−1.97) IO −0.008*** −0.010*** (−2.82) (−3.42) UNDERWRITER 0.002** 0.002** (2.15) (2.12) HORIZON 0.003*** 0.003*** 0.003*** 0.003*** 0.003*** 0.003*** 0.003*** (25.70) (25.69) (25.68) (25.65) (25.68) (25.70) (25.69) FOLLOWING 0.003*** 0.003*** 0.003*** 0.003*** 0.003*** 0.003*** 0.003*** (10.98) (10.99) (10.77) (10.96) (11.31) (11.00) (11.20) SIZE 0.020*** 0.020*** 0.020*** 0.020*** 0.020*** 0.020*** 0.020*** (56.92) (56.94) (56.56) (56.94) (56.96) (56.89) (56.48) STDROE 0.000 0.000 0.001 0.000 −0.000 0.000 −0.000 (0.13) (0.14) (0.31) (0.12) (−0.25) (0.15) (−0.08) ROE 0.042*** 0.042*** 0.042*** 0.042*** 0.043*** 0.042*** 0.043*** (36.84) (36.86) (36.50) (36.85) (36.97) (36.79) (36.70) Constant −0.475*** −0.475*** −0.474*** −0.476*** −0.476*** −0.475*** −0.473*** (−62.01) (−62.02) (−61.62) (−62.02) (−61.96) (−61.98) (−61.45)
Firm FE YES YES YES YES YES YES YES
Year FE YES YES YES YES YES YES YES
Observations 105,945 105,945 105,945 105,945 105,945 105,945 105,945
Adjusted R2 0.513 0.513 0.513 0.513 0.513 0.513 0.513
This table reports the regression results on the effect of conflicts of interest on earnings forecast bias. The dependent variable isBIAS, which is the difference between earnings per share (EPS) forecasted by analysts and actual EPS, divided by the stock price at the beginning of the forecast year, adjusted for the effects of changes in numbers of shares. Please refer to Appendix for the definitions of independent variables. Firm and year fixed effects are included in all columns.t-statistics are reported in parentheses. ***, **, and * denote that the coefficient is statistically significant at the 1%, 5%, and 10% levels, respectively.
Table 4
The Effect of Conflicts of Interest on Stock Recommendations. Panel A: The effect on the raw stock recommendation (RANK)
(1) (2) (3) (4) (5) (6) (7)
RANK RANK RANK RANK RANK RANK RANK
(1) (2) (3) (4) (5) (6) (7) BROKERAGE −20.457*** −16.710*** (−8.24) (−6.74) BRO_SHAREHOLDER −0.716*** −0.605*** (−3.25) (−2.75) AFFILIATE −1.238*** −1.185*** (−28.22) (−25.61) REPUTATION 0.001 0.012 0.016* (0.14) (1.43) (1.92) REPUTATION×IO −0.139* 0.147* (−1.70) (1.79) IO −0.944*** −0.692*** (−15.44) (−11.21) UNDERWRITER −0.041* −0.028 (−1.91) (−1.27) HORIZON 0.018*** 0.018*** 0.018*** 0.018*** 0.018*** 0.018*** 0.018*** (6.54) (6.54) (6.71) (6.52) (6.65) (6.53) (6.60) FOLLOWING −0.012** −0.012** −0.002 −0.012** 0.001 −0.012** 0.005 (−2.10) (−2.11) (−0.37) (−2.10) (0.14) (−2.11) (0.96) SIZE 0.017** 0.016** 0.031*** 0.016** 0.017** 0.016** 0.031*** (2.27) (2.23) (4.27) (2.24) (2.33) (2.27) (4.28) STDROE 0.359*** 0.359*** 0.303*** 0.359*** 0.297*** 0.359*** 0.262*** (9.99) (10.00) (8.46) (10.01) (8.24) (9.99) (7.30) ROE −0.487*** −0.487*** −0.436*** −0.487*** −0.433*** −0.486*** −0.401*** (−20.06) (−20.07) (−17.97) (−20.05) (−17.69) (−20.01) (−16.42) Constant 1.357*** 1.363*** 1.029*** 1.360*** 1.382*** 1.356*** 1.055*** (8.40) (8.44) (6.37) (8.41) (8.55) (8.39) (6.53)
Firm FE YES YES YES YES YES YES YES
Year FE YES YES YES YES YES YES YES
Observations 105,945 105,945 105,945 105,945 105,945 105,945 105,945
Adjusted R2 0.157 0.157 0.163 0.157 0.159 0.157 0.165
Panel B: The effect on the consensus-adjusted stock recommendation (Adj. RANK)
Adj. RANK Adj. RANK Adj. RANK Adj. RANK Adj. RANK Adj. RANK Adj. RANK
BROKERAGE −19.896*** −17.333*** (−8.75) (−7.62) BRO_SHAREHOLDER −0.623*** −0.573*** (−3.08) (−2.84) AFFILIATE −0.739*** −0.771*** (−18.34) (−18.14) REPUTATION −0.009** 0.001 0.003 (−2.02) (0.12) (0.44) REPUTATION × IO −0.115 0.073 (−1.54) (0.97) IO 0.022 0.185*** (0.40) (3.27) UNDERWRITER −0.006 0.001 (−0.31) (0.07) HORIZON 0.011*** 0.011*** 0.012*** 0.012*** 0.012*** 0.011*** 0.011*** (4.61) (4.60) (4.71) (4.66) (4.67) (4.60) (4.63) FOLLOWING −0.001 −0.001 0.005 −0.001 −0.001 −0.001 0.002 (−0.22) (−0.24) (0.90) (−0.18) (−0.19) (−0.22) (0.40) SIZE 0.000 0.000 0.009 −0.000 0.000 0.000 0.010 (0.07) (0.03) (1.35) (−0.01) (0.06) (0.04) (1.43) STDROE −0.001 −0.000 −0.034 0.001 −0.001 −0.000 −0.023 (−0.02) (−0.01) (−1.02) (0.02) (−0.02) (−0.00) (−0.70) ROE −0.002 −0.002 0.029 −0.002 −0.002 −0.002 0.018 (−0.08) (−0.10) (1.29) (−0.08) (−0.08) (−0.07) (0.82) Constant −0.063 −0.057 −0.257* −0.052 −0.064 −0.060 −0.275* (−0.43) (−0.39) (−1.74) (−0.35) (−0.43) (−0.40) (−1.85)
Firm FE YES YES YES YES YES YES YES
Year FE YES YES YES YES YES YES YES
include more fixed effects in the robustness checks inSection 5.2.
Since theRANKmeasure might not directly reflect the degree of analyst optimism, but more about firm quality, we use another measure to better capture the optimism in issuing stock recommendation3. In Panel B ofTable 4, we replaceRANKwithAdj. RANK, which is defined asRANKminus the consensus stock recommendation (the averageRANKof the company under review over the year). After usingAdj. RANKas the dependent variable, the coefficients on the brokerage-firm shareholding (BROKERAGE), the shareholding of brokerage-firm’s controlling shareholder (BRO_SHAREHOLDER), and the affiliated mutual fund shareholding (AFF-ILIATE) are still negative and statistically significant at 1% level. Therefore, our findings are robust to this alternative measure of stock recommendation.
5. Addressing the endogeneity problem
Our findings could be influenced by the endogeneity problem, because analyst optimism and block shareholdings are endogenous variables. First, our results could be driven by reverse causality. Upward biased earnings forecasts and stock recommendations could attract more shareholdings, increase the chances that the covered stock is invested by brokerage firms themselves, the controlling shareholder of brokerage firms, and the affiliated mutual funds. In this case, the observed effect is not driven by conflicts of interest but reverse causality. Second, the observed results could be driven by omitted variable bias. Unobserved firm fundamentals, industry-level policy and economic shocks, and local regulation and economic shocks, are likely to affect both analyst optimism and block shareholdings. For instance, when a company experiences a favorable industry policy, analysts might over-react to such policy shock by issuing favorable earnings forecasts and stock recommendations, while financial institutions could be required by the government to support the companies in this industry through holding more shares. Such a spurious correlation could drive the observed results. In our main regression, we have already lagged the independent variables by one period to alleviate the reverse causality, and included firm fixed effects and year fixed effects to mitigate the omitted variable bias. Nevertheless, in this section, we further address the endogeneity concern by using a regulation change in the brokerage industry in China and include more fixed effects in the regression model.
5.1. The regulation change of “One Control & One Participation” policy
The “One Control & One Participation” policy was adopted by China Securities Regulatory Commission (CSRC) in March 2008, and implemented in 2009 and 2010, to reduce the conflicts of interest among brokerage firms, their controlling shareholders and the listed companies. Under this policy, one institution can only be the shareholders of at most two brokerage firms, among which the institution can only be the controlling shareholder of one brokerage firm. All Chinese brokerage firms need to meet this requirement by December 31, 2010. By constraining the controlling shareholders, the purpose of this regulation change is to improve the gov-ernance structure of brokerage firms and reduce conflicts of interest. We predict that the effect of conflicts of interest on analyst optimism should become weaker after 2010.
InTable 5, we include a dummy variablePOST_2010, which equals one if the year is after 2010, and its interaction terms with the measures of block shareholdings that captures the degree of conflicts of interest (the dummy variablePOST_2010itself is subsumed by the year fixed effects). The results on the block shareholdings (i.e.,BROKERAGE,BRO_SHAREHOLDER, andAFFILIATE) are still the same as those in Tables 3 and 4. More importantly, the interaction terms (i.e., BROKERAGE× POST_2010, BRO_SHAREHOL-DER × POST_2010, andAFFILIATE × POST_2010) have negative coefficients in Column (1) ofTable 5, suggesting that the effects of affiliated block shareholders on analyst’s optimistic earnings forecasts are weakened after the regulation change. Furthermore, in Column (2) ofTable 5, we also observe a positive coefficient onBROKERAGE×POST_2010, although the coefficients are insig-nificant onBRO_SHAREHOLDER × POST_2010andAFFILIATE × POST_2010. These results at least partly support the notion that the
Table 4(continued)
Panel A: The effect on the raw stock recommendation (RANK)
(1) (2) (3) (4) (5) (6) (7)
RANK RANK RANK RANK RANK RANK RANK
(1) (2) (3) (4) (5) (6) (7)
Observations 105,945 105,945 105,945 105,945 105,945 105,945 105,945
Adjusted R2 −0.011 −0.012 −0.009 −0.012 −0.012 −0.012 −0.008
This table reports the regression results on the effect of conflicts of interest on stock recommendation. In Panel A, the dependent variable isRANK, which equals 1 if it is a “strong buy”, 2 if “buy”, 3 if “hold”, 4 if “sell”, and 5 if “strong sell” recommendation, respectively. In Panel B, the dependent variable isAdj RANK, which isRANKminus the consensus stock recommendation, defined as the averageRANKof the target company over the year. Please refer to Appendix for the definitions of independent variables. Firm and year fixed effects are included in all columns.t-statistics are reported in parentheses. ***, **, and * denote that the coefficient is statistically significant at the 1%, 5%, and 10% levels, respectively.
observed effect of affiliated block shareholders on analyst’s optimism is driven by the conflicts of interest, instead of driven by the endogeneity problem.
5.2. Including high-dimensional fixed effects
InTable 6, we further address the omitted variable bias by including high-dimensional fixed effects, in additional to firm and year fixed effects. Specifically, in Columns (1) and (4) ofTable 6, we include industry-by-year fixed effects (Industry × Year FE) to account for the industry-level economic and/or policy shocks that are correlated with firm fundamentals and analyst optimism but are omitted from the regression model.4 In Columns (2) and (5) of Table 6, we include industry-by-province-by-year fixed effects
Table 5
Addressing the Endogeneity: The Effect of Brokerage Regulation Change.
(1) (2) BIAS RANK BROKERAGE 1.104*** −54.689*** (3.33) (−7.87) BRO_SHAREHOLDER 0.100*** −1.221*** (4.84) (−2.80) AFFILIATE 0.018*** −1.143*** (5.54) (−17.03) BROKERAGE×POST_2010 −1.018*** 43.496*** (−2.87) (5.85) BRO_SHAREHOLDER×POST_2010 −0.105*** 0.825 (−4.36) (1.64) AFFILIATE×POST_2010 −0.016*** −0.057 (−4.11) (−0.70) REPUTATION 0.001* 0.016* (1.66) (1.95) REPUTATION×IO −0.008** 0.155* (−2.04) (1.88) IO −0.011*** −0.698*** (−3.58) (−11.29) UNDERWRITER 0.002** −0.027 (2.03) (−1.25) HORIZON 0.003*** 0.018*** (25.71) (6.59) FOLLOWING 0.003*** 0.006 (11.16) (0.98) SIZE 0.020*** 0.032*** (56.54) (4.38) STDROE −0.000 0.263*** (−0.26) (7.31) ROE 0.043*** −0.402*** (36.78) (−16.47) Constant −0.476*** 1.035*** (−61.49) (6.37)
Firm FE YES YES
Year FE YES YES
Observations 105,945 105,945
Adjusted R2 0.514 0.165
This table presents the regression results on the effect of brokerage regulation change of 2008 on earnings forecast bias and stock recommendation. The “One Control & One Participation” policy was adopted by China Securities Regulatory Commission in 2008, and implemented in 2009 and 2010. We include a dummy variable
POST_2010, which equals one if the year is after 2010, and its interaction terms with the measures of conflicts
of interest. The dummy variablePOST_2010is subsumed by the year fixed effects. In Column (1), the de-pendent variable isBIAS, which is the difference between earnings per share (EPS) forecasted by analysts and actual EPS, divided by the stock price at the beginning of the forecast year, adjusted for the effects of changes in numbers of shares. In Column (2), the dependent variable isRANK, which equals 1 if it is a “strong buy”, 2 if “buy”, 3 if “hold”, 4 if “sell”, and 5 if “strong sell” recommendation, respectively. Please refer to Appendix for the definitions of independent variables. Firm and year fixed effects are included in all columns.t-statistics are reported in parentheses. ***, **, and * denote that the coefficient is statistically significant at the 1%, 5%, and 10% levels, respectively.
4The definition of industry is based on industry classification of China Securities Regulatory Commission (CSRC). We use two-digit Industry Code for manufacturing industry and one-digit Industry Code for the other industries. This process generates a total of 21 industries.
(Industry × Province × Year FE) to control for the industry-level economic and/or policy shocks in each province in each year to further mitigate the omitted variable bias. In Columns (3) and (6) ofTable 6, we include firm-by-year fixed effects (Firm × Year FE) to control for time-varying firm fundamentals, meaning that we compare the analyst optimism among analysts who cover the same firm in the same year. Note that including Firm × Year FE itself has automatically controlled for the Industry × Year FE and Industry × Province × Year FE, making it the strongest FE inTable 6. All results inTable 6are still similar to our main regression results with only Firm FE and Year FE. Our empirical analysis inTable 6lends support to our main finding by mitigating the omitted variable bias.
6. Conclusion
No matter in the well-developed stock markets with strict regulations or in the emerging stock markets, the independence and objectivity of analyst reports are widely questioned. In this study, we investigate two types of previously under-documented conflicts of interest which may result in positively biased earnings forecasts and stock recommendations. First, we find that analysts give optimistically biased earnings forecasts and recommendations to the stocks that the controlling shareholders of the analysts’ brokerage-firm already hold large positions in their portfolios. Second, analysts are more likely to issue optimistically biased opinions on the stocks held by the analysts’ brokerage firms. Finally, using a unique database which discloses the brokerage firms’ commission revenue derived from each mutual fund client, we also show that the mutual funds that contribute commission fees to the analysts’ brokerage could press the analysts to report more favorable earnings forecasts and stock recommendations to the stock they held. These findings are robust to the tests that address the endogeneity problem.
Table 6
Addressing the Endogeneity: Including High-dimensional Fixed Effects.
(2) (3) (4) (6) (7) (8)
BIAS BIAS BIAS RANK RANK RANK
BROKERAGE 0.196* 0.209** 0.196** −17.444*** −15.537*** −19.684*** (1.73) (2.15) (2.41) (−7.07) (−6.32) (−7.84) BRO_SHAREHOLDER 0.026*** 0.028*** 0.014* −0.651*** −0.654*** −0.682*** (2.61) (3.26) (1.94) (−2.98) (−3.02) (−3.06) AFFILIATE 0.013*** 0.021*** 0.024*** −1.136*** −1.016*** −0.946*** (6.00) (10.93) (15.62) (−24.45) (−21.37) (−19.57) REPUTATION 0.000 −0.001* −0.000 0.006 −0.003 0.004 (0.77) (−1.83) (−0.61) (0.80) (−0.33) (0.45) REPUTATION×IO −0.007* −0.003 −0.004 0.187** 0.217*** 0.115 (−1.83) (−0.78) (−1.63) (2.28) (2.61) (1.38) IO −0.002 −0.020*** −0.617*** −0.840*** (−0.71) (−6.02) (−9.67) (−9.94) UNDERWRITER 0.003*** 0.004*** 0.002** −0.024 −0.003 0.006 (3.49) (4.96) (2.53) (−1.10) (−0.16) (0.25) HORIZON 0.003*** 0.003*** 0.002*** 0.017*** 0.016*** 0.012*** (25.31) (24.61) (22.91) (6.34) (6.01) (4.70) FOLLOWING 0.003*** 0.002*** −0.013** −0.018** (9.62) (6.49) (−2.09) (−2.17) SIZE 0.020*** 0.020*** 0.061*** 0.038*** (53.10) (41.22) (7.28) (3.14) STDROE 0.004** −0.005** 0.178*** 0.231*** (2.37) (−2.47) (4.70) (4.20) ROE 0.043*** 0.054*** −0.396*** −0.395*** (36.16) (36.76) (−15.15) (−10.63) Constant −0.488*** −0.472*** 0.003*** 0.429** 0.983*** 1.706*** (−57.59) (−44.14) (7.15) (2.32) (3.64) (125.67)
Firm FE YES YES YES YES YES YES
Industry × Year FE YES YES
Industry × Province × Year FE YES YES
Firm × Year FE YES YES
Observations 105,945 105,945 105,945 105,945 105,945 105,945
Adjusted R2 0.556 0.686 0.802 0.176 0.215 0.255
This table reports the regression results on the effect of conflicts of interest on earnings forecast bias and stock recommendation after controlling for high-dimensional fixed effects. In Columns (1) through (3), the dependent variable isBIAS, which is the difference between earnings per share (EPS) forecasted by analysts and actual EPS, divided by the stock price at the beginning of the forecast year, adjusted for the effects of changes in numbers of shares. In Columns (4) through (6), the dependent variable isRANK, which equals 1 if it is a “strong buy”, 2 if “buy”, 3 if “hold”, 4 if “sell”, and 5 if “strong sell” recommendation, respectively. Please refer to Appendix for the definitions of independent variables. Industry × Year FE stands for industry-by-year fixed effects. Industry × Province × Year FE stands for industry-by-province-by-year fixed effects. Firm × Year FE stands for firm-by-year fixed effects.t-statistics are reported in parentheses. ***, **, and * denote that the coefficient is statistically significant at the 1%, 5%, and 10% levels, respectively.
Overall, our results suggest that the pressure from the controlling shareholders of brokerage firms and the business relations between brokerage firms and mutual funds can be the important sources of conflicts of interest that might impede an analyst’s ability to perform the functions as an objective intermediary for information within the financial system.
Research funding
This work was supported by the National Natural Science Foundation of China (Grant 71402156, 71722012, 71272082, 71790600, 71790601), XNAI Research Fund, Key Research Projects of Philosophy and Social Sciences of the Ministry of Education (15JZD019) and the New Century Excellent Talents Supporting Project by Ministry of Education of China.
Declarations of Competing Interest
The authors declare that they have no known competing financial interests or personal relationships that could have appeared to influence the work reported in this paper.
Appendix Variable definitions
Variable Definition Dependent variables
BIAS The difference between the analyst’s earnings forecast and the actual earnings per share (EPS), divided by the stock price at the beginning of the fiscal year. To account for the effects of stock dividends, stock splits, and seasoned equity offering on the number of shares, we adjust the actual EPS by multiplying it by the total shares at reported date and then divided by the total shares at the forecast date. RANK The numeric stock recommendation issued by the analyst when she releases earnings forecasts. The stock recommendation ranks from 1 to
5: 1-strong buy recommendation, 2-buy recommendation, 3-hold recommendation, 4-sell recommendation, and 5-strong sell recom-mendation. LowerRANKindicates more favorable recommendation.
Adj. RANK RANKminus the consensus stock recommendation (the averageRANKof the company under review over the year).
Measures of conflicts of interest
BROKERAGE The brokerage-firm’s shareholding of the stocks covered by its brokerage analysts
BRO_SHAREHOLDER The brokerage-firm’s controlling shareholder’s shareholding of the stocks covered by its brokerage analysts
AFFILIATE The affiliated mutual funds’ shareholding of the stocks covered by the analysts whose brokerage-firm receives commission income from
those mutual funds Control variables
REPUTATION An indicator that equals one if the analyst has ever been the top 3 “New Fortune Best Analyst” of a specific industry before the forecast
date, zero otherwise
IO The total institutional ownership of the company
UNDERWRITER An indicator that equals one if the analyst’s brokerage firm has ever been the lead underwriter for the company’s initial public offering
(IPO), secondary equity offering (SEO) or convertible debt issuance within two years prior to forecast date, and zero otherwise
HORIZON The natural logarithm of one plus the number of calendar days between the analyst’s earnings forecast issuance date and the actual
earnings announcement date
FOLLOWING The natural logarithm of one plus the number of analysts providing annual earnings forecast for the company in the year
SIZE The natural logarithm of the company’s average market value over the year
STDROE The company’s historical standard deviation of return on equity in the last 5 years
ROE Return on equity
In this figure, we show the interrelationship among analysts, the listed company and its brokerage block shareholders. Appendix A. Supplementary data
Supplementary data to this article can be found online athttps://doi.org/10.1016/j.najef.2019.101135.
References
Allen, F., Qian, J., & Qian, M. (2005). Law, finance, economic growth in China.Journal of Financial Economics, 77, 57–116.
Behn, B. K., Choi, J., & Kang, T. (2009). Audit quality and properties of analyst earnings forecasts.The Accounting Review, 83, 327–349.
Bessler, W., & Stanzel, M. (2009). Conflict of interest and research quality of affiliated analysts in the German universal banking system: Evidence from IPO
un-derwriting.European Financial Management, 15, 757–786.
Brown, L. D. (2001). How important is past analyst forecast accuracy?Financial Analysts Journal, 57, 44–49.
Cheng, Y., Liu, M. H., & Qian, J. (2006). Buy-side analysts, sell-side analysts, and investment decisions of money managers.Journal of Financial and Quantitative
Analysis, 41, 51–83.
Claessens, S., Djankovand, S., & Lang, L. H. P. (2000). The separation of ownership and control in East Asian Corporations.Journal of Financial Economics, 58, 81–112.
Cowen, A., Groysberg, B., & Healy, P. (2006). Which types of analyst firms are more optimistic?Journal of Accounting and Economics, 41, 119–146.
Das, S., Levine, C. B., & Sivaramakrishnan, K. (1998). Earnings predictability and bias in analysts’earnings forecasts.The Accounting Review, 73, 277–294.
Dechow, P. M., Hutton, A. P., & Sloan, R. G. (2000). The relations between analysts’ long-term earnings forecasts and stock performance following equity offerings. Contemporary Accounting Research, 17, 1–32.
Eames, M., & Glover, S. (2003). Earnings predictability and the direction of analysts’ earnings forecast errors.The Accounting Review, 78, 707–724.
Fan, J. P. H., & Wong, T. J. (2002). Corporate ownership structure and the informativeness of accounting earnings in East Asia.Journal of Accounting and Economics, 33,
401–426.
Firth, M., Lin, C., Liu, P., & Xuan, Y. (2013). The client is king: Do mutual fund relationships bias analyst recommendations?Journal of Accounting Research, 51,
165–200.
Francis, J., & Philbrick, D. (1993). Analysts' decisions as products of a multi-task environment.Journal of Accounting Research, 31, 216–230.
Gu, Z., Li, Z., & Yang, Y. G. (2013). Monitors or predators: The influence of institutional investors on sell-side analysts.The Accounting Review, 88, 137–169.
Gu, Z., Li, Z., Yang, Y. G., & Li, G. (2019). Friends in need are friends indeed: An analysis of social ties between financial analysts and mutual fund managers.The
Accounting Review, 94, 153–181.
Gu, Z., & Wu, J. S. (2003). Earnings skewness and analyst forecast bias.Journal of Accounting and Economics, 35, 5–29.
Hayes, R. M. (1998). The impact of trading commission incentives on analysts’ stock coverage decisions and earnings forecasts.Journal of Accounting Research, 36(2),
299–320.
Hodgkinson, L. (2001). Analysts’ forecasts and the broker relationship.Journal of Business Finance and Accounting, 28, 943–961.
Hong, H., & Kubik, J. D. (2003). Analysing the analysts: Career concerns and biased earnings forecasts.Journal of Finance, 58, 313–351.
Hong, H., Kubik, J. D., & Solomon, A. (2000). Security analysts’ career concerns and herding of earnings forecasts.RAND Journal of Economics, 21, 121–144.
Huang, W., & Wright, B. (2015). Analyst earnings forecast under complex corporate ownership in China.Journal of International Financial Markets, Institutions and
Money, 35, 69–84.
Irvine, P. (2001). Do analysts generate trade for their firms? Evidence from the Toronto stock exchange.Journal of Accounting and Economics, 30, 209–226.
Jackson, A. (2005). Trade-generation, reputation, and sell-side analysts.Journal of Finance, 60, 673–717.
Kolasinski, A. C., & Kothari, S. P. (2008). Investment banking and analyst objectivity: Evidence from analysts affiliated with mergers and acquisition advisors.Journal
of Financial and Quantitative Analysis, 43, 817–842.
Lang, M. H., & Lundholm, R. J. (1996). Corporate disclosure policy and analyst behavior.The Accounting Review, 71, 467–492.
Lim, T. (2001). Rationality and analysts' forecast bias.The Journal of Finance, 56, 369–385.
Lin, H., & McNichols, M. F. (1998). Underwriting relationships, analysts' earnings forecasts and investment recommendations.Journal of Accounting and Economics, 25,
101–127.
Michaely, R., & Womack, K. L. (1999). Conflict of interest and the credibility of underwriter analyst recommendations.The Review of Financial Studies, 12, 653–686.
Mola, S., & Guidolin, M. (2009). Affiliated mutual funds and analyst optimism.Journal of Financial Economics, 93(1), 108–137.
Wang, J., & Yuan, H. (2012). The impact of related party sales by listed Chinese firms on earnings informativeness and analysts’ forecasts.International Journal of
Business, 17, 258–275.