Board Governance and Earnings Management
of Chinese Listed Companies
Si Liu
Master Thesis for the Master of Philosophy in Environmental
and Development Economics Degree
UNIVERSITETET I OSLO
May 2011
Preface
With this master thesis, my study in Department of Economics, University of Oslo ends. However, what I have learned and experienced here will become an invaluable treasure in my whole life. In this very moment, I want to thank all those who have helped me during my campus life.
First of all, I am deeply grateful to my two supervisors, Prof. Atle Seierstad and Prof. Tore Nilssen, for their great help, inspirational suggestions, insightful comments and constant encouragement.
I want to express my profound gratitude to Prof. Olav Bjerkholt and Prof. Finn Førsund who promote this program in China and grant us warm support and care in Norway.
I’m also grateful for all those lecturers who make economics an inspiring world to me. Thanks to for their wonderful lectures.
My thanks go to all the members of the Department of Economics for their assistance over my two-year study period, especially Prof. Kjell Arne Brekke, Ingunn Skjerve and Kaya Sverre.
I appreciate the tutoring by Prof. Zhu Ye at Fudan University for theoretical foundation and methodology in Corporate Governance, and great support and effort provided by my classmates.
Also thank all my friends and classmates here that make my life in Oslo enjoyable and memorable.
Finally, I want to thank my parents for their unconditional love and consistent support in my life.
Si Liu
University of Oslo
Norway
Summary
This paper systematically presents theoretical and empirical research on board governance and earnings management of Chinese listed companies, trying to provide references for improving accounting information disclosure and corporate governance of listed companies.
The whole paper includes six chapters. The first chapter is the introduction and introduces the background and contributions, the innovations and research framework of my study.
The second chapter is the literature review on board governance and earnings management, in which I analyze and summarize existing literatures from different theoretical and empirical perspectives.
The third chapter measures the extent of earnings management of Chinese listed companies by using the Modified-Jones Model, which is based on the reviewing of measurement of earnings management and different research models.
The fourth chapter comprehensively evaluates board governance variables, namely, board size, board independence, board duality and board meetings by using descriptive statistics method.
The fifth chapter proposes theoretical hypotheses and conducts empirical examination on the relationship between board governance and earnings management of Chinese listed companies. In this chapter panel date model is introduced and Hausman test is conducted to determine which effect—fixed effect or random effect can better explain the regression model.
The sixth chapter is the conclusion and the main research findings are shown as follows:
1. Earnings management of Chinese listed companies
Among Chinese listed companies sorted by industries, 9 industries out of 12 exaggerate the profits through upward earnings management, 3 industries hide the profits through downward earnings management. Social Services Industry shows the highest earnings management level, while Communication and Culture Industry show the lowest earnings management level.
From 2002 to 2009, the average earnings management of Chinese listed companies gradually declined in fluctuation. The result indicates the quality of accounting information of Chinese listed companies has improved obviously in recent years.
2. Board governance of Chinese listed companies
The descriptive statistics of the four board governance variables show: the average number of board members in Chinese listed companies is 10; while the average number of independent directors is 4; only less than one tenth of Chinese listed companies have board chair also serves as CEO, and this situation tends to decrease.
3. Empirical findings on board governance and earnings management By using Panel Data Model and controlling for corporate size, return on equity and other factors, the empirical findings on board governance and earnings management are:
(1)Earnings management of Chinese listed companies is positively correlated to board size;
(2)Earnings management of Chinese listed companies is negatively correlated with board independence;
(3)Earnings management is negatively correlated to the separation of the roles of CEO and board chair.
Contents
Preface ... I
Summary ... II
Contents ...IV
Figures and tables ...VI
1. Introduction ... 1
1.1 Thesis background and contributions ... 1
1.1.1 Thesis background ... 1
1.1.2 Contributions ... 2
1.2 Innovations ... 3
1.3 Research framework ... 4
2. Literature Review on Board Governance and Earnings Management ... 5
2.1 Earnings management ... 5
2.2 Board governance ... 6
2.2.1 Board size and earnings management ... 6
2.2.2 Board independence and earnings management ... 8
2.2.3 Board duality and earnings management ... 9
2.2.4 Board meetings and earnings management ... 10
2.3 Literature review summary ... 10
3. Theoretical and Empirical Analysis on Earnings Management ... 11
3.1 Measurement of earnings management ... 11
3.1.1 Accruals model ... 11
3.1.2 Specific accruals model ... 11
3.1.3 Accruals distribution model ... 12
3.1.4 Measurement of earnings management ... 12
3.2 Earnings management models under accruals method ... 13
3.2.1 Jones Model ... 13
3.2.2 Industry Model ... 14
3.2.3 Modified-Jones Model ... 14
3.3 Earnings management of Chinese listed companies ... 15
3.3.1 Modified-Jones Model for earnings management ... 15
3.3.2 Sample selection ... 16
3.3.3 Empirical test and results on earnings management ... 21
4. Analysis on Board Governance ... 46
4.1 Board governance variables ... 46
4.2 Explanations of board governance variables and descriptive statistics ... 47
5. Theoretical Hypotheses and Empirical Test on Board Governance and Earnings Management ... 49
5.1 Theoretical hypotheses ... 49
5.1.1 Board size and earnings management ... 49
5.1.2 Board independence and earnings management ... 50
5.1.3 Board duality and earnings management ... 50
5.1.4 Board meetings and earnings management ... 51
5.2 Empirical test on board governance and earnings management ... 51
5.2.1 Panel data model ... 51
5.2.2 Fixed effect model ... 53
5.2.3 Random effect model ... 53
5.2.4 Regression results analysis ... 54
5.2.5 Hausman test and conclusions ... 55
6. Conclusions and Suggestions ... 58
6.1 Earnings management of Chinese listed companies ... 58
6.2 Board governance of Chinese listed companies ... 58
6.3 Empirical findings on board governance and earnings management ... 59
References ... 60
Figures and tables
List of Figures
Figure 1: Research framework of board governance and earnings management of Chinese listed companies ... 4 Figure 2: Trend in average earnings management of 93 sample companies 2002-2009 ... 45
List of Tables
Table 1: 2001-2009 Shanghai Stock Exchange 93 A-share sample companies sorted
by industry ... 17
Table 2.1: Earnings Management Measurement in Mining and Quarrying Industries 2002-2009 ... 23
Table 2.2:Earnings Management Measurement in Communication and Culture Industries 2002-2009 ... 24
Table 2.3:Earnings Management Measurement in Power, Gas and Water Production and Supply Industries 2002-2009 ... 26
Table 2.4:Earnings Management Measurement in Real Estate Industry 2002-2009 28 Table 2.5:Earnings Management Measurement in Building Industry 2002-2009 .... 30
Table 2.6:Earnings Management Measurement in Transportation and Storage Industries, 2002-2009 ... 32
Table 2.7:Earnings Management Measurement in Farming, Forestry, Animal Husbandry and Fishery Industries, 2002-2009 ... 34
Table 2.8:Earnings Management Measurement in Wholesale and Retail Trade Industries, 2002-2009 ... 36
Table 2.9:Earnings Management Measurement in Social Service Industry, 2002-2009 ... 38
Table 2.10:Earnings Management Measurement in Information Technology Industry, 2002-2009 ... 40
Table 2.11:Earnings Management Measurement in Manufacturing Industry, 2002-2009 ... 42
Table 2.12:Earnings Management Measurement in Integrated Industry, 2002-2009 ... 44
Table 3: Descriptive statistics of board size from 2006 to 2009 ... 47
Table 4: Descriptive statistics of board independence from 2006 to 2009 ... 48
Table 5: Descriptive statistics of board duality from 2006 to 2009 ... 48
1.
Introduction
1.1 Thesis background and contributions
1.1.1 Thesis background
Institutional setting of Chinese stock market
The Chinese stock market was organized by the government as a vehicle for State Owned Enterprises (SOEs) to raise capital and improve operating performance (Green, 2003). Since the primary objective of developing equity markets is to help SOEs relax external financing constraints, regulations introduced have been asymmetrically in favor of SOEs or the companies with close ties to the government. A fundamental dilemma of the above administrative approach stems from the state policy of maintaining a full or controlling ownership in firms1. The state wants the firms it owns to be run efficiently, but not solely for the purpose of wealth maximization, which creates conflicts of interest between the state as controlling shareholder and other shareholders. Even worse, the state is playing two roles at the same time—the controlling shareholder and the regulator (Clarke, 2003; Firth et al., 2006). The state representatives dominate corporate boards, which greatly compromise the independence of corporate boardrooms (Liu, 2006).
Tunneling in the Chinese listed companies
The Chinese institutional set-up in the stock market results in pervasive tunneling activities among the listed firms. In most cases, local governments appoint the management of listed firms. As a result, the management often takes action to benefit the largest shareholders (the local government in most cases). It is noted that such practice may add social values in other ways that offset the social costs it imposes through tunneling—e.g., it may help reduce external financing constraints and transaction costs. However, outside investors almost always lose when the
1 The state takes direct control of important industries such as banking, energy and telecommunication
controlling shareholders tunnel (Cheung et al., 2005). Tunneling activities in China mainly take the form of granting loans to majority shareholders, and related-party transactions. A number of studies have examined the tunneling activities in the Chinese stock markets. Cheung et al. (2005) study a sample of related-party transactions between Chinese listed firms and their controlling shareholders. They provide evidence that related-party transactions are not typically beneficial for minority shareholders. Jiang et al. (2005) document the widespread use of corporate loans by controlling shareholders to extract funds from the listed firms in China.
Earnings management in the Chinese listed companies
Due to the administrative governance approach adopted in China, the regulators often rely on accounting numbers to govern the listed companies. the China Securities Regulatory Commission (CSRC) requires listed companies to meet certain return on equity (ROE) criteria before they can apply for permission to issue additional shares to existing shareholders. Therefore, listed firms have strong incentives to manage earnings above necessary thresholds.
Earnings management tends to be pervasive in China also because private benefits of control are large but the level of corporate governance is poor and the protection of minority investors is weak. To enjoy these private control benefits, controlling shareholders have strong incentives to manage earnings to avoid de-listing, especially when de-listing decision is relied on certain accounting numbers. To controlling shareholders and other insiders, being de-listed implies the loss of private control benefits and future rent-seeking opportunities. Therefore, doing whatever it takes to avoid net loss for three consecutive years provides the Chinese listed companies with another incentive to manage earnings.
Enrich the research on board governance and earnings management of Chinese listed companies
Based on current stage of China's capital market development, this paper attempts to do systematic empirical research on board structure of listed companies and earnings management. We expect our research outcome can provide effective evidence for understanding board monitoring mechanisms will impose constraint on earnings management and enrich the research on board governance and earnings management.
Promote listed companies to improve board governance, effectively imposing constraint on earnings management, and improving transparency of listed companies’ accounting information
We hope our research helps to understand the practical situation of board governance and earnings management of Chinese listed companies, in order to promote listed companies to improve board governance, effectively imposing constraint on earnings management, and improving transparency of accounting information of listed companies.
1.2 Innovations
Existing domestic empirical studies mainly focus on earnings management of listed companies in order to avoid regulatory constraints and market regulation. The studies aim to discover the motivation of earnings management of listed companies, and try to provide evidence for government regulation or provide references for the supervision of securities markets transactions.
On board governance side, the majority of articles study the impact of board structure on performance of listed companies. Systematic empirical research on board governance and earnings management is not sufficient, especially lacking the analysis of constraints on earnings management from each aspect of board structure. We will conduct in-depth research in this paper.
1.3 Researchframework
Figure 1: Research framework of board governance and earnings management of Chinese listed companies
1. Introduction
Thesis background and contributions
Innovations Research framework
2. Literature Review on Board Governance and Earnings Management
3. Theoretical and Empirical Analysis on Earnings
Management
4. Analysis on Board Governance
5. Theoretical Hypotheses and Empirical Test on Board Governance and Earnings Management
2. Literature Review on Board Governance and Earnings Management
The prevalence of earnings management reduces the reliability of accounting information. Users may find it difficult to make fair assessment of corporate performance, managers’ ability and effort based on earnings information. Worse still, it may mislead investors to make wrong investment decisions.
Board of Directors of listed companies exercises their monitoring functions to reduce earnings management in two ways: on one hand is to prevent managers from abusing their power against the interests of shareholders through earnings management; on the other hand is to prevent controlling shareholders from undermining corporate resources against the interests of minority shareholders for their own benefits. Therefore, board governance will impose effective constraints on earnings management.
2.1 Earnings management
A growing numbers of literatures abroad have examined corporate earnings management behavior in China's infant stock market. Aharony et al. (2000) identify evidence of earnings manipulation among the Chinese listed firms prior to their Initial Public Offers (IPOs). Chen and Yuan (2004) find that the Chinese listed firms manage earnings to satisfy the ROE requirements for rights issues. Jian and Wong (2005) present evidence that the listed manufacturing firms in China use related-party transactions to manage earnings. Chen et al. (2006) find that various aspects of corporate governance (e.g., boardroom characteristics and ownership) are associated with the incidence of corporate financial fraud.
Domestic researches on earnings management mainly focus on earnings management of listed companies in order to avoid regulatory constraints and market regulation. Lu Jianqiao (1999) takes the sample of listed companies facing losses before the end of 1997 and finds that these companies generally adopted earnings management to reduce or increase earnings in the loss year and the year before and
after, in order to avoid three consecutive year loss which will be regulated by securities regulatory authorities. Zhang Zongyi and Huang Xinjian (2003) conduct empirical study on IPOs of Chinese listed companies from 1998 to 2000 and find that there is significant earnings management in the listing year and the year prior to and after listing. Zhang Yanling and Peng Haoran (2004) empirical study on motivations of earnings management and earnings forecast error find that listed companies with over-estimated earnings will increase earnings through managing the operating income and working capital in the first year after listing, indicating there is strong motivation for listed companies to manipulate earnings in order to avoid punishment on earnings forecast error. Wang Yaping et al (2005) present evidence that from 1995 to 2003, there were earnings management by Chinese listed companies in order to avoid reporting loss.
2.2 Board governance
2.2.1 Board size and earnings management
The Board of directors has direct monitoring responsibility on the management, and obligations to impose constraints on earnings management. Board size (number of board members) is an important factor to the efficiency of board governance. A large number of empirical studies have provide evidence that there is relation between board size and corporate performance, but current studies do not give consistent research findings on the relationship between board size and corporate performance. However, empirical researches on board size and earnings management are rare.
Some scholars believe that to a certain corporate size, a too large board of directors cannot function to the best. This view is based primarily on the Agency Theory and Organizational Behavior Theory. Lipton and Lorsch (1992) present although board monitoring capacity increases with the number of directors increasing, the larger the board of directors, the severer is the free-rider problem (agency problem). The loss from coordination and organization will surpass the profit brought from increasing numbers of directors. Jensen (1993) indicates that the larger the board
of directors, the lower is the efficiency. The “hatred and revenge” between directors may weaken the board's monitoring and evaluation on CEO. While the board will be more easily controlled and influenced by CEO. Yermack (1996) identifies evidence from an empirical test. He takes "Fortune 500” companies as a sample and finds that a small board of directors is more efficient than a large one. Eisenberg et al (1998) take the sample of small and medium companies in Finland, and prove that there is a significant correlation between a smaller board of directors and higher firm performance. Wu (2000) studies changes in board size from 1991 to 1995. She finds that the overall size of board shows a reducing trend during this time, and the pressure from active investors can partially explain the phenomenon. She identifies that the market participants believe that small board of directors is doing better than relatively large board of directors in monitoring managers.
Resource Dependence Theory is the main theoretical foundation for the view that relatively large board of directors is more conducive to improve governance efficiency. More directors may bring more knowledge, experience and external resources to the board, making knowledge and experience within the board play complementary roles better, which to some extent reduces the company risk. In addition, it is easier to coordinate interests of different stakeholders in the board with different stakeholder representatives. Dalton et al (1999) present evidence based on the analysis of 131 different samples that there is significant positive correlation between corporate performance and board size, and the larger board of directors is able to provide better external resources and is more professional. Coles et al (2005) show that small board size does not apply to all kinds of companies, for those cross-industries, large-scale and high-debt companies, who need help and experience from more directors, board size and company performance are positively correlated.
From domestic perspective, Wang Liyan and Liu Junxia (2003) find that earnings management is negatively correlated with board size. Cai Ning (2003) finds that there is a significant positive correlation between board size and financial fraud.
2.2.2 Board independence and earnings management
From an agency perspective, the ability of the board to act as an effective monitoring mechanism is dependent upon its independence from management.
A large number of literatures abroad have conducted empirical research on independent directors’ monitoring function on earnings management. Beasley (1996) finds that the presence of independent directors on the board reduces the likelihood of financial statement fraud. Klein A. (2002) suggests that boards structured to be more independent from CEO are more effective in monitoring the corporate financial accounting process and earnings management. Xie et al. (2003) finds that earnings management is less likely to occur in companies whose boards include both more independent outside directors and directors with corporate experience. But the level of earnings management may influence the subsequent selection of board. Davidson et al.(2005) find that, based on a broad cross-sectional sample of 434 listed Australian firms, a majority of non-executive directors on the board are significantly associated with a lower likelihood of earnings management. Peasnell et al. (2005) examines whether the incidence of earnings management by UK firms depends on board monitoring. Results indicate that the likelihood of managers making income-increasing abnormal accruals is negatively related to the proportion of outsiders on the board. Cornett (2009) finds that earnings management and corporate governance are endogenously determined. Thus, OLS estimation can lead to biased coefficients and a simultaneous equations approach is used. Based on 593 largest bank holding companies head-quartered in US, the paper indicates earnings, board independence, and capital are negatively related to earnings management.
From the domestic point of view, Zhang and Chen (2006) shows that the higher percentage of independent directors in the board, the lower level of earnings management, which suggests independent directors of Chinese listed companies are playing an important role. Zhang et al. (2006) indicates there is a significant "U" shaped relationship between the proportion of independent directors and earnings management.
However, Cai (2007) indicates that there is no significant correlation between independent directors and earnings management. Wang (2007) tests the relation between independent directors and earnings quality based on the listed companies’ data from 2002-2004. The result is, in general, independent directors have not performed an efficient role yet in China.
2.2.3 Board duality and earnings management
Board duality, that is, whether the chairman of the board is the same person as general manager, is the focus of academic debate. Modern Stewardship Theory argues that chairman of the board and general manager should be the same person. Boyd (1995) points out that this mode helps to improve the efficiency of communication and decision-making.
However, Agency Theory actively advocates chairman of the board and general manager should be different persons. In order to prevent moral hazard and adverse selection problems generated by managers, an effective monitoring mechanism is necessary. If the manager is the same person as the chairman, then the monitoring mechanism will collapse. Lipton and Lorsch (1992), Jensen (1993) suggest that chairman and general manager is the same person will lead to a low efficient board, because the board would be difficult to carry out its monitoring function. Dechow et al (1996) find that if the board is controlled by general manager, earnings management is more likely to occur. Beasley (1996) points out, CEO serves as chairman of the board will lead to power concentration and conflict of interests, thus undermine board monitoring function.
From domestic view, CEO serves as chairman of the board is often seen as hindering corporate performance improvement. However, it has not yet reached a clear conclusion that chairman and general manager is the same person will increase the possibility of earnings management. This paper will conduct empirical research in this area in order to clarify the relation between board duality and earnings management.
2.2.4 Board meetings and earnings management
The frequency of board meetings may reflect whether the board is active or not. It is generally believed that an active board is more effective in monitoring the management, so decisions made are more in line with the interests of majority shareholders, thus is conducive to enhance corporate performance.
Lipton and Lorsch (1992) suggest that increasing board meeting time will improve the efficiency of the board. The more frequent board meeting is, directors are more willing to perform their duties which are consistent with the interests of shareholders. On the contrary, Jensen (1993) finds that most of the board meetings are not very effective. The board is often forced to engage in high-frequency activities to resolve corporate matters. Therefore, a higher frequency of board activities may be the response to poor corporate performance.
The literature on board meetings and earnings management are rare and mainly from abroad. Vafeas (1999) finds that the more frequent the board meeting, the lower degree of earnings management and the more transparency is corporate financial information. Xie et al (2003) suggest that board meeting is an important factor to restrict earnings management activities of managers.
2.3 Literature review summary
From the above literature review, we find there are few papers making profound theoretical and empirical analysis on the relationship between board governance of Chinese listed companies and earnings management. And the relevant empirical studies show quite different results. So in the following parts, we will first give theoretical and empirical analysis of earnings management in Chinese listed companies, then followed by examination on the relations between board governance of Chinese listed companies and earnings management.
3. Theoretical and Empirical Analysis on Earnings Management
The setting up of corporate board is to coordinate the conflicts of interest between shareholders and managers, aimed at maximizing the shareholders' interests by dispensing constraints and incentives to managers. Therefore, a perfect governance structure of the board will compress manager’s implementation space of earnings management and manipulation.
In this part, we will first study the quantitative analysis of earnings management through reviewing and summarizing the existing quantitative research models, and then by comparing the models, we will determine a suitable model for earnings management measurement of Chinese listed companies.
3.1 Measurement of earnings management
Theorists have been attempting to deliver an accurate and objective measurement for earnings management in order to do a better quantitative research. The existing
measuring models of earnings management can be divided into three categories: accruals model, specific accruals model and accruals distribution model.
3.1.1 Accruals model
Accrual model is currently the mainstream measuring of earnings management. This method points out that total accruals of a listed company is composed of accruals by earnings management, namely discretionary accruals, and accruals by different accounting methods, namely non-discretionary accruals. Therefore, from measuring non-discretionary accruals by constructing a regression model, discretionary accruals is calculated as the difference between total accruals and non- discretionary accruals, which measures the degree of earnings management.
3.1.2 Specific accruals model
As accrual method depends on some subjective assumptions, there is some limitation in practical application. Researchers choose to study accruals models case
by case and put forward the specific accruals model. They try to make analysis and calculation of specific accrued items to determine the degree of earnings management. But the drawbacks of specific accruals model often confines to a small sample or specific industry, which makes the research results impossible to popularize.
3.1.3 Accruals distribution model
Accruals distribution model is a more practical method. This method firstly need to determine specific earnings index, then through testing distribution of reporting earnings around the specific index to judge the existence of earnings management. Existing researches find that around specific earnings index, there are more or less observations than expected, indicating around these specific earnings index earnings management exists. But the shortcoming is that by using this method, one cannot get the information on means and degrees of earnings management hence cannot further do a quantitative study.
3.1.4 Measurement of earnings management
According to existing empirical researches home and abroad, we find that accruals models get the most extensive applications in quantitative study of earnings management, and the theoretical research on earnings management through accruals model is relatively mature.
In this paper, we will conduct empirical test on the relationship between board structure and earnings management, so quantitative measurement of earnings management is necessary. In addition, the realized quantitative measurement should support large sample. In this respect, accruals model has the advantage over the other two models, therefore we will adopt accruals model for measuring earnings management.
3.2 Earnings management models under accruals method
Healy (1985) suggests that the net income of firms can be divided into two parts: operating cash flow and accruals, and notices that accrued items can change the confirming time for reported earnings and allow managers to transfer earnings between each period. The measurement of earnings management under accruals model is based on decomposition of total accruals (TAC) into non-discretionary accruals and discretionary accruals. Non-discretionary accrual is calculated through regression model and discretionary accrual is the difference between total accruals and non-discretionary accruals, which is a measure of earnings management. By reviewing existing research on earnings management models, representative econometric models basically are as follows:
3.2.1 Jones Model
Jones (1991) relaxes the assumption that non-discretionary accruals can only be constant numbers and puts forward an earnings management model aimed at controlling the influence of economic environment change on non-discretionary accruals. The model calculating non-discretionary accruals is demonstrated below:
t 1 t-1 2 t t-1 3 t t-1 NDA =a (1/A ) + a ΔREV /A + a PPE /A Where:
△REVt = change in sales revenue between year t -1 and t,
PPEt = gross property, plant and equipment in year t, At - 1= total assets at the end of the previous year t-1,
a1, a2 and a3 are industry-specific coefficients estimated from the following cross-sectional regression:
t 1 t-1 2 t t-1 3 t t-1 TA =
α
(1/A ) +α
ΔREV /A +α
PPE /A +VtWhereα1, α2and α3 are the OLS regression estimates of a1, a2 and a3 respectively, TAt = total accruals in year t divided by total assets in year t-1.
A hidden hypothesis of Jones model is that sales revenue cannot be manipulated. But if earnings management is realized through manipulation of sales revenue, then the model will make the part of earnings management removed from discretionary accruals.
3.2.2 Industry Model
Dechow and Sloan (1991) present industry model which also eases the assumption that non-discretionary accruals are constants as Jones model does. But the difference is that industry model assumes that influence factors of non-discretionary accruals are the same between different enterprises in the same industry. Industry model is as follows:
NDA= r1+r2 median (TA)
Where median (TA) is the median of total accruals divided by total assets in year t-1, r1 and r2 are industry-specific coefficients estimated from OLS model.
Industry model eliminates the difference of non-discretionary accruals within different enterprises in the same industry, but if the changes of non-discretionary accruals are rendered by enterprise specific environment factors, the industry model cannot separate non-discretionary accruals and discretionary accruals accurately.
3.2.3 Modified-Jones Model
Assume account sale also can become a source of earnings management. Dechow (1995) presents Modified-Jones Model by deducting accounts receivable from sales revenue. The model is as follows:
t 1 t-1 2 t t t-1 3 t t-1
NDA =a (1/A ) + a ( REV - REC )/A + a PPE /AΔ Δ
Where, △RECt = change in accounts receivable between year t -1 and t,
industry-specific coefficients a1, a2 and a3 and non-discretionary accruals come from the original Jones Model.
So the only adjustment of Modified-Jones Model is that it deducts change in accounts receivable from change in sales revenue. The underlying assumption is that all the change in accounts receivable is caused by earnings management. This is based
on the following reasoning, for managers, it is much easier to manage earnings from accounts receivable than from cash sale income.
3.3 Earnings management of Chinese listed companies
3.3.1 Modified-Jones Model for earnings management
From Chinese listed companies operating situations and accounting procedures, corporate non-discretionary accruals will definitely change with the economic environment. Although the original Jones Model is trying to explain the influence of economic environment change on non-discretionary accruals, it does not take into account that different industries have different influence factors on non-discretionary accruals of the listed companies. And if most of non-discretionary accruals changes are caused by enterprise specific environment factors, then the industry model, which ignores differences in enterprises within the same industry, cannot separate non-discretionary accruals and discretionary accruals accurately. To sum up, we will adopt the Modified-Jones Model to measure earnings management in Chinese listed companies.
[
]
t t t-1 1 t-1 2 t t t-1 3 t t-1
EDA = TA /A - a (1/A ) + a ( REV - REC )/A + a PPE /AΔ Δ
Where:
△REVt = change in sales revenue between year t -1 and t,
△RECt = change in accounts receivable between year t -1 and t, PPEt = gross property, plant and equipment in year t,
At - 1= total assets at the end of the previous year t-1,
a1, a2 and a3 are industry-specific coefficients estimated from the following cross-sectional regression:
t 1 t-1 2 t t t-1 3 t t-1 t
TA =α (1/A ) + α ( REV - REC )/A + Δ Δ α PPE /A + v
Whereα1, α2and α3 are the OLS regression estimates of a1, a2 and a3
TAt = NetIncomet - CFOt,
Where CFOt = Net Cash flow from operating activities in year t.
3.3.2 Sample selection
Due to measurement of earnings management need to differentiate research
samples of various industries, we differentiate various industries according to Industry
Classification of Listed Companies Guidelines issued by China Securities Regulatory Commission.
Our empirical test are conducted using data for all the listed firms in Shanghai Stock Exchange (A Share) with fiscal year ends between 2001 and 2009 as a primary sample, making the following screening:
1) Eliminating listed companies in financial and insurance industry, because compared with other sectors, companies in financial and insurance sector have special accounting rules;
2) Removing all ST companies;
3) Removing companies with incomplete financial data between 2001 and 2009.
In order to make a comprehensive research on earnings management of Shanghai A-share listed companies, same number of listed companies are selected as samples from each industry, and altogether 93 listed companies are finally chosen, covering 12 industries (see table 1 below):
Table 1: 2001-2009 Shanghai Stock Exchange 93 A-share sample companies sorted by industry
No. Securities
Code Corporate Name Industry No.
Securities
Code Corporate Name Industry
1 600508.SH SHANGHAI DATUN ENERGY RESOURSES CO.,LTD. MINING AND QUARRYING INDUSTRIES 48 600438.SH TONGWEI CO.,LTD FARMING, FORESTRY, ANIMAL HUSBANDRY AND FISHERY INDUSTRIES 2 600028.SH CHINA PETROLEUM & CHEMICAL CORPORATION 49 600075.SH XINJIANG TIANYE CO.,LTD. 3 600188.SH YANZHOU COAL MINING CO., LTD. 50 600975.SH HUNAN NEW WELLFUL CO.LTD. 4 600489.SH ZHONGJIN GOLD CO., LTD. 51 600108.SH GANSU YASHENG INDUSTRIAL (GROUP)CO.,LTD 5 600395.SH GUIZHOU PANJIANG REFINED COAL CO.,LTD. 52 600093.SH SICHUAN HEJIA CO.LTD. 6 600583.SH
OFFSHORE & OIL ENGENEERING CO.,LTD 53 600097.SH SHANGHAI KAICHUANG MARINE INTERNATIONAL CO.,LTD 7 600547.SH SHANDONG GOLD MINING CO.,LTD. 54 600631.SH SHANGHAI BAILIAN GROUP CO.,LTD. WHOLESALE AND RETAIL TRADE INDUSTRIES 8 600123.SH SHANXI LANHUA SCI-TECH VENTURE CO.,LTD 55 600826.SH SHANGHAI LANSHENG CORPORATION 9 600037.SH BEIJING GEHUA CATV NETWORK CO., LTD. COMMUNICAION AND CULTURE INDUSTRIES 56 600859.SH BEIJING WANGFUJING DEPARTMENT STORE (GROUP)CO.,LTD. 10 600088.SH CHINA TELEVISION MEDIA LTD. 57 600755.SH XIAMEN INTERNATIONAL TRADE GROUP CO., LTD.
11 600551.SH TIME PUBLISHING
& MEDIA CO., LTD. 58
600628.SH SHANGHAI NEW WORLD CO.,LTD. 12 600831.SH BROADCAST & TV NETWORK INTERMEDIARY (GROUP)CO.LTD 59 600827.SH SHANGHAI FRIENDSHIP GROUP INCORPORATED COMPANY 13 600880.SH CHENGDU B-RAY MEDIA CO., LTD. 60 600056.SH CNTIC TRADING CO., LTD. 14 600236.SH GUANGXI GUIGUAN ELECTRIC POWER CO.,LTD.
POWER, GAS AND WATER PRODUCTION AND SUPPLY INDUSTRIES 61 600500.SH SINOCHEM INTERNATIONAL CORPORATION 15 600795.SH GD POWER DEVELOPMENT CO., LTD 62 600874.SH TIANJIN CAPITAL ENVIRONMENTAL GROUP PROTECTION CO., LTD SOCIAL SERVICE INDUSTRY 16 600027.SH HUADIAN POWER INTERNATIONAL CO.,LTD. 63 600611.SH DAZHONG TRANSPORTATION (GROUP)CO.,LTD. 17 600116.SH CHONGQING THREE GORGES WATER CONSERVANCY AND ELECTRIC POWER CO.,LTD. 64 600054.SH HUANGSHAN TOURISM DEVELOPMENT CO., ,LTD. 18 600021.SH SHANGHAI ELECTRIC POWER CO.,LTD. 65 600754.SH SHANGHAI JINJIANG INTERNATIONAL HOTELS DEVELOPMENT CO., LTD. 19 600642.SH SHENERGY CO.,LTD 66 600358.SH CHINA UNITED TRAVEL CO., LTD. 20 600780.SH TOP ENERGY CO.,LTD 67 600662.SH SHANGHAI QIANGSHENG HOLDING CO.,LTD. 21 600292.SH CHONGQING JIULONG ELECTRIC POWER CO.,LTD 68 600008.SH BEIJING CAPITAL CO., LTD 22 600185.SH XI ’AN GREE REAL ESTATE 69 600350.SH SHANDONG EXPRESSWAY
CO.,LTD REAL ESTATE INDUSTRY CO.,LTD. 23 600748.SH SHANGHAI INDUSTRIAL DEVELOPMENT CO.,LTD. 70 600345.SH WUHAN YANGTZE COMMUNICATION INDUSTRY GROUP CO., LTD INFORMATION TECHNOLOGY INDUSTRY 24 600383.SH GEMDALE CORPORATION 71 600601.SH FOUNDER TECHNOLOGY GROUP CORP. 25 600823.SH SHANGHAI SHIMAO CO.,LTD 72 600654.SH SHANGHAI FEILO CO.,LTD. 26 600648.SH SHANGHAI WAI GAOQIAO FREE TRADE ZONE DEVELOPMENT CO.,LTD. 73 600122.SH JIANGSU HONGTU HIGH TECHNOLOGY CO.,LTD 27 600246.SH BEIJING VANTONE REAL ESTATE CO.,LTD 74 600850.SH SHANGHAI EAST-CHINA COMPUTER CO.,LTD 28 600376.SH BEIJING CAPITAL DEVELOPMENT CO.,LTD. 75 600680.SH SHANGHAI POTEVIO CO.,LTD. 29 600724.SH NINGBO FUDA CO.,LTD. 76 600734.SH FUJIAN START GROUP CO. LTD. 30 600266.SH BEIJING URBAN CONSTRUCTION INVESTMENT& DEVELOPMENT CO.,LTD. BUILDING INDUSTRY 77 600050.SH CHINA UNITED NETWORK COMMUNICATION S LIMITED 31 600068.SH CHINA GEZHOUBA GROUP CO.,LTD. 78 600196.SH SHANGHAI FOSUN PHARMACEUTICAL (GROUP) CO.,LTD. MANUFACTURIN G INDUSTRIES 32 600477.SH ZHEJIANG HANGXIAO STEEL STRUCTURE CO.,LTD
79 600597.SH BRIGHT DAIRY & FOOD CO., LTD
33 600853.SH
LONGJIAN ROAD &
BRIDGE CO.,LTD. 80
600612.SH
LAO FENG XIANG CO.,LTD. 34 600170.SH SHANGHAI CONSTRUCTION GROUP CO., LTD 81 600186.SH HENAN LIANHUA GOURMET POWDER CO., LTD. 35 600039.SH
SICHUAN ROAD &
BRIDGE CO.,LTD 82
600690.SH
QINGDAO HAIER CO., LTD
36 600820.SH SHANGHAI TUNNEL ENGINEERING CO., LTD. 83 600031.SH SANY HEAVY INDUSTRY CO.,LTD 37 600512.SH TENGDA CONSTRUCTION GROUP CO., LTD. 84 600884.SH NINGBO SHANSHAN CO.,LTD. 38 600004.SH GUANGZHOU BAIYUN INTERNATIONAL AIRPORT CO.,LTD. TRANSPORTATION AND STORAGE INDUSTRIES 85 600150.SH CHINA CSSC HOLDINGS LIMITED 39 600115.SH CHINA EASTERN AIRLINES CO.,LTD. 86 600832.SH SHANGHAI ORIENTAL PEARL(GROUP) CO., LTD INTEGRATED INDUSTRY 40 600650.SH SHANGHAI JIN JIANG INTERNATIONAL INDUSTRIAL INVESTMENT CO.,LTD 87 600624.SH SHANGHAI FUDAN FORWAR D S&T CO., LTD 41 600377.SH JIANGSU EXPRESSWAY CO.,LTD 88 600622.SH SHANGHAI JIABAO INDUSTRY & COMMERCE (GROUP) CO.,LTD 42 600717.SH TIANJIN PORT(GROUP) CO., LTD. 89 600051.SH NINGBO UNITED GROUP CO.,LTD. 43 600125.SH CHINA RAILWAY TIELONG CONTAINER LOGISTICS CO., LTD. 90 600790.SH CHINA LIGHT&TEXTILE INDUSTRIAL CITY GROUP CO.,LTD. 44 600897.SH XIAMEN INTERNATIONAL AIRPORT CO.,LTD. 91 600846.SH SHANGHAI TONGJI SCIENCE & TECHNOLOGY INDUSTRIAL CO.,LTD. 45 600428.SH COSCO SHIPPING CO.,LTD. 92 600895.SH SHANGHAI ZHANGJIANG HI-TECH PARK DEVELOPMENT CO.,LTD.
46 600598.SH HEILONGJIANG AGRICULTURE CO.,LTD. FARMING, FORESTRY, ANIMAL HUSBANDRY AND FISHERY INDUSTRIES 93 600770.SH JIANGSU ZONGYI CO., LTD 47 600257.SH DAHU AGRICULTURE CO.,LTD.
Data source:Wind database (Shanghai A-share Companies financial statement data)
3.3.3 Empirical test and results on earnings management
We adopt SUR (Seemingly Unrelated Regression Models) to conduct empirical
test on the following model:
t 1 t-1 2 t t t-1 3 t t-1 t
TA =α (1/A ) + α ( REV - REC )/A + Δ Δ α PPE /A + v (1)
Regression results for parameterα1, α2and α3 can be found in Appendix,
where:
ta_assi = TA /At t-1
drvci = ( REV - REC )/AΔ t Δ t t-1
ppei = PPE /A t t-1 (i = 1.2..., 93)
The results show that the model is significant, hence indicates modified-Jones model can estimate sample enterprises’ non-discretionary accruals.
According to the following equation:
[
]
t t t-1 1 t-1 2 t t t-1 3 t t-1
EDA = TA /A - a (1/A ) + a ( REV - REC )/A + a PPE /A Δ Δ (2)
The expected discretionary accruals are residuals from the above regression (1), thus we can come to the conclusion that measurement results of discretionary accruals (EDA) of the above 93 companies are shown in Table 2.1-2.12.
Earnings Management of Companies in Mining and Quarrying Industries
From the table below, we can see from 2002 to 2009 there are 33 observations in Mining and Quarrying Industries with negative earnings management (EDA), meaning the enterprises made downward earnings management to hide profits by manipulating discretionary accruals, and the maximum extent is -0.11; while another 31 observations showing positive EDA, indicating sample enterprises made
income-increasing earnings management by increasing discretionary accruals, and the
maximum extent is 0.10.
During observation period the average earnings management of sample companies is 2.36E-07, showing that the whole industry executed an upward earnings management.
Table 2.1: Earnings Management Measurement in Mining and Quarrying Industries 2002-2009
Corporate
Name Year EDA
Corporate
Name Year EDA
Corporate
Name Year EDA
SHANGHAI DATUN ENERGY RESOURSES CO.,LTD. 2002 0.02191 ZHONGJIN GOLD CO., LTD. 2002 0.079378 SHANDONG GOLD MINING CO.,LTD. 2002 0.0182915 2003 -0.02845 2003 -0.01833 2003 -0.020303 2004 0.046807 2004 -0.03762 2004 0.0336098 2005 0.029892 2005 -0.02262 2005 0.0471396 2006 -0.04498 2006 0.029524 2006 0.046281 2007 -0.03905 2007 0.050364 2007 -0.00124 2008 0.017668 2008 0.023211 2008 -0.01591 2009 -0.0038 2009 -0.10391 2009 -0.10786 CHINA PETROLEUM & CHEMICAL CORPORATION 2002 0.00811 GUIZHOU PANJIANG REFINED COAL CO.,LTD. 2002 0.004291 SHANXI LANHUA SCI-TECH VENTURE CO.,LTD 2002 -0.02103 2003 0.005634 2003 -0.05737 2003 -0.01906 2004 -0.02783 2004 0.102788 2004 0.042948 2005 0.024024 2005 0.006564 2005 0.039261 2006 -0.01163 2006 -0.07259 2006 -0.00996 2007 -0.01719 2007 -0.01438 2007 0.014924 2008 0.011001 2008 0.036673 2008 -0.11288 2009 0.007883 2009 -0.00597 2009 0.065803 YANZHOU COAL MINING CO., LTD. 2002 0.051708 OFFSHORE & OIL ENGENEERI NG CO.,LTD 2002 -0.02026 2003 -0.0411 2003 -0.00931 2004 -0.02201 2004 0.010114 2005 0.050657 2005 -0.02599 2006 -0.05647 2006 -0.01184 2007 -0.05162 2007 0.025623 2008 -0.0323 2008 -0.00601 2009 0.10114 2009 0.037672
Earnings Management of Companies in Communication and Culture Industries
From the table below, we can see from 2002 to 2009 there are 16 observations in Communication and Culture Industries with negative EDA, meaning the enterprises made downward earnings management, and the maximum extent is -0.10; while another 24 observations showing positive EDA, indicating enterprises made
income-increasing earnings management and the maximum extent is 0.07.
The enterprise which made the maximum upward and downward manipulation
in earnings is CHINA TELEVISION MEDIA LTD.
During observation period the average earnings management of sample companies is 2E-07, showing that the whole industry executed an upward earnings management.
Table 2.2:Earnings Management Measurement in Communication and Culture Industries 2002-2009
Corporate
Name Year EDA
Corporate
Name Year EDA
Corporate
Name Year EDA
BEIJING GEHUA CATV NETWORK CO., LTD. 2002 0.033385 TIME PUBLISHING & MEDIA CO., LTD. 2002 -0.02139 CHENGDU B-RAY MEDIA CO., LTD. 2002 0.013243 2003 -0.0421 2003 -0.02705 2003 0.017483 2004 0.040786 2004 -0.01837 2004 -0.00149 2005 0.042888 2005 0.006197 2005 -0.0013 2006 -0.0651 2006 0.004162 2006 0.033447 2007 0.01058 2007 0.046368 2007 -0.09463 2008 0.016384 2008 0.010501 2008 0.003891 2009 -0.03681 2009 -0.00042 2009 0.029357 CHINA TELEVISION MEDIA LTD. 2002 0.01635 BROADCAST & TV NETWORK INTERMEDIARY (GROUP)CO.LTD 2002 0.008453 2003 -0.01738 2003 0.030361 2004 0.008633 2004 0.02398 2005 0.007832 2005 -0.03908 2006 -0.02128 2006 -0.0412 2007 0.037611 2007 0.017437 2008 -0.1029 2008 0.003757 2009 0.071132 2009 -0.00371
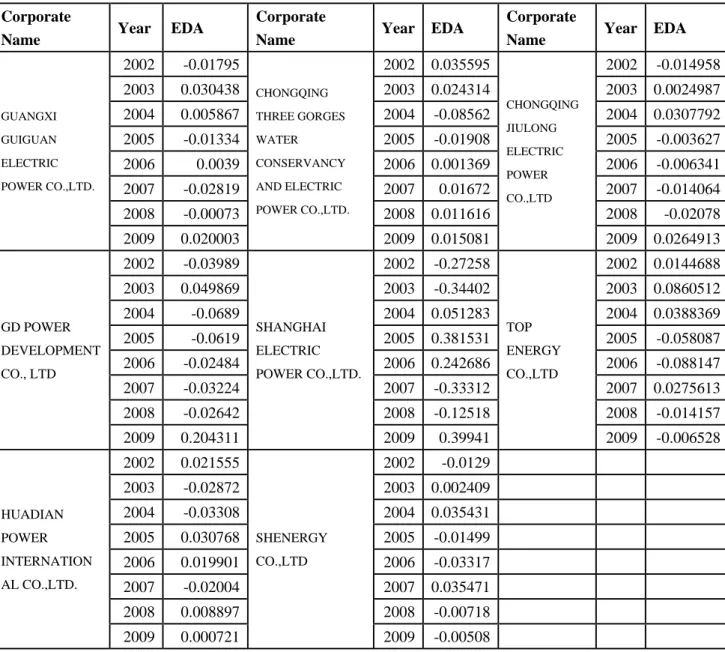
Earnings Management of Companies in Power, Gas and Water Production and Supply Industries
From the table below, we can see from 2002 to 2009 there are 33 observations in Power, Gas and Water Production and Supply Industries with negative EDA, suggesting the enterprises made downward earnings management, and the maximum extent is -0.34; while 31 observations showing positive EDA, indicating enterprises
made income-increasingearnings management, and the maximum extent is 0.40.
Both the upward and downward earnings management is greater than Mining and Quarrying Industries and Communication and Culture Industries. The annual
earnings management of SHANGHAI ELECTRIC POWER CO., LTD. is the highest in
the industry.
During observation period the average earnings management of sample companies is 6.25E-09, suggesting that the whole industry executed an upward earnings management.
Table 2.3:Earnings Management Measurement in Power, Gas and Water Production and Supply Industries 2002-2009
Corporate
Name Year EDA
Corporate
Name Year EDA
Corporate
Name Year EDA
GUANGXI GUIGUAN ELECTRIC POWER CO.,LTD. 2002 -0.01795 CHONGQING THREE GORGES WATER CONSERVANCY AND ELECTRIC POWER CO.,LTD. 2002 0.035595 CHONGQING JIULONG ELECTRIC POWER CO.,LTD 2002 -0.014958 2003 0.030438 2003 0.024314 2003 0.0024987 2004 0.005867 2004 -0.08562 2004 0.0307792 2005 -0.01334 2005 -0.01908 2005 -0.003627 2006 0.0039 2006 0.001369 2006 -0.006341 2007 -0.02819 2007 0.01672 2007 -0.014064 2008 -0.00073 2008 0.011616 2008 -0.02078 2009 0.020003 2009 0.015081 2009 0.0264913 GD POWER DEVELOPMENT CO., LTD 2002 -0.03989 SHANGHAI ELECTRIC POWER CO.,LTD. 2002 -0.27258 TOP ENERGY CO.,LTD 2002 0.0144688 2003 0.049869 2003 -0.34402 2003 0.0860512 2004 -0.0689 2004 0.051283 2004 0.0388369 2005 -0.0619 2005 0.381531 2005 -0.058087 2006 -0.02484 2006 0.242686 2006 -0.088147 2007 -0.03224 2007 -0.33312 2007 0.0275613 2008 -0.02642 2008 -0.12518 2008 -0.014157 2009 0.204311 2009 0.39941 2009 -0.006528 HUADIAN POWER INTERNATION AL CO.,LTD. 2002 0.021555 SHENERGY CO.,LTD 2002 -0.0129 2003 -0.02872 2003 0.002409 2004 -0.03308 2004 0.035431 2005 0.030768 2005 -0.01499 2006 0.019901 2006 -0.03317 2007 -0.02004 2007 0.035471 2008 0.008897 2008 -0.00718 2009 0.000721 2009 -0.00508
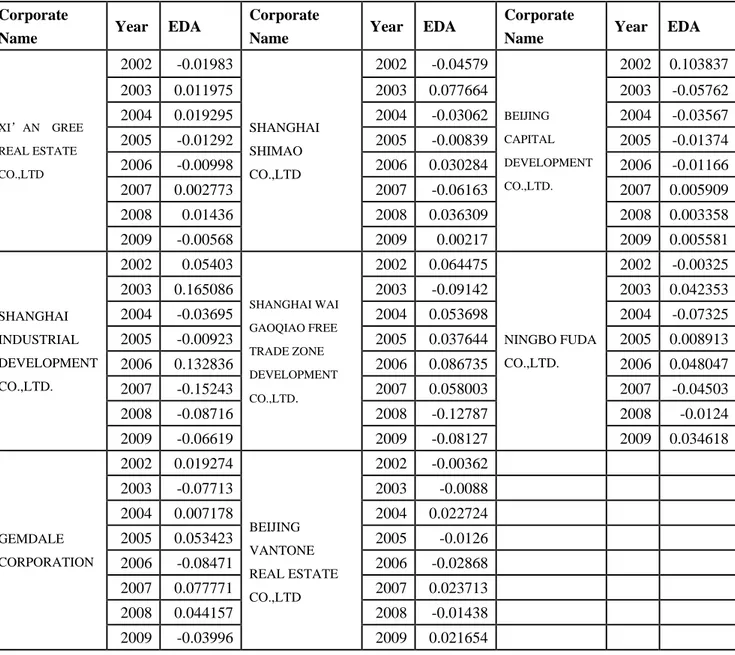
Earnings Management of Companies in Real Estate Industry
From the table below, we can see from 2002 to 2009 there are 32 observations in Real Estate Industry with negative EDA, suggesting the enterprises made downward earnings management, and the maximum extent is -0.15; while another 32 observations showing positive EDA, indicating enterprises made income-increasing earnings management and the maximum extent is 0.17.
The enterprise which made the maximum upward and downward earnings
management is the same firm—SHANGHAI INDUSTRIAL DEVELOPMENT CO., LTD.
During observation period the average earnings management of sample companies is 3.13E-08 suggesting that the whole industry executed an upward earnings management.
Table 2.4:Earnings Management Measurement in Real Estate Industry 2002-2009
Corporate
Name Year EDA
Corporate
Name Year EDA
Corporate
Name Year EDA
XI’AN GREE REAL ESTATE CO.,LTD 2002 -0.01983 SHANGHAI SHIMAO CO.,LTD 2002 -0.04579 BEIJING CAPITAL DEVELOPMENT CO.,LTD. 2002 0.103837 2003 0.011975 2003 0.077664 2003 -0.05762 2004 0.019295 2004 -0.03062 2004 -0.03567 2005 -0.01292 2005 -0.00839 2005 -0.01374 2006 -0.00998 2006 0.030284 2006 -0.01166 2007 0.002773 2007 -0.06163 2007 0.005909 2008 0.01436 2008 0.036309 2008 0.003358 2009 -0.00568 2009 0.00217 2009 0.005581 SHANGHAI INDUSTRIAL DEVELOPMENT CO.,LTD. 2002 0.05403 SHANGHAI WAI GAOQIAO FREE TRADE ZONE DEVELOPMENT CO.,LTD. 2002 0.064475 NINGBO FUDA CO.,LTD. 2002 -0.00325 2003 0.165086 2003 -0.09142 2003 0.042353 2004 -0.03695 2004 0.053698 2004 -0.07325 2005 -0.00923 2005 0.037644 2005 0.008913 2006 0.132836 2006 0.086735 2006 0.048047 2007 -0.15243 2007 0.058003 2007 -0.04503 2008 -0.08716 2008 -0.12787 2008 -0.0124 2009 -0.06619 2009 -0.08127 2009 0.034618 GEMDALE CORPORATION 2002 0.019274 BEIJING VANTONE REAL ESTATE CO.,LTD 2002 -0.00362 2003 -0.07713 2003 -0.0088 2004 0.007178 2004 0.022724 2005 0.053423 2005 -0.0126 2006 -0.08471 2006 -0.02868 2007 0.077771 2007 0.023713 2008 0.044157 2008 -0.01438 2009 -0.03996 2009 0.021654
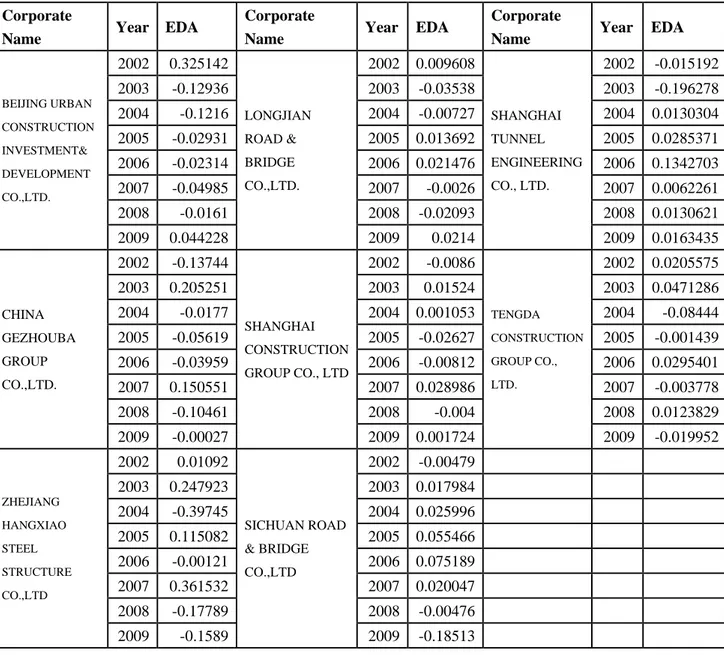
Earnings Management of Companies in Building Industry
From the table below, we can see from 2002 to 2009 there are 33 observations in Building Industry with negative EDA, suggesting the enterprises made downward earnings management, and the maximum extent is -0.40; while 31 observations
showing positive EDA, indicating enterprises made income-increasing earnings
management, and the maximum extent is 0.36.
Both the upward and downward earnings management is approximately at the same level as the Power, Gas and Water Production and Supply Industries. The
earnings management of ZHEJIANG HANGXIAO STEEL STRUCTURE CO., LTD. is the
highest in the industry.
During observation period the average earnings management of sample companies is 2.38E-07, suggesting that the whole industry executed an upward earnings management.
Table 2.5:Earnings Management Measurement in Building Industry 2002-2009
Corporate
Name Year EDA
Corporate
Name Year EDA
Corporate
Name Year EDA
BEIJING URBAN CONSTRUCTION INVESTMENT& DEVELOPMENT CO.,LTD. 2002 0.325142 LONGJIAN ROAD & BRIDGE CO.,LTD. 2002 0.009608 SHANGHAI TUNNEL ENGINEERING CO., LTD. 2002 -0.015192 2003 -0.12936 2003 -0.03538 2003 -0.196278 2004 -0.1216 2004 -0.00727 2004 0.0130304 2005 -0.02931 2005 0.013692 2005 0.0285371 2006 -0.02314 2006 0.021476 2006 0.1342703 2007 -0.04985 2007 -0.0026 2007 0.0062261 2008 -0.0161 2008 -0.02093 2008 0.0130621 2009 0.044228 2009 0.0214 2009 0.0163435 CHINA GEZHOUBA GROUP CO.,LTD. 2002 -0.13744 SHANGHAI CONSTRUCTION GROUP CO., LTD 2002 -0.0086 TENGDA CONSTRUCTION GROUP CO., LTD. 2002 0.0205575 2003 0.205251 2003 0.01524 2003 0.0471286 2004 -0.0177 2004 0.001053 2004 -0.08444 2005 -0.05619 2005 -0.02627 2005 -0.001439 2006 -0.03959 2006 -0.00812 2006 0.0295401 2007 0.150551 2007 0.028986 2007 -0.003778 2008 -0.10461 2008 -0.004 2008 0.0123829 2009 -0.00027 2009 0.001724 2009 -0.019952 ZHEJIANG HANGXIAO STEEL STRUCTURE CO.,LTD 2002 0.01092 SICHUAN ROAD & BRIDGE CO.,LTD 2002 -0.00479 2003 0.247923 2003 0.017984 2004 -0.39745 2004 0.025996 2005 0.115082 2005 0.055466 2006 -0.00121 2006 0.075189 2007 0.361532 2007 0.020047 2008 -0.17789 2008 -0.00476 2009 -0.1589 2009 -0.18513
Earnings Management of Companies in Transportation and Storage Industries
From the table below, we can see from 2002 to 2009 there are 33 observations in Transportation and Storage Industries with negative EDA, suggesting the enterprises made downward earnings management, and the maximum extent is -0.26; while 31 observations showing positive EDA, indicating enterprises made income-increasing earnings management, and the maximum extent is 0.33.
Both the upward and downward earnings management is little lower than the Power, Gas and Water Production and Supply Industries and Building Industry. The
earnings management of TIANJIN PORT (GROUP) CO., LTD., COSCO SHIPPING CO.,
LTD. and GUANGZHOU BAIYUN INTERNATIONAL AIRPORT CO., LTD. are relatively high in the industry.
During observation period the average earnings management of sample companies is -4.7E-09, suggesting that the whole industry executed a downward earnings management.
Table 2.6:Earnings Management Measurement in Transportation and Storage Industries, 2002-2009
Corporate
Name Year EDA
Corporate
Name Year EDA
Corporate
Name Year EDA
GUANGZHOU BAIYUN INTERNATIONAL AIRPORT CO.,LTD. 2002 0.107145 JIANGSU EXPRESSWAY CO.,LTD 2002 0.010995 XIAMEN INTERNATIONAL AIRPORT CO.,LTD. 2002 0.0025981 2003 0.043632 2003 -0.03074 2003 0.0008622 2004 -0.13883 2004 0.01915 2004 -0.012494 2005 0.02457 2005 0.018276 2005 0.0053858 2006 0.046271 2006 -0.01521 2006 0.0073383 2007 -0.04163 2007 0.030904 2007 -0.009009 2008 -0.13014 2008 -0.03248 2008 -0.026733 2009 0.088977 2009 -0.0009 2009 0.0320519 CHINA EASTERN AIRLINES CO.,LTD. 2002 -0.00531 TIANJIN PORT(GROUP) CO., LTD. 2002 0.273031 COSCO SHIPPING CO.,LTD. 2002 0.0341034 2003 -0.03247 2003 -0.02557 2003 -0.11897 2004 -0.06513 2004 -0.26216 2004 -0.176375 2005 0.034469 2005 0.040488 2005 0.0473393 2006 -0.00296 2006 -0.25821 2006 0.0745219 2007 0.003045 2007 -0.08307 2007 0.0552685 2008 -0.04838 2008 -0.0118 2008 0.1251472 2009 0.116742 2009 0.327295 2009 -0.041035 SHANGHAI JIN JIANG INTERNATIONAL INDUSTRIAL INVESTMENT CO.,LTD 2002 -0.02671 CHINA RAILWAY TIELONG CONTAINER LOGISTICS CO., LTD. 2002 0.076827 2003 0.019564 2003 -0.00491 2004 0.061263 2004 0.015125 2005 -0.0228 2005 -0.02231 2006 -0.0054 2006 -0.05802 2007 -0.04231 2007 -0.0718 2008 -0.03722 2008 0.076314 2009 0.053605 2009 -0.01123
Earnings Management of Companies in Farming, Forestry, Animal Husbandry and Fishery Industries
From the table below, we can see from 2002 to 2009 there are 30 observations in Farming, Forestry, Animal Husbandry and Fishery Industries with negative EDA, suggesting the enterprises made downward earnings management, and the maximum extent is -0.15; while 34 observations showing positive EDA, indicating enterprises
made income-increasingearnings management, and the maximum extent is 0.097.
The upward and downward earnings management of DAHU AGRICULTURE CO.,
LTD. is relatively high.
During observation period the average earnings management of sample companies is 1.61E-07, suggesting that the whole industry executed an upward earnings management.
Table 2.7:Earnings Management Measurement in Farming, Forestry, Animal Husbandry and Fishery Industries, 2002-2009
Corporate
Name Year EDA
Corporate
Name Year EDA
Corporate
Name Year EDA
HEILONGJIANG AGRICULTURE CO.,LTD. 2002 0.043544 HUNAN NEW WELLFUL CO.LTD. 2002 0.008027 SICHUAN HEJIA CO.LTD. 2002 0.006818 2003 -0.10329 2003 -0.00175 2003 -0.00058 2004 0.061204 2004 0.025463 2004 -0.00424 2005 0.0128 2005 -0.02943 2005 -0.00709 2006 0.002249 2006 -0.0929 2006 0.016067 2007 -0.01589 2007 0.08982 2007 0.014595 2008 -0.03188 2008 0.013911 2008 -0.01349 2009 0.031255 2009 -0.01314 2009 -0.01207 DAHU AGRICULTURE CO.,LTD. 2002 0.023234 GANSU YASHENG INDUSTRIAL (GROUP) CO.,LTD 2002 0.001389 SHANGHAI KAICHUANG MARINE INTERNATIONAL CO.,LTD 2002 -0.01012 2003 0.030611 2003 -0.00314 2003 -0.05752 2004 -0.03053 2004 -0.01705 2004 0.063547 2005 -0.0222 2005 -0.01265 2005 -0.00066 2006 -0.0045 2006 -0.01256 2006 -0.04512 2007 0.051193 2007 0.019213 2007 0.097482 2008 0.095032 2008 0.014752 2008 -0.11198 2009 -0.14284 2009 0.010051 2009 0.064365 TONGWEI CO.,LTD 2002 0.052486 XINJIANG TIANYE CO.,LTD. 2002 0.023914 2003 0.008171 2003 -0.15434 2004 -0.05433 2004 0.063552 2005 0.014493 2005 0.086975 2006 -0.135 2006 -0.00811 2007 0.048494 2007 -0.03073 2008 0.054329 2008 0.007857 2009 0.011357 2009 0.010884
Earnings Management of Companies in Wholesale and Retail Trade Industries
From the table below, we can see from 2002 to 2009 there are 37 observations in Wholesale and Retail Trade Industries with negative EDA, suggesting the enterprises made downward earnings management, and the maximum extent is -0.21; while 27 observations showing positive EDA, indicating enterprises made income-increasing earnings management and the maximum extent is 0.51.
The upward and downward earnings management of SHANGHAI NEW WORLD
CO., LTD. is highest (its upward earnings management is even higher), followed by
SINOCHEM INTERNATIONAL CORPORATION.
During observation period the average earnings management of sample companies is -1.3E-08, suggesting that the whole industry executed a downward earnings management.
Table 2.8:Earnings Management Measurement in Wholesale and Retail Trade Industries, 2002-2009
Corporate
Name Year EDA
Corporate
Name Year EDA
Corporate
Name Year EDA
SHANGHAI BAILIAN GROUP CO.,LTD. 2002 -0.01088 XIAMEN INTERNATIONAL TRADE GROUP CO., LTD. 2002 -0.01224 CNTIC TRADING CO., LTD. 2002 0.0260869 2003 -0.02925 2003 0.025056 2003 -0.047978 2004 0.022338 2004 0.083504 2004 0.0221596 2005 -0.0039 2005 -0.09156 2005 0.0085759 2006 0.004409 2006 -0.02379 2006 -0.023086 2007 0.026972 2007 0.031491 2007 0.0158818 2008 -0.0079 2008 -0.0269 2008 -7.03E-06 2009 -0.00179 2009 0.01444 2009 -0.001633 SHANGHAI LANSHENG CORPORATION 2002 0.007846 SHANGHAI NEW WORLD CO.,LTD. 2002 -0.01637 SINOCHEM INTERNATIONAL CORPORATION 2002 -0.029427 2003 -0.01217 2003 -6.2E-05 2003 0.0831143 2004 0.069125 2004 0.098902 2004 0.1264609 2005 -0.01125 2005 -0.05323 2005 -0.116448 2006 -0.06879 2006 -0.20838 2006 -0.171853 2007 0.024899 2007 -0.15035 2007 -0.030385 2008 0.016442 2008 0.509986 2008 -0.028778 2009 -0.0261 2009 -0.18049 2009 0.1673154 BEIJING WANGFUJING DEPARTMENT STORE (GROUP)CO.,LTD. 2002 -0.01958 SHANGHAI FRIENDSHIP GROUP INCORPORATED COMPANY 2002 0.012433 2003 0.063678 2003 -0.00898 2004 -0.05378 2004 -0.00169 2005 0.012859 2005 -0.01624 2006 -0.03258 2006 -0.00252 2007 0.059862 2007 0.005439 2008 0.012386 2008 0.016936 2009 -0.04285 2009 -0.00538
Earnings Management of Companies in Social Service Industry
From the table below, we can see from 2002 to 2009 there are 36 observations in Social Service Industry with negative EDA, suggesting the enterprises made downward earnings management, and the maximum extent is -0.52; while 28 observations showing positive EDA, indicating enterprises made income-increasing earnings management and the maximum extent is 1.12.
Both the upward and downward earnings management is at the highest
level over 12 Industries. The earnings management of TIANJIN CAPITAL
ENVIRONMENTAL GROUP PROTECTION CO., LTD. and HUANGSHAN TOURISM DEVELOPMENT CO., LTD. is relatively high in the industry.
During observation period the average earnings management of sample companies is -6.2E-08, suggesting that the whole industry executed a downward earnings management.
Table 2.9:Earnings Management Measurement in Social Service Industry, 2002-2009
Corporate
Name Year EDA
Corporate
Name Year EDA
Corporate
Name Year EDA
TIANJIN CAPITAL ENVIRONMENTAL GROUP PROTECTION CO., LTD. 2002 -0.46809 SHANGHAI JINJIANG INTERNATIO NAL HOTELS DEVELOPME NT CO.,LTD. 2002 0.026932 BEIJING CAPITAL CO.,LTD 2002 -0.03777 2003 1.120592 2003 0.046065 2003 -0.00027 2004 -0.12676 2004 -0.00436 2004 -0.06386 2005 0.096181 2005 -0.03351 2005 -0.01418 2006 -0.08995 2006 0.010717 2006 -0.00467 2007 -0.39796 2007 -0.03142 2007 0.117963 2008 -0.05853 2008 -0.00155 2008 0.008654 2009 -0.07549 2009 -0.01288 2009 -0.00587 DAZHONG TRANSPORTATIO N(GROUP) CO.,LTD. 2002 0.008243 CHINA UNITED TRAVEL COMPANY LIMITED 2002 -0.02405 SHANDONG EXPRESSWA Y COMPANY LIMITED 2002 -0.05575 2003 -0.04774 2003 0.082543 2003 0.008243 2004 0.019625 2004 0.000631 2004 -0.09339 2005 0.01688 2005 0.041739 2005 0.274449 2006 -0.01109 2006 -0.04667 2006 -0.10691 2007 -0.00906 2007 -0.03106 2007 0.06646 2008 0.018317 2008 0.020306 2008 0.009148 2009 0.00482 2009 -0.04344 2009 -0.10225 HUANGSHAN TOURISM DEVELOPMENT CO.,LTD. 2002 -0.51836 SHANGHAI QIANGSHEN G HOLDING CO.,LTD. 2002 0.007225 2003 0.172258 2003 0.005612 2004 0.024754 2004 0.067523 2005 0.321843 2005 -0.05983 2006 0.444827 2006 -0.0716 2007 -0.18842 2007 -0.03551 2008 -0.12342 2008 0.090564 2009 -0.13349 2009 -0.00398
Earnings Management of Companies in Information Technology Industry
From the table below, we can see from 2002 to 2009 there are 34 observations in Information Technology Industry with negative EDA, suggesting the enterprises made downward earnings management, and the maximum extent is -0.34; while 30 observations showing positive EDA, indicating enterprises made income-increasing earnings management, and the maximum extent is 0.59.
The earnings management of SHANGHAI EAST-CHINA COMPUTER CO., LTD,
and FUJIAN START GROUP CO. LTD. is relatively high in the industry.
During observation period the average earnings management of sample companies is 4.69E-09, suggesting that the whole industry executed an upward earnings management.
Table 2.10:Earnings Management Measurement in Information Technology Industry, 2002-2009
Corporate
Name Year EDA
Corporate
Name Year EDA
Corporate
Name Year EDA
WUHAN YANGTZE COMMUNIC ATION INDUSTRY GROUP CO.,LTD 2002 0.018333 JIANGSU HONGTU HIGH TECHNOLOGY CO.,LTD 2002 -0.09111 FUJIAN START GROUP CO. LTD. 2002 -0.191322 2003 0.002604 2003 0.006064 2003 0.0931483 2004 0.029573 2004 0.044271 2004 -0.070806 2005 -0.01963 2005 -0.01192 2005 -0.054493 2006 -0.02495 2006 0.049741 2006 -0.083861 2007 0.045274 2007 0.07401 2007 0.5939111 2008 -0.00024 2008 -0.014 2008 -0.212498 2009 -0.05097 2009 -0.05705 2009 -0.07408 FOUNDER TECHNOLOG Y GROUP CORP. 2002 0.035847 SHANGHAI EAST-CHINA COMPUTER CO.,LTD 2002 0.174536 CHINA UNITED NETWORK COMMUNICAT IONS LIMITED 2002 0.0278581 2003 0.095485 2003 -0.00966 2003 -0.081031 2004 -0.16631 2004 -0.04098 2004 -0.155165 2005 -0.02516 2005 -0.33907 2005 0.0301986 2006 0.084442 2006 0.244478 2006 0.040878 2007 -0.03047 2007 -0.15168 2007 0.0821606 2008 0.037168 2008 0.157214 2008 0.0447338 2009 -0.031 2009 -0.03484 2009 0.0103663 SHANGHAI FEILO CO.,LTD. 2002 0.076518 SHANGHAI POTEVIO CO.,LTD. 2002 0.026421 2003 -0.03838 2003 0.003821 2004 -0.01521 2004 -0.03827 2005 -0.01515 2005 -0.01456 2006 0.056589 2006 -0.00838 2007 0.049933 2007 0.029961 2008 -0.02281 2008 0.026778 2009 -0.09149 2009 -0.02577
Earnings Management of Companies in Manufacturing Industry
From the table below, we can see from 2002 to 2009 there are 34 observations in Manufacturing Industry with negative EDA, suggesting the enterprises made downward earnings management, and the maximum extent is -0.14; while 30 observations showing positive EDA, indicating enterprises made income-increasing earnings management, and the maximum extent is 0.17.
The earnings management of LAO FENG XIANG CO., LTD. and NINGBO
SHANSHAN CO., LTD. is relatively high in the industry.
During observation period the average earnings management of sample companies is 8.67E-19, suggesting that the whole industry executed an upward earnings management, but with tiny level.
Table 2.11:Earnings Management Measurement in Manufacturing Industry, 2002-2009
Corporate
Name Year EDA
Corporate
Name Year EDA
Corporate
Name Year EDA
SHANGHAI FOSUN PHARMACEUTI CAL (GROUP) CO.,LTD. 2002 -0.06274 HENAN LIANHUA GOURMET POWDER CO.LTD. 2002 0.018222 NINGBO SHANSHAN CO.,LTD. 2002 0.0739108 2003 0.097457 2003 -0.03439 2003 -0.011484 2004 -0.05897 2004 -0.00564 2004 -0.128137 2005 0.035155 2005 -0.00128 2005 0.0124865 2006 0.050361 2006 -0.00577 2006 -0.010159 2007 -0.01492 2007 0.014323 2007 0.0628653 2008 0.051356 2008 0.000181 2008 0.1282138 2009 -0.0977 2009 0.014358 2009 -0.127697 BRIGHT DAIRY & FOOD CO.,LTD 2002 -0.02018 QINGDAO HAIER CO., LTD 2002 0.031104 CHINA CSSC HOLDINGS LIMITED 2002 0.0877412 2003 0.007422 2003 -0.01475 2003 0.0273623 2004 0.017047 2004 0.049655 2004 0.0102784 2005 -0.01923 2005 -0.00557 2005 -0.043492 2006 -0.01873 2006 -0.06672 2006 -0.073768 2007 -0.00994 2007 -0.03171 2007 -0.016542 2008 0.010803 2008 0.016082 2008 0.0126409 2009 0.032807 2009 0.021917 2009 -0.004221 LAO FENG XIANG CO.,LTD. 2002 0.171288 SANY HEAVY INDUSTRY CO.,LTD 2002 -0.05337 2003 -0.13671 2003 -0.04478 2004 -0.00368 2004 0.009308 2005 -0.03676 2005 -0.03884 2006 -0.02801 2006 0.049746 2007 -0.00141 2007 0.082071 2008 -0.05754 2008 0.007061 2009 0.092824 2009 -0.0112