Optimising Drone Image Acquisition and Analysis for Mapping Horticultural Tree Crops
Yu-Hsuan Tu
BSc and MSc in Resources Engineering
A thesis submitted for the degree of Doctor of Philosophy at The University of Queensland in 2019
i
Multi-spectral imagery captured from drones, also known as remote piloted aircraft systems (RPAS) or unmanned aerial systems (UAS), is becoming increasingly popular for the non-invasive monitoring and managing of various horticultural crops. However, being highly configurable systems, variations in the way the drone data are collected, corrected and analysed can have serious implications on its accuracies for measuring and predicting parameters of tree structure and condition. Many studies have identified that different data acquisition parameters such as image overlap, flying altitude, radiometric and geometric corrections can influence the integrity of the image data. Yet, little quantification of these effects nor the establishment of best practice for multi-spectral drone imagery data collection has been established.
To address the knowledge gaps, this thesis developed a workflow that identifies optimal procedures for the acquisition, correction, and extraction of spectral data from a drone when used to measure the condition and structural properties of horticultural tree crops. It consisted three objectives: (1) to determine the optimal data collection protocols for acquiring multi-spectral drone imagery over horticulture tree crops; (2) to determine the optimal correction methods for multi-spectral drone image data for acquiring imagery over horticultural tree crops; and (3) to determine the accuracies of measuring and mapping canopy structural properties and condition of a horticultural tree crop using multi-spectral drone imagery. Twenty-seven flights were conducted with different combinations of flight plan variables to acquire images over an avocado orchard. The images were processed, corrected, and extracted and compare with the in-situ measured tree structures to determine the accuracies. The influences of flight plan variables on accuracies were calculated using partial least square regressions. Temporal near-coincident image products with different correction approaches were compared using box-and-whisker comparison to assess the radiometric characteristics. The highly correlated image-derived tree structures were imported into a random forest classifier to rank the avocado tree condition to a modified Ciba-Geigy scale and compared with the in-situ assessed condition.
More specifically, this study: (1) determined the impacts of different flight variable combinations and data acquisition settings on data integrity; (2) determined the influence different image correction approaches have on data integrity; (3) developed an optimal workflow from the first two outputs that may serve as one possible standard for future drone data acquisitions over tree crops; and (4) integrate the learnings achieved from the three
ii structure and condition of individual avocado trees. The main findings of this thesis were:
Five recommendations for acquiring multi-spectral drone imagery over horticulture tree crops. These included: (1) flying direction along the hedgerow; (2) using a smaller image pitch angle; (3) the effect of flying speed is uncertain, but it should be considered incorporated with the image input/output limit for sufficient image forward overlap; (4) ensuring a high solar elevation at the time of image capture; and (5) set image forward overlap as high as possible (>80%). The final recommendation was considered to be of the highest importance.
An image side-lap of between 70% and 80% was identified to be optimal in terms of maximising the quality of point cloud density and structure estimation accuracy. The optimal altitude was suggested based on different flying scenarios, should also be considered based on the requirement of pixel ground sample distance (GSD).
The radiometric characteristics of multi-spectral drone imagery are complicated due to the image acquisition process from image collection to corrections. There is a potential to achieve accurate radiometric correction by solving the solar-surface-viewing geometry to produce accurate bidirectional reflectance distribution function (BRDF) and applying an accurate sensor energy-to-signal conversion equation with simultaneous irradiance measurements.
For the remote measure of tree structure and condition (plant projective cover), tree height and a combination of mean and standard deviation of near-infrared (NIR) digital number (DN), the grey level co-occurrence matrices (GLCMs) of standard deviation, homogeneity, dissimilarity, and contrast of NIR band were found to be accurate. A random forest classification of these extracted canopy attributes was 98% accurate in ranking avocado tree condition to a modified Ciba-Geigy scale from 1 to 4, representing excellent condition to fair condition.
This thesis fills an essential knowledge gap by determining the basic influences of acquisition and processing protocols on the accuracy of final drone image products. The findings contribute to the fundamental understanding of optimal settings for multi-spectral drone imagery acquisition to maximise the accuracy of output spatial data products to be used for horticulture crop management.
iii
This thesis is composed of my original work, and contains no material previously published or written by another person except where due reference has been made in the text. I have clearly stated the contribution by others to jointly-authored works that I have included in my thesis.
I have clearly stated the contribution of others to my thesis as a whole, including statistical assistance, survey design, data analysis, significant technical procedures, professional editorial advice, financial support and any other original research work used or reported in my thesis. The content of my thesis is the result of work I have carried out since the commencement of my higher degree by research candidature and does not include a substantial part of work that has been submitted to qualify for the award of any other degree or diploma in any university or other tertiary institution. I have clearly stated which parts of my thesis, if any, have been submitted to qualify for another award.
I acknowledge that an electronic copy of my thesis must be lodged with the University Library and, subject to the policy and procedures of The University of Queensland, the thesis be made available for research and study in accordance with the Copyright Act 1968 unless a period of embargo has been approved by the Dean of the Graduate School.
I acknowledge that copyright of all material contained in my thesis resides with the copyright holder(s) of that material. Where appropriate I have obtained copyright permission from the copyright holder to reproduce material in this thesis and have sought permission from co-authors for any jointly authored works included in the thesis.
iv Manuscript citation – incorporated as Chapter 2.
TU, Y.-H., PHINN, S., JOHANSEN, K., ROBSON, A., & WU, D. 2019. Optimising Drone Flight Planning for Measuring Horticultural Tree Crop Structure. Manuscript submitted to ISPRS Journal of Photogrammetry and Remote Sensing for publication.
Contributors Statement of contribution
Yu-Hsuan Tu Data processing and analysis (95%)
Research direction and manuscript review (65%) Stuart Phinn Research direction and manuscript review (10%) Kasper Johansen Research direction and manuscript review (10%) Andrew Robson Research direction and manuscript review (10%)
Dan Wu Data processing and analysis (5%)
Manuscript review (5%) Publications included in this thesis
Publication citation – incorporated as Chapter 3.
TU, Y.-H., PHINN, S., JOHANSEN, K. & ROBSON, A. 2018. Assessing Radiometric Correction Approaches for Multi-Spectral UAS Imagery for Horticultural Applications.
Remote Sensing, 10, 1684. DOI: 10.3390/rs10111684.
Contributors Statement of contribution
Yu-Hsuan Tu Data processing and analysis (100%)
Research direction and manuscript review (60%) Stuart Phinn Research direction and manuscript review (15%) Kasper Johansen Research direction and manuscript review (15%) Andrew Robson Research direction and manuscript review (10%) Publication citation – incorporated as Chapter 4.
TU, Y.-H., JOHANSEN, K., PHINN, S. & ROBSON, A. 2019. Measuring Canopy Structure and Condition Using Multi-Spectral UAS Imagery in a Horticultural Environment.
Remote Sensing, 11. DOI: 10.3390/rs11030269.
Contributors Statement of contribution
Yu-Hsuan Tu Data processing and analysis (100%)
Research direction and manuscript review (60%) Stuart Phinn Research direction and manuscript review (10%) Kasper Johansen Research direction and manuscript review (20%) Andrew Robson Research direction and manuscript review (10%)
v Conference proceedings
TU, Y.-H., PHINN, S., JOHANSEN, K. & ROBSON, A. Assessing Radiometric Corrections for UAS Multi-Spectral Imagery in Horticultural Environments. IGARSS 2018 - 2018 IEEE International Geoscience and Remote Sensing Symposium, 22-27 July 2018. 5449-5452. DOI: 10.1109/IGARSS.2018.8517703.
Contributions by others to the thesis
Professor Stuart Phinn, Dr Kasper Johansen, and Professor Andrew Robson, through their advisory role, contributed to the resources, conception and design of the research as well as providing editing and revision of papers and this thesis.
Statement of parts of the thesis submitted to qualify for the award of another degree No works submitted towards another degree have been included in this thesis.
Research Involving Human or Animal Subjects
No animal or human subjects were involved in this research. The drone system we used in this study weighted approximately 1.6 kg, which is categorised as sub 2 kg drones for business use according to the regulation made by Civil Aviation Safety Authority (CASA) in Australia. Kasper Johansen, who holds both remote pilot licence (RePL) and remotely piloted aircraft operator’s certificate (ReOC), is the pilot and chief pilot of the drone campaign. No controlled aerodrome nearby the study site. No people except research team member in the study site when the drone campaign was conducted. The approval for the drone campaign was acquired from the land owner or manager and the notification form was submitted to CASA before the drone campaign. All the flights was conducted within the visual line of sight as regulated.
vi
First of all, I would like to honour this thesis for my supervisors, Professor Stuart Phinn, Dr Kasper Johansen, and Professor Andrew Robson. Their guidance and support during the candidature are the most valuable treasures that made this research possible. I gained so much knowledge and professional skills when doing research with them. Their focuses are not only on gaps in knowledge of academia, but also solutions to real world problems for the industry. I hope that I can carry such spirit and continually contribute to the knowledge of related disciplines on the path of my future career.
The Department of Agriculture and Water Resources of Australian Government and Horticulture Innovation Australia are acknowledged for funding this research project. The tuition fee waiver, fieldwork cost, publication fees, and conference travel allowance were all funded by the Australian Federal Governments ‘Rural R&D for Profit’ scheme, under the project “Multi-Scale Monitoring Tools for Managing Australia Tree Crops - Industry Meets Innovation”. Also, thanks to Professor Stuart Phinn, Dr Chris Roelfsema and A/Professor Yan Liu for provision of tutor and RA opportunities to allow me to support my living costs. Special thanks to the interest-free loan for studying overseas sponsored by the Taipei City Government, and the support from my family that allowed me to start enrolling my candidature before obtaining the scholarship.
I would like to acknowledge the help from local farmers, especially Chad Simpson from Simpson Farm and E.E Muir & Sons Pty. Ltd., and Christopher Searle from MacAvo Consulting. I would also like to thank Dan Wu and Aaron Aeberli for the support during the fieldwork. Special thanks to Dr Hui Xiao from the University of Queensland, and Dr Peter Scarth from the Joint Remote Sensing Research Program for statistic and mathematic problems, and Alexey Pasumansky from the official Agisoft online forum for helping to answer my questions regarding the process of Agisoft MetaShape Pro.
I would like to extend the sincere thanks to all the friendly staff and colleagues in the School of Earth and Environmental Sciences, especially the people in the Remote Sensing Research Centre. This list includes but is not limited to Ralph Trancoso da Silva, Jiban Chandra Deb, Muhammad Hoque, Danang Surya Candra, Denise Perez, Jeremy Sofonia, Dan Wu, Aaron Aeberli, Chunyue Niu, Doddy Yuwono, Jenny Mahuika, Atefeh Sansoleimani, Sarah Lowe, Ana Patricia Ruiz Beltran, Eva Kovacs, Zunyi Xie, Daniel Harris, Rodney Borrego-Acevedo, Lucia Morales Barquero, and Joanne Edkins.
Finally, I would like to express my sincere gratitude to my family and my partner. Their support and encouragements are the lightest shines in the overwhelming storms of knowledge.
vii
This research was funded by Department of Agriculture and Water Resources, Australian Government and Horticulture Innovation Australia as part of its Rural R&D for Profit Program’s subproject “Multi-Scale Monitoring Tools for Managing Australia Tree Crops - Industry Meets Innovation” [grant number RnD4Profit-14-01-008].
Keywords
drone, remote piloted aircraft system, unmanned aerial system, tree crop, avocado trees, horticulture, structure measurement, radiometric correction, flight planning, optimisation
Australian and New Zealand Standard Research Classifications (ANZSRC) ANZSRC code: 070104, Agricultural Spatial Analysis and Modelling, 50% ANZSRC code: 090905, Photogrammetry and Remote Sensing, 40% ANZSRC code: 091503, Engineering Practice, 10%
Fields of Research (FoR) Classification
FoR code: 0701, Agriculture, Land and Farm Management, 50% FoR code: 0909, Geomatic Engineering, 40%
viii
DECLARATION BY AUTHOR ... III SUBMITTED MANUSCRIPTS INCLUDED IN THIS THESIS ... IV PUBLICATIONS INCLUDED IN THIS THESIS ... IV OTHER PUBLICATIONS DURING CANDIDATURE ... V CONTRIBUTIONS BY OTHERS TO THE THESIS ... V STATEMENT OF PARTS OF THE THESIS SUBMITTED TO QUALIFY FOR THE AWARD OF ANOTHER DEGREE ... V RESEARCH INVOLVING HUMAN OR ANIMAL SUBJECTS ... V ACKNOWLEDGEMENTS ... VI FINANCIAL SUPPORT ... VII KEYWORDS ... VII AUSTRALIAN AND NEW ZEALAND STANDARD RESEARCH CLASSIFICATIONS (ANZSRC) ... VII FIELDS OF RESEARCH (FOR) CLASSIFICATION ... VII TABLE OF CONTENTS ... VIII LIST OF FIGURES AND TABLES ... X FIGURES ... X TABLES... XII LIST OF ABBREVIATIONS ... XIII
CHAPTER 1: INTRODUCTION AND RESEARCH SIGNIFICANCE ... 1
1.1. BACKGROUND ... 2
1.2. RESEARCH AIM AND OBJECTIVES ... 9
1.3. OUTLINE OF HESIS ... 9
CHAPTER 2: OPTIMISING FLIGHT PLANNING FOR MEASURING HORTICULTURAL TREE CROP STRUCTURE ... 12
2.1. INTRODUCTION ... 13
2.2. MATERIALS AND METHODS ... 15
2.2.1.STUDY SITE ... 15
2.2.2.FIELD MEASUREMENTS ... 15
2.2.3.UASIMAGE ACQUISITION ... 16
2.2.4.IMAGE PRE-PROCESSING:GEOMETRIC ... 18
2.2.5.IMAGE PRE-PROCESSING:RADIOMETRIC ... 18
2.2.6.EXTRACTION OF INFORMATION FOR INDIVIDUAL TREES ... 19
2.2.7.ASSESSMENT OF INFORMATION QUALITY EXTRACTED FOR INDIVIDUAL TREES ... 20
2.2.8.ANALYSING THE EFFECT OF IMAGE ACQUISITION VARIABLES ... 21
2.2.9.OPTIMAL FLIGHT PLAN SIMULATION ... 23
2.3. RESULTS ... 24
2.3.1.THE INFLUENCE OF FLIGHT VARIABLES ON DATA QUALITY ... 24
2.3.1.1. The Effect of Flight Altitude ... 26
2.3.1.2. The Effect of Image Side-lap ... 27
2.3.1.3. The Effect of Flight Direction ... 27
2.3.1.4. The Effect of Flying Speed ... 28
2.3.1.5. The Effect of Solar Elevation ... 30
2.3.2.OPTIMAL SETTINGS FOR TREE CROP STRUCTURE MEASUREMENTS ... 30
2.3.2.1. Optimal Setting for Scenario 1 ... 31
2.3.2.2. Optimal Setting for Scenario 2 ... 32
2.3.2.3. Optimal Setting for Scenario 3 ... 34
2.4. DISCUSSION ... 35
2.5. CONCLUSION ... 38
CHAPTER 3: ASSESSING RADIOMETRIC CORRECTION APPROACHES FOR HORTICULTURAL APPLICATIONS ... 39
3.1. INTRODUCTION ... 40
ix
3.2.2.UASDATA ACQUISITION ... 42
3.2.3.IMAGE PRE-PROCESSING ... 43
3.2.3.1. Geometric Correction and Initial Pre-Processing ... 43
3.2.3.2. Producing Analysis-Ready Data ... 44
3.2.3.3. Correcting for Solar and Viewing Geometries Within and Between Images—Bidirectional Reflectance Distribution Function (BRDF) ... 47
3.2.4.ASSESSMENT OF CANOPY REFLECTANCE CONSISTENCY ... 48
3.3. RESULTS ... 49
3.3.1.REFLECTANCE CONSISTENCY ASSESSMENT OF AVOCADO IMAGERY ... 50
3.3.2.CORRECTION CONSISTENCY ASSESSMENT OF BANANA IMAGERY ... 51
3.3.3.BRDFCORRECTION CONSISTENCY ASSESSMENT ... 52
3.4. DISCUSSION ... 55
3.4.1.THE INFLUENCES OF FLIGHT ALTITUDE AND IMAGE SCALE ... 55
3.4.2.THE INFLUENCE OF CANOPY GEOMETRIC COMPLEXITY ON REFLECTANCE CONSISTENCY ... 56
3.4.3.THE LIMITATION OF SIMPLIFIED EMPIRICAL CORRECTION ... 56
3.4.4.UASBASED IRRADIANCE MEASUREMENTS ... 57
3.4.5.PROPOSED BRDFCORRECTION ... 57
3.4.6.POTENTIAL OF SENSOR-INFORMATION-BASED CALIBRATION ... 58
3.5. CONCLUSIONS ... 59
CHAPTER 4: MEASURING CANOPY STRUCTURE AND CONDITION IN A HORTICULTURAL ENVIRONMENT ... 61
4.1. INTRODUCTION ... 62
4.2. MATERIALS AND METHODS ... 64
4.2.1.STUDY SITES ... 64
4.2.2.FIELD DATA ... 65
4.2.3.UASDATA ACQUISITION ... 66
4.2.4.IMAGE PRE-PROCESSING ... 67
4.2.5.PRODUCING ANALYSIS READY DATA ... 68
4.2.6.INDIVIDUAL TREE CROWN DELINEATION AND STRUCTURAL ATTRIBUTE ESTIMATION ... 69
4.2.7.CANOPY CONDITION RANKING ... 71
4.3. RESULTS ... 72
4.3.1.ACCURACY OF CHM-DERIVED TREE HEIGHT ... 72
4.3.2.ACCURACY OF IMAGE-DERIVED CROWN WIDTH AND LENGTH ... 73
4.3.3.PPCCORRELATION ... 74
4.3.4.TREE CONDITION PREDICTION ... 75
4.4. DISCUSSION ... 78
4.5. CONCLUSIONS ... 81
CHAPTER 5: CONCLUSIONS, SIGNIFICANCE AND FUTURE RESEARCH ... 83
5.1. OVERVIEW ... 84
5.2. MAIN FINDINGS AND OUTCOMES ... 84
5.3. RECOMMENDATIONS OF MEASURING TREE CROPS USING MULTI-SPECTRAL DRONE IMAGERY ... 87
5.4. LIMITATION AND FUTURE RESEARCH DIRECTIONS ... 88
5.5. CONCLUSION ... 92
REFERENCES ... 94
APPENDICES ... 102
APPENDIX A. BOX-AND-WHISKER COMPARISON RESULTS OF AVOCADO DATASETS ... 102
APPENDIX B. BOX-AND-WHISKER COMPARISON RESULTS OF BANANA DATASETS ... 104
x Figures
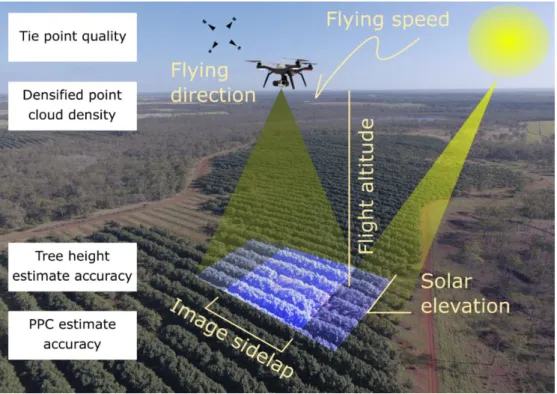
FIGURE 2.1.CONCEPTUAL DIAGRAM OF THE RESEARCH OBJECTIVE, WHICH DESCRIBES THE INDEPENDENT (ALTITUDE,
SIDE-LAP, SPEED, ETC., WRITTEN IN YELLOW COLOUR) AND DEPENDENT (QUALITY INDICATORS MENTIONED ABOVE, REPRESENTING THE QUALITY OF EACH STEP OF THE WORKFLOW, SHOWN IN WHITE BOXES) VARIABLES OF BAND INTEREST. ... 20
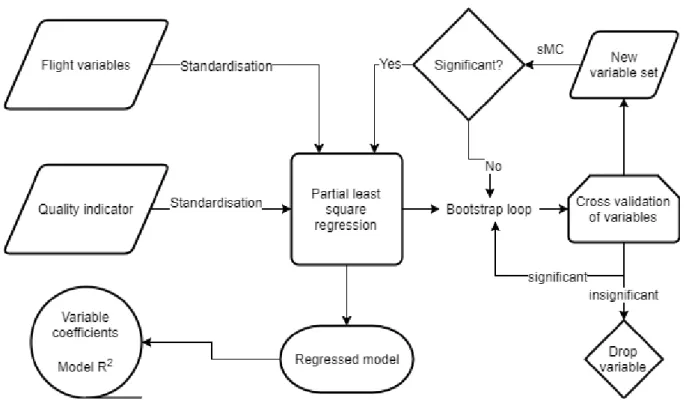
FIGURE 2.2.THE WORKFLOW OF THE PARTIAL LEAST SQUARE REGRESSION IN THIS STUDY. ... 23
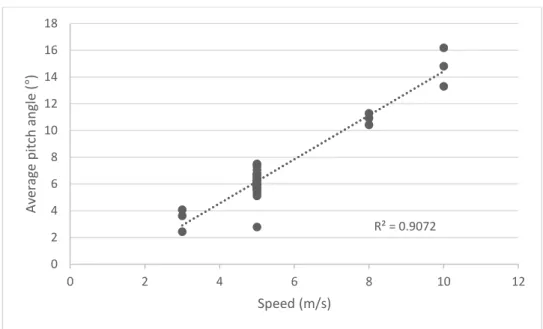
FIGURE 2.3.THE SCATTER PLOT OF FLYING SPEED VERSUS AVERAGE IMAGE PITCH ANGLE.IT SHOWS A HIGH
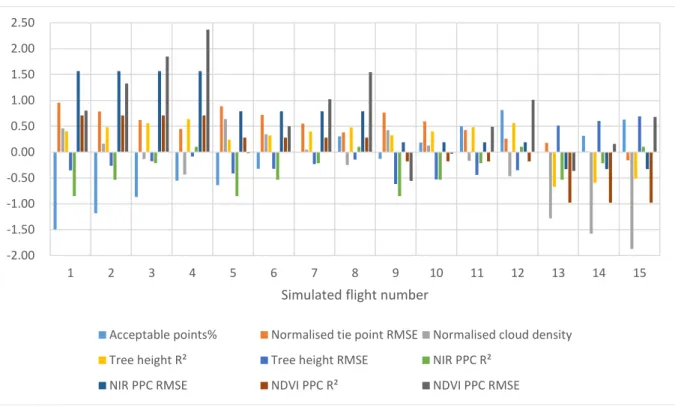
CORRELATION (R2=0.9) BETWEEN THESE TWO VARIABLES WHEN PHOTOS ARE CAPTURED WITHOUT A GIMBAL. 29 FIGURE 2.4.PREDICTED STANDARDISED QUALITY INDICATORS FOR SCENARIO 1.THE Y AXIS IS THE STANDARDISED
VALUE OF QUALITY INDICATORS, WHICH ONLY SHOWS THE RELATIVE QUALITY OF EACH INDICATOR.THE LARGE POSITIVE VALUES OF NON-RMSE INDICATORS REPRESENT BETTER DATA QUALITY, WHILE THE LARGE NEGATIVE VALUES OF RMSE INDICATORS REPRESENT BETTER DATA QUALITY. ... 32
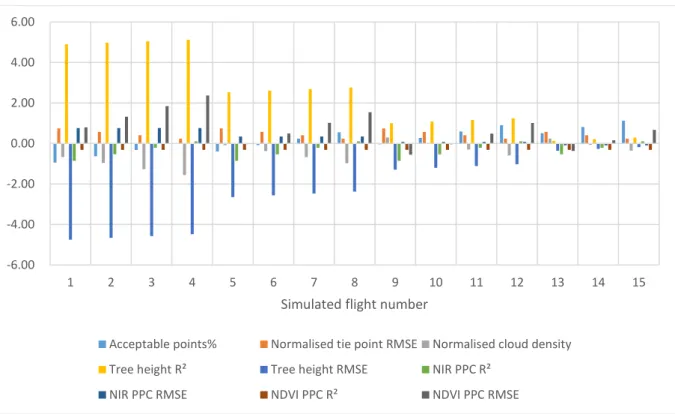
FIGURE 2.5.PREDICTED STANDARDISED QUALITY INDICATORS FOR SCENARIO 2.THE Y AXIS IS THE STANDARDISED VALUE OF QUALITY INDICATORS, WHICH ONLY SHOWS THE RELATIVE QUALITY OF EACH INDICATOR.THE LARGE POSITIVE VALUES OF NON-RMSE INDICATORS REPRESENT BETTER DATA QUALITY, WHILE THE LARGE NEGATIVE VALUES OF RMSE INDICATORS REPRESENT BETTER DATA QUALITY. ... 33
FIGURE 2.6.PREDICTED STANDARDISED QUALITY INDICATORS FOR SCENARIO 3.THE Y AXIS IS THE STANDARDISED VALUE OF QUALITY INDICATORS, WHICH ONLY SHOWS THE RELATIVE QUALITY OF EACH INDICATOR.THE LARGE POSITIVE VALUES OF NON-RMSE INDICATORS REPRESENT BETTER DATA QUALITY, WHILE THE LARGE NEGATIVE VALUES OF RMSE INDICATORS REPRESENT BETTER DATA QUALITY. ... 35
FIGURE 3.1.STUDY SITES:(A)AVOCADO ORCHARD IN BUNDABERG,(B) BANANA ORCHARD IN WAMURAN... 42
FIGURE 3.2.MEASURED SPECTRAL REFLECTANCE OF THE EIGHT GREYSCALE RADIOMETRIC CALIBRATION PANELS,
CORRESPONDING WITH THE FOUR PARROT SEQUOIA® MULTI-SPECTRAL BANDS USING A HANDHELD ASD
VISIBLE- NEAR-INFRARED (NIR) RANGE SPECTROMETER. ... 43
FIGURE 3.3.THE APPEARANCE OF THE SAME AVOCADO TREE BETWEEN (A) AN ORIGINAL IMAGE; AND THE
ORTHOMOSAICS DERIVED FROM (B)AGISOFT METASHAPE AND (C)PIX4DMAPPER.ALTHOUGH THE AVOCADO TREE LOOKS SIMILAR IN (A–C), THE HALO EFFECT SURROUNDING THE TREE IN (C) IS VISIBLE. ... 44
FIGURE 3.4.CONCEPTUAL WORKFLOW OF THE RADIOMETRIC CORRECTION METHODS. ... 45
FIGURE 3.5.SELECTED TREES AND GROUND AREAS FOR BOTH AVOCADO (A) AND BANANA (B) SITES FOR BOX-AND
-WHISKER COMPARISON. ... 49
FIGURE 3.6.CONSISTENCY RATE DERIVED FROM BOX-AND-WHISKER COMPARISON FOR (A) CANOPY AREAS AND (B)
GROUND PATCHES OF AVOCADO DATASETS.IT ONLY SHOWS THE LOWEST CONSISTENCY RATES AMONG THE THREE DATASETS BECAUSE BOX-AND-WHISKER COMPARISON WAS ONLY APPLICABLE TO TWO DATASETS AT A TIME.IT SHOWS THAT NO METHOD PROVIDED OVERALL ROBUST CORRECTION, WHILE THE CONSISTENCY IN THE RED EDGE AND NIR BANDS IS GENERALLY HIGHER THAN IN THE GREEN AND RED BANDS. ... 50
FIGURE 3.7.CONSISTENCY RATE DERIVED FROM BOX-AND-WHISKER COMPARISON FOR (A) CANOPY AREAS AND (B)
GROUND PATCHES OF BANANA DATASETS.THE FLIGHT HEIGHT IS THE SAME AS AVOCADO DATASET 3 BUT THE CORRECTED VALUES CONSISTENCY IS HIGHER.THE EMPIRICAL-CORRECTION-BASED METHOD PROVIDED HIGHER CONSISTENCY IN RED EDGE AND NIR BANDS WHILE SENSOR-INFORMATION-BASED CALIBRATION PROVIDED HIGHER CONSISTENCY IN GREEN AND RED BANDS ON CANOPIES. ... 51
FIGURE 3.8.THE DIAGRAMS SHOW THE PREDICTED NADIR DN VERSUS OBSERVED DN BY SOLVING TIE POINTS' WALTHAL BIDIRECTIONAL REFLECTANCE DISTRIBUTION FUNCTION (BRDF) COEFFICIENTS FOR THE AVOCADO IMAGE,(A) SHOWS THE SCATTERPLOT FOR CANOPY TIE POINTS,(B) SHOWS THE SCATTERPLOT FOR GROUND TIE POINTS.THE X-AXIS REPRESENTS SQUARED VIEWING ZENITH ANGLE, AND THE Y-AXIS REPRESENTS THE VIEWING ZENITH ANGLE MULTIPLY BY THE COSINE OF SOLAR-VIEWING AZIMUTH ANGLE DIFFERENCE. ... 52
FIGURE 3.9.IMAGE COMPARISON BEFORE AND AFTER BRDF CORRECTION.THE BLACK ARROW SHOWS WHERE THE HOT SPOT IS. ... 52
FIGURE 4.1.THE (A) OUTLINE OF THE STUDY AREA AND (B) AERIAL VIEW OF THE AVOCADO ORCHARD IN BUNDABERG, AUSTRALIA.THE GREEN DOTS IN (A) REPRESENT THE SELECTED IN-SITU MEASURED TREES.THE AUSTRALIA BASEMAP IN (A) USES IMAGERY FROM WORLD-VIEW 2 PROVIDED BY DIGITALGLOBE. ... 65
FIGURE 4.2.THE CONDITION RANKING FOR AVOCADO TREES BASED ON FARMERS’ KNOWLEDGE.THE STANDARD RANKING METHOD CLASSIFIES THE TREES INTO FOUR CATEGORIES:(A)EXCELLENT, WHERE THERE WAS NO SIGN OF DEFOLIATION;(B)GOOD, WITH FEW WILTING LEAVES OCCURRING;(C)MODERATE, WHERE APPROXIMATE ONE THIRD TO HALF OF THE GREEN LEAF TISSUES WERE WILTED; AND (D)FAIR, WHERE MORE THAN HALF OF THE LEAVES WERE DEAD. ... 66
FIGURE 4.3.SPECTRAL REFLECTANCE OF THE EIGHT GREYSCALE RADIOMETRIC CALIBRATION PANELS MEASURED IN
-SITU WITH A FIELD SPECTROMETER AND RESAMPLED TO MATCH THE FOUR PARROT SEQUOIA® MULTI-SPECTRAL BANDS. ... 67
xi
.T ( ) ,
BRIGHTNESS VARIATION IS LESS PRONOUNCED IN (B).THIS PHENOMENON WAS CAUSED BY DYNAMIC
PHOTOGRAPHIC PARAMETERS AND ONLY OCCURRED IN THE GREEN AND RED EDGE BANDS IN THIS CASE. ... 68
FIGURE 4.5.THE WORKFLOW OF INDIVIDUAL TREE DELINEATION AND ATTRIBUTE EXTRACTION. ... 70
FIGURE 4.6.THE DELINEATED TREE EXTENT FOR THE 45 SELECTED TREES THAT HAD IN-SITU STRUCTURAL
MEASUREMENTS AND THE 66 TREES THAT HAD ON-GROUND CONDITION EVALUATION.THE RECTANGLES WHICH ARE HIGHLIGHTED IN GREEN IN (A) REPRESENT THE MINIMUM RECTANGLE TO MEASURE CROWN WIDTH AND LENGTH, REPRESENTING THE HORIZONTAL DISTANCE IN THE DIRECTION ALONG AND PERPENDICULAR TO THE HEDGEROW, RESPECTIVELY.THE YELLOW HIGHLIGHTED TREES IN (B) INCLUDE THE 22 TREES FOR WHICH TREE CROWN WERE CONDITION RANKED AND MEASURED STRUCTURE IN FIELD. ... 71
FIGURE 4.7.SCATTER PLOT AND THE LINEAR REGRESSION OF TREE HEIGHT.BLUE DOTS APPEARING ABOVE AND BELOW THE 1:1 LINE REPRESENT A UAS-BASED UNDER- AND OVERESTIMATION OF THE TREE HEIGHT,
RESPECTIVELY. ... 72
FIGURE 4.8.SCATTER PLOT AND LINEAR REGRESSION OF (A) CANOPY WIDTH IN THE DIRECTION ALONG THE
HEDGEROW, AND (B) CANOPY LENGTH IN THE DIRECTION PERPENDICULAR TO THE HEDGEROW.THE OUTLIER IN
(B) CAUSED BY A BRANCH OF SPARSE LEAVES AT THE LOWER PART OF A TREE WAS NOT TAKEN INTO ACCOUNT IN THE LINEAR REGRESSION. ... 73
FIGURE 4.9.THE R2 VALUE OF THE LINEAR CORRELATION BETWEEN FIELD MEASURED PPC AND DIFFERENT SPECTRAL IMAGES, INCLUDING THE BRIGHTNESS OF THE RED EDGE AND NIR BANDS AND FIVE VEGETATION INDICES.EACH COLOUR REPRESENTS THE DIFFERENT COMBINATION OF INPUT INCLUDING MEAN, STANDARD DEVIATION (STDEV),
AND FOUR TEXTURE GLCMS (TEXTURE).THE BARS ON THE LEFT AND RIGHT SIDES OF THE GRAPH WERE PRODUCED FOR THE ORTHOMOSAICS WITHOUT AND WITH COLOUR CORRECTION, RESPECTIVELY. ... 75
FIGURE 4.10.THE CONFUSION MATRIX AND OUT-OF-BAG ACCURACY OF THE RANDOM FOREST CLASSIFICATION FOR THE TREE CONDITION PREDICTION BASED ON THE CHM-DERIVED TREE HEIGHT AND (A)NIR-RELATED FEATURES, INCLUDING THE MEAN, STANDARD DEVIATION, AND FOUR HARALICK TEXTURE GLCMS; AND (B) PREDICTED PPC USING ALL THE SIX NIR-RELATED FEATURES.THE CONDITION RANKING FROM ONE TO FOUR REPRESENTS CONDITION FROM EXCELLENT TO FAIR. ... 76
FIGURE 4.11.THE CONFUSION MATRIX AND OUT-OF-BAG ACCURACY OF THE RANDOM FOREST CLASSIFICATION FOR THE TREE CONDITION PREDICTION BASED ON THE CHM-DERIVED TREE HEIGHT AND (A)NDVI-RELATED FEATURES, INCLUDING THE MEAN, STANDARD DEVIATION, AND FOUR HARALICK TEXTURE GLCMS; AND (B) PREDICTED PPC USING ALL THE SIX NDVI-RELATED FEATURES.THE CONDITION RANKING FROM ONE TO FOUR REPRESENTS CONDITION FROM EXCELLENT TO FAIR. ... 77 FIGURE 5.1.GCP PATTERN FOR OUR STUDY SITE.THE BIGGER RECTANGLE IS FOR THE 1HA AREA WHILE THE
SMALLER RECTANGLE IS FOR THE CENTRAL 0.25HA AREA.WHITE CIRCLES ARE THE APPROXIMATE GCP
xii
TABLE 2.1.DIFFERENT SETTINGS OF THE 27 DRONE CAMPAIGNS.IT IS NOTED THAT CONFIGURATION NUMBER 13 IS MISSING AS IT WAS UNSUCCESSFUL DUE TO WRONG SETTING.THE PATTERN ALONG MEANS THE DRONE FLIGHT LINE DIRECTION OCCURRED IN THE DIRECTION ALONG THE HEDGEROWS, WHILE THE GRID PATTERN INCLUDED BOTH ALONG AND ACROSS HEDGEROWS.THE CONFIGURATION NUMBERS WITH * MEANS THEY WERE CONDUCTED
IN THE CENTRAL 0.25 HA AREA. ... 17
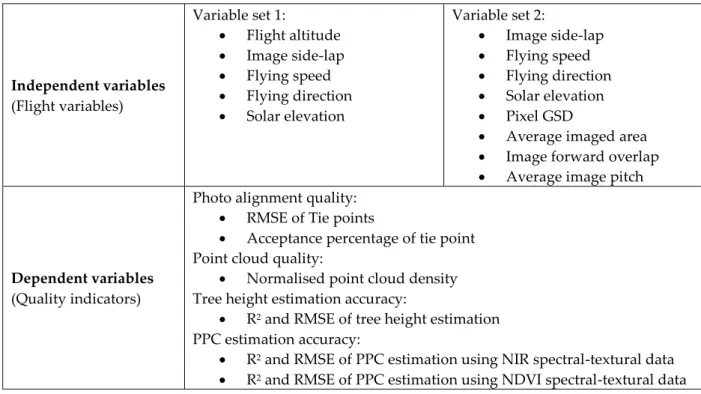
TABLE 2.2.INPUT VARIABLES FOR THE PLS REGRESSIONS.INDEPENDENT VARIABLES ARE X TERM AND DEPENDENT VARIABLES ARE Y TERM IN THE REGRESSION FORMULA... 22
TABLE 2.3.THE COMPARISON MATRIX SHOWS THE MEASURED IMPACT OF EACH OF DRONE FLIGHT PLANNING PARAMETER FROM VARIABLE SET 1(IN ROWS) ON DRONE IMAGE QUALITY AND AVOCADO TREE HEIGHT AND PPC (IN COLUMNS).THE BOTTOM ROW IS THE COEFFICIENT OF DETERMINATION OF EACH REGRESSION MODEL WHICH INDICATED THE POWER TO EXPLAIN THE VARIANCE OF DEPENDENT VARIABLES.A CELL MARKED IN RED MEANS THE DRONE FLIGHT PLANNING VARIABLES HAD SIGNIFICANT NEGATIVE CORRELATION WITH THE DRONE IMAGE QUALITY INDICATORS, TREE HEIGHT AND PPC, WHILE GREEN INDICATES THAT THE VARIABLES HAD SIGNIFICANT POSITIVE CORRELATION.THE DARKER THE CELL COLOUR IS, THE STRONGER INFLUENCE THE VARIABLES HAD ON THE IMAGE QUALITY INDICATORS.THE BLANK CELLS MEAN THE VARIABLES DID NOT HAVE SIGNIFICANT INFLUENCE ON RESPECTIVE INDICATORS. ... 25
TABLE 2.4.THE COMPARISON MATRIX SHOWS THE MEASURED IMPACT OF EACH OF DRONE FLIGHT PLANNING PARAMETER FROM VARIABLE SET 2(IN ROWS) ON DRONE IMAGE QUALITY AND AVOCADO TREE HEIGHT AND PPC (IN COLUMNS).THE BOTTOM ROW IS THE COEFFICIENT OF DETERMINATION OF EACH REGRESSION MODEL WHICH INDICATED THE POWER TO EXPLAIN THE VARIANCE OF DEPENDENT VARIABLES.A CELL MARKED IN RED MEANS THE DRONE FLIGHT PLANNING VARIABLES HAD SIGNIFICANT NEGATIVE CORRELATION WITH THE DRONE IMAGE QUALITY INDICATORS, TREE HEIGHT AND PPC, WHILE GREEN INDICATES THAT THE VARIABLES HAD SIGNIFICANT POSITIVE CORRELATION.THE DARKER THE CELL COLOUR IS, THE STRONGER INFLUENCE THE VARIABLES HAD ON THE IMAGE QUALITY INDICATORS.THE BLANK CELLS MEAN THE VARIABLES DID NOT HAVE SIGNIFICANT INFLUENCE ON RESPECTIVE INDICATORS. ... 25
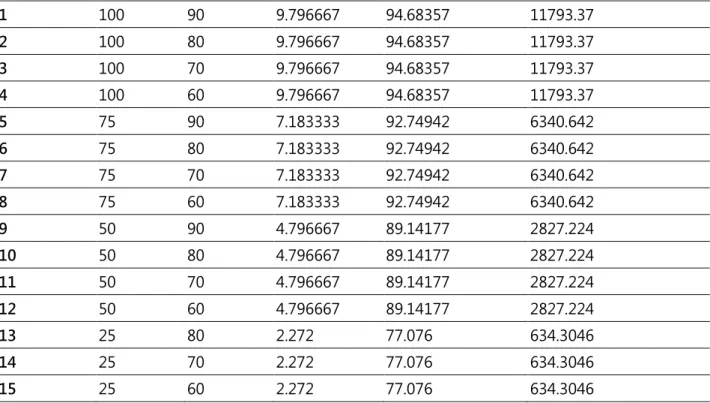
TABLE 2.5.VARIABLES OF SIMULATED FLIGHTS FOR SCENARIO 1. ... 31
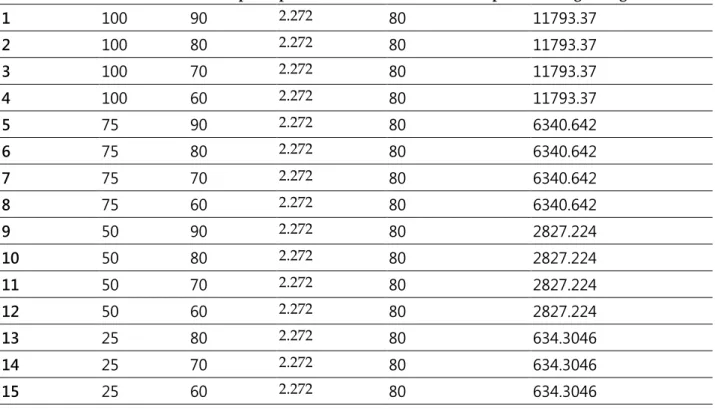
TABLE 2.6.VARIABLES OF SIMULATED FLIGHTS FOR SCENARIO 2. ... 33
TABLE 2.7.VARIABLES OF SIMULATED FLIGHTS FOR SCENARIO 3. ... 34
TABLE 3.1.REFLECTANCE CONSISTENCY PERCENTAGES BETWEEN DIFFERENT FLIGHT PATTERNS IN DATASET 2. .... 53
TABLE 3.2.CONSISTENCY ASSESSMENT RESULTS FOR BANANA FROM BOX-AND-WHISKER COMPARISON BETWEEN TWO TEMPORALLY CLOSE FLIGHTS. ... 54
TABLE 3.3.A SIMPLIFIED COMPARISON TABLE OF THE PROPOSED CORRECTION METHODS.G,R,RE, AND NIR ARE GREEN, RED, RED EDGE, AND NIR BANDS RESPECTIVELY.X MEANS THE METHOD DOESN’T WORK WELL;V MEANS THE METHOD WORKS WELL;Δ MEANS THE RESULTS ARE UNSTABLE;O MEANS THE RESULTS ARE MODERATELY CONSISTENT. ... 55
TABLE 4.1.NUMBER OF AVOCADO TREES CLASSIFIED IN SITU INTO RESPECTIVE CONDITION RANKINGS. ... 66
TABLE 4.2.FORMULAE OF VEGETATION INDICES WHICH WERE USED IN THIS STUDY. ... 69
TABLE 4.3.THE FEATURE IMPORTANCE OF EACH CLASSIFIER USING CHM-DERIVED TREE HEIGHT AND NIR-BRIGHTNESS-RELATED FEATURES. ... 77
TABLE 4.4.THE FEATURE IMPORTANCE OF EACH CLASSIFIER USING CHM-DERIVED TREE HEIGHT AND NDVI-RELATED FEATURES. ... 78
TABLE A1.REFLECTANCE CONSISTENCY PERCENTAGES OF TREE CANOPIES BETWEEN DIFFERENT FLIGHT PATTERNS IN DATASET 1. ... 102
TABLE A2.REFLECTANCE CONSISTENCY PERCENTAGES OF TREE CANOPIES BETWEEN DIFFERENT FLIGHT PATTERNS IN DATASET 2. ... 102
TABLE A3.REFLECTANCE CONSISTENCY PERCENTAGES OF TREE CANOPIES BETWEEN DIFFERENT FLIGHT PATTERNS IN DATASET 3. ... 102
TABLE A4.REFLECTANCE CONSISTENCY PERCENTAGES OF GROUND AREAS BETWEEN DIFFERENT FLIGHT PATTERNS IN DATASET 1. ... 103
TABLE A5.REFLECTANCE CONSISTENCY PERCENTAGES OF GROUND AREAS BETWEEN DIFFERENT FLIGHT PATTERNS IN DATASET 2. ... 103
TABLE A6.REFLECTANCE CONSISTENCY PERCENTAGES OF GROUND AREAS BETWEEN DIFFERENT FLIGHT PATTERNS IN DATASET 3. ... 103
TABLE B1.CONSISTENCY ASSESSMENT RESULTS FROM THE BOX-AND-WHISKER PLOT COMPARISON BETWEEN TWO TEMPORALLY CLOSE FLIGHTS. ... 104
xiii AGL Above Ground Level
ANOVA Analysis of Variance
BRDF Bidirectional Reflectance Distribution Function CHM Canopy Height Model
ClGE Green Chlorophyll Index
CMOS Complementary Metal Oxide Semiconductor DBM Defference Between Median
DCP Digital Cover Photography
DN Digital Number
DSM Digital Surface Model DTM Digital Terrain Model GCP Ground Control Point GDP Gross Domestic Product
GEOBIA Geographic Object-Based Image Analysis GLCM Grey Level Co-ocurrence Matrix
g-NDVI Green Normalised Difference Vegetation Index GPS Global Positioning System
GSD Ground Sample Distance IRQ Interquartile Range
ISO International Organisation of Standardisation LiDAR Light Detecting and Ranging
MCA Multi-camera Array MMU Minimum Mapping Unit MVS Multi-view Stereo
NDRE Normalised Difference Red Edge Index NDVI Normalised Difference Vegetation Index NIR Near-Infrared
OVS Overall Visible Spread PLS Partial Least Square PPC Plant Projective Cover
RE Red Edge
RENDVI Red Edge Normalised Vegetation Index RMSE Root Mean Square Error
RPAS Remote Piloted Aircraft System SfM Structure from Motion
xiv TLS Terrestrial Laser Scanning UAS Unmanned Aerial System
1
Chapter 1: Introduction and Research Significance
This chapter provides the general context of the research, identifies the knowledge gaps and outlines the overall thesis structure
2 1.1. Background
Tree crops contribute a large proportion of the global agricultural economy (Barlow, 1997) and are considered to be essential contributors to the future food and nutritional security of a growing global population (Davies and Bowman, 2016). In Australia, a report by Econtech et al. (2005) identified that fruit production and growing activities contributed 16% to the total agriculture-dependent gross domestic product (GDP). Hence, suitable generation and adoption of techniques for crop management of orchards are important to minimise production costs and maximise productivity and quality (Ushaa and Singh, 2013, Barlow, 1997). In order to achieve such a goal, the farming operations need to be implemented differently according to the differences existing within a farm for better efficiency of resources input and environmental quality (Heege, 2013, Mulla, 2013, Zhang et al., 2002). Such intention forms the rationale of precision agriculture. Thus, it creates the demand for intensive spatial-temporal data collection and analysis for site-specific cultural activities in precise timing (Mulla, 2013).
Genetic variation, phenological growth stage, and abiotic and biotic constraints can all influence tree structural parameters such as height, canopy extent and foliage density. For instance, vigorous trees usually result in tall and dense canopies that influence productivity (Bally and Ibell, 2015, Schaffer et al., 2013a, Whiley, 2000). As such, measurements of these parameters can provide growers with a strong indication of plant condition or vigour, photosynthetic capacity and yield potential (Rahman et al., 2018, Viau et al., 2005). In most Australian horticultural industries, such assessment is usually conducted by on-ground visual evaluation, which is time consuming, labour-intensive, subjective and often inconsistent (Johansen et al., 2017, Johansen et al., 2018, Searle, 2017, Robson et al., 2017a). With a georeferenced site-specific thematic map, which is produced by a computer using the sensor-acquired data, such challenges can be overcome to allow site-specific precision farming operations (Heege, 2013).
Since the late 20th century, remote sensing has been applied as a technology to acquire
such thematic maps for commercial precision farming (Mulla, 2013). It is based on analysing the direct connection between how much radiative energy is reflected by plant leaves and their biogeochemical properties. The effectiveness of a material’s surface in reflecting radiant energy is described as reflectance (Lillesand et al., 2015). For instance, the higher concentration of photosynthetic pigments such as chlorophyll results in higher reflectance in green light and lower reflectance in red light, and well-developed leaf canopy results in high reflectance in near-infrared ranged from 700 to 1300 nm (Heege, 2013, Lillesand et al., 2015, Jensen, 2016). Based on such phenomena, scientists started to realise that by
3
combining these bands of wavelength in the form of simple ratio index or normalised difference vegetation index (NDVI), it is possible to find the nearly-linear correlation between such indices and net primary productivity of crops (Sellers, 1987). However, this relationship becomes non-linear as the canopy heterogeneity increases (Cescatti, 1997). This is because the size of phyto-elements (e.g. leaves and branches) are often larger than the spectral wavelengths in optical remote sensing. Thus, the total absorption cross section, which is the probability of the molecule of organic tissues to absorb photons energy, is determined by the canopy structure instead of the wavelengths of photons (Wang et al., 2018). Several models have been developed to simulate the canopy radiative transfer process for trees, but they all need some key canopy structural properties for modelling (Wang et al., 2018). Therefore, for the purpose of precision farming on tree crops or trees in general, measuring canopy structural parameters is often more practical and understandable to farmers rather than simply obtaining the vegetation indices.
Remote sensing has been used to estimate tree canopy structural attributes, such as tree height, canopy extent, and plant projective cover (PPC), for decades (Wulder, 1998, Johansen et al., 2018, Chianucci et al., 2016). Conventionally, these types of data were acquired by either satellite, aircraft, or ground-based platform. The determining factors to differentiate these platforms and their imaging systems are the distance to the sensing target, the cover area, and, very often, the spatial resolution of the remotely sensed data (Mulla, 2013, Wulder, 1998). It is usually expected that the spatial resolution to be from coarse-scale to fine-scale in the order of satellites, aircraft, and ground-based platforms (Heege, 2013). As the technology advances, imaging sensors on satellites can now achieve less than 5 m or even sub-metre spatial resolution with daily revisiting frequency, which data have been proved useful for precision agricultural applications (Rahman et al., 2018, Mulla, 2013, Helman et al., 2018, Houborg and McCabe, 2016). Although the spatial-temporal resolution from satellite data becomes satisfactory, it is not possible for satellite data to acquire on-demand spatial, spectral, and temporal specifications that are tailored for specific sites, products, and delivery times for horticultural applications (Aasen et al., 2018). As the case of airborne remote sensing, it is usually restricted by the complexity of the operation and relatively high cost (Zhang and Kovacs, 2012). Besides, either optical satellite or airborne data are weather constrained and suffer from overcast cloud cover (Mulla, 2013, Pádua et al., 2017). On the other hand, data acquired from ground-based vehicles are able to provide competent spatial resolution and sufficient spectral and temporal precision. However, the sensing area is way smaller compared to satellite or airborne remote sensing, so it is time-consuming to collect data for orchards with tens of hectare area, and thus reduce
4
the desire for frequent data acquisition (Johansen et al., 2018, Heege, 2013). To resolve the gap between satellite, airborne, and ground-based remote sensing, more recently there is a growth of a new concept called low altitude remote sensing, and the deployment of drones in low altitude to acquire images of Earth surface has been promoted as the most remarkable alternative of such concept to fill the gap (Zhang and Kovacs, 2012).
Drones, also known as remote piloted aircraft systems (RPAS) or unmanned aerial systems (UAS), have been considered as a useful platform for measuring horticultural tree crop structure, as it provides both higher spatial and temporal resolution, potentially higher spectral and temporal precision, and the flexibility of operations (Zarco-Tejada et al., 2014, Torres-Sánchez et al., 2015, Heege, 2013, Saari et al., 2011). Moreover, it helps to increase the availability of images to farmers who can afford an inexpensive drone, as the image availability was limited to specific consulting firms in the past (Zhang and Kovacs, 2012, Aasen et al., 2018). Traditionally, the canopy structural measure such as canopy height and extent is estimated by analysing multi-view stereo (MVS) photography using soft-copy photogrammetry and its orthomosaic (Dandois and Ellis, 2013, Saari et al., 2011, Díaz-Varela et al., 2015). Factors such as image spatial-resolution, the optical model of sensors, interpolating methods, and sampling density have significant effects on the photogrammetric accuracy (Aguilar et al., 2005, Wulder, 1998, James et al., 2017). More recently, computer vision technologies such as structure from motion (SfM) has been applied to soft-copy photogrammetry. The most popular SfM feature detecting algorithm is the scale-invariant feature transform (SIFT) method (Novaković et al., 2017). It firstly finds a dominant gradient direction based on motion perception, then rotate the descriptor to fit such orientation to make it rotation-invariant, and finally identify features using the maxima from a difference-of-Gaussians pyramid (Lowe, 1999, Lowe, 2004). When features are identified, by tracking back the feature trajectories, more accurate position and orientation of cameras can be acquired. Such process is called self-calibrating bundle adjustment and has been proved to provide higher accuracy than using pre-calibrated camera optical models (James et al., 2017). The combination of MVS photogrammetry and SfM creates an opportunity for the wide-spread of drone applications, as it increases the sampling density with higher spatial-resolution imagery regardless the pre-defined position, orientation, and optical model information of the on-board cameras, and thus, generally increase the accuracy of photogrammetry (James et al., 2017, Singh and Frazier, 2018).
The SfM and MVS photogrammetric dense points (point cloud) is a critical product in the drone image processing workflow. Based on such point cloud, digital surface model (DSM) is created, and images are orthorectified using the calibrated feature trajectories to create
5
orthomosaic based on such DSM (Novaković et al., 2017). Usually, light detecting and ranging (LiDAR) system is used to create detailed point cloud to measure tree structure (Aiba et al., 2013, Wallace et al., 2014, Lin et al., 2011, Zhao et al., 2012, Wu et al., 2018). Although LiDAR point cloud outperforms photogrammetric point cloud regarding the completion of canopy reconstruction, the photogrammetric point cloud provides similar degree of accuracy in the extraction of some key structural parameters such as tree height and canopy extent and better spectral fusion compared to LiDAR systems (Fritz et al., 2013, Dandois et al., 2017, Zarco-Tejada et al., 2014, Wu et al., 2019). Previous studies commonly equip the LiDAR systems with another spectral imager to address this issue (Leckie et al., 2003, Shen et al., 2018, Viau et al., 2005). However, the whole systems become expensive compared to a drone system equipped with only a spectral imager on it. The spectral information from drone imagery is important that not only it allows the estimation of PPC but also the estimation of the capacity of photosynthesis and transpiration, general crops characteristics such as nitrogen content, and even species classification (Johansen et al., 2008, Sellers, 1987, Saari et al., 2011, Heege, 2013).
Spectral 2D imagers such as TetraCam multi-camera array (MCA) and Parrot Sequoia® multi-spectral camera are commonly used for tree crop measurement (Aasen et al., 2018). These sensors take advantage of the aid of the computer vision algorithm to have better spatial discrimination compared to other sensor systems such as point or pushbroom spectrometer (Aasen et al., 2018). The geometric processing methods vary depending on the imaging mechanism of the spectral 2D imagers but generally are mature and able to provide satisfactory accuracy thanks to the aid of SfM self-calibrating bundle adjustment method and ground control points (GCP) (Aasen et al., 2018). Although the viewing angles and calibration model can affect the accuracy of bundle adjustment, such error occurs systematically in both DSM and digital terrain model (DTM) and thus is minimised when creating canopy height model (CHM) (Wu et al., 2019, James et al., 2017).
The radiometric calibration, however, still undergoes intensive studies. Since drones are usually flown in low altitude at less than 200 m, neither the light attenuation nor atmospheric effect is severe problems unless the very precise radiometric measurement is required (Heege, 2013, Del Pozo et al., 2014, Aasen et al., 2018, Singh and Frazier, 2018). However, because the covered area of each image frame is small, many images need to be acquired in a period of time so that the image for a larger area can be mosaicked. This characteristic introduces other problems, including the varying illumination condition between images and high viewing dynamics (Hakala et al., 2013, Honkavaara et al., 2013). The illumination variation is commonly addressed by irradiance normalisation method, colour balancing, or
6
block adjustment method to reduce the brightness variation between images (Hakala et al., 2013, Honkavaara and Khoramshahi, 2018, Tu et al., 2018). The block adjustment method also needs to consider the bidirectional reflectance distribution function (BRDF) of the surface, which is due to the solar-viewing geometric dynamics within one image (Honkavaara and Khoramshahi, 2018). At the time when this PhD project starts, there is no implementation to resolve the BRDF effect in any of the common drone image processing software packages to the author’s knowledge. Without normalising the illumination and solar-viewing geometry, it may limit the ability for images of the same area, collected at different times, to be compared.
Another perspective of radiometric calibration is to acquire at-surface reflectance from the image products, as the reflectance information is useful to extract consistent information on biophysical properties, derive calibrated vegetation indices or be used to compare multi-temporal datasets (Jensen, 2016). One of the most common ways to correct the imagery to at-surface reflectance is the simplified empirical correction (Wang and Myint, 2015, Johansen et al., 2018, Berni et al., 2009). The idea is to identify the relationship between known reflectance targets in the scene to their acquired pixel values in digital number (DN). The best-fit equation is calculated and then applied to the whole image to convert DN to at-surface reflectance. Another type of approach is usually referred as sensor-information-based calibration or vicarious calibration, which uses the information of the sensors to estimate the conversion equation from DN to radiance in either absolute or arbitrary unit (Del Pozo et al., 2014, Parrot Drones SAS, 2017b, Kelcey and Lucieer, 2012). After the surface radiance is acquired, at-surface reflectance can be estimated by combining the simultaneous irradiance measurement in either the absolute unit or in an arbitrary unit with the aid of known reflectance targets to solve the uncertainty (Del Pozo et al., 2014, Parrot Drones SAS, 2017b). The empirical approach is more straightforward than the sensor-information-based calibration, but this method doesn’t count the potential brightness variation caused by the varying photography parameters of the sensor. On the other hand, although sensor-information-based calibration takes those photography parameters into account, this method needs laboratory and field calibrations to acquire accurate coefficient for the conversion equation, which is not easy to implement for every drone campaign.
Flight planning of drone campaigns is another critical part of high-quality data acquisition. Many studies discovered that the different acquisition settings such as image overlap and flying altitude have impacts on the accuracies of tree structure estimation (Dandois et al., 2015, Zarco-Tejada et al., 2014, Roth et al., 2018, Torres-Sánchez et al., 2015). Because drones are such highly configurable systems, it is hard to establish a
7
standard protocol regarding flight planning variables. The flight altitude is one of the most discussed variables in previous studies, as it has a direct impact on the ground sampling distance (GSD) of pixels. Singh and Frazier (2018) reviewed 91 articles published during 2000-2017, which provide both flight altitude and GSD, and concluded that most studies did not justify the reason for selecting specific flight altitude. Few studies tried to acquire images at various altitude to figure out the optimal flight altitude or GSD for specific applications, but they did not take the potential side effect of changing flight altitude into account (Torres-Sánchez et al., 2015, D. Gómez-Candón et al., 2014, Johansen et al., 2018). For instance, many sensors have a trigger speed limit due to input/output (I/O) speed of the storage device. Same camera trigger speed at different flight altitude results in different forward overlap, yet such impact has seldom been discussed. This camera trigger speed limit also causes variation regarding the image forward overlap if it is incorporated with the flying speed and flight altitude requirements (Singh and Frazier, 2018). Fixed-wing drones tend to need higher speed to maintain in the air compared to multirotor drones. In order to maintain the image forward overlap, a fixed-wing drone needs to be flown at a higher altitude. However, flying at higher altitude reduces the pixel GSD, and sometimes the flight altitude is restricted by local regulation (Singh and Frazier, 2018). These examples demonstrate the complexity of the influence of flight altitude and flying speed, which has seldom been considered in related studies. This may be the reason that some studies found that flight altitude had a significant impact on the accuracy of canopy structure measurements while some studies did not (Johansen et al., 2018, Zarco-Tejada et al., 2014, Dandois et al., 2015). Image overlap, including forward overlap and side overlap, is another critical variable which varies in the literature. Dandois et al. (2015) suggested that image forward overlap is the most important variable that has the most significant impact on the accuracy of tree structure measurement, yet in the review by Singh and Frazier (2018), less than 45% of the 108 articles reported the image forward and side overlap. Most of the studies exceed 75% image forward overlap, yet some studies successfully generate accurate image product with only 50% forward overlap (Ajayi et al., 2017). Image side overlap has even higher variation ranged from 20% to 90% in the literature review (Singh and Frazier, 2018). Besides, the assessment of the impact of image overlap on the accuracy only takes the geometric accuracy into account. However, structure measurement such as PPC is estimated indirectly using the spectral information, yet the influence of image overlap on such measurement has never been discussed.
Another flight planning variable that attracts little attention is the flight pattern. Unlike natural forested environments, horticultural tree crops are usually planted in rows that in
8
some cases are manually shaped to produce a continuous canopy. In previous studies in horticultural environment, the flight patterns were either grid pattern, along-row, or not specified without any justification (Zarco-Tejada et al., 2014, Díaz-Varela et al., 2015, Johansen et al., 2018, Torres-Sánchez et al., 2015). As hedgerow orchards grow popularity for specific tree crops due to the accessibility of machinery and maximum light interception (Whiley et al., 2013), the investigation of optimal flight pattern is needed. The solar elevation is yet another important variable to affect the accuracy of tree measurement but hardly to be controlled precisely. Although that acquiring remote sensing imagery around solar noon is almost a rule of thumb to guarantee higher data quality (Zarco-Tejada et al., 2012, Bauer et al., 1986), the idea of solar noon is ambiguous because the solar elevation during solar noon varies according to regions and seasons. Dandois et al. (2015) suggested that higher solar elevation results in better accuracy on tree structure measurement in a forest environment, yet similar studies on horticultural tree crops are absent, and the effect of solar elevation may possibly differ between natural forest and artificially managed tree crops.
The aforementioned factors, including the image acquisition and correction approaches, affect the quality of analysis-ready data, but how to extract useful information from such analysis-ready data for farmers to improve their management is another story. Tree extent, tree height, PCC, and vegetation indices can be successfully produced from a single multi-spectral drone campaign (Zarco-Tejada et al., 2014, Díaz-Varela et al., 2015, Johansen et al., 2018). However, as we mentioned at the beginning, the horticultural industries usually rely on tree condition ratings such as Ciba-Geigy category for decision making and farm management (Searle, 2017, Salgadoe et al., 2018). Therefore, how to establish a condition rating strategy by using the drone-based analysis-ready data that can be understood by the farmers is the ultimate goal for the horticultural industry to apply multi-spectral drone imagery, which is also the original rationale for Horticulture Innovation Australia to fund this research project.
In summary, although the application of multi-spectral drone imagery for horticulture tree crops has gone successfully in many cases, there is a gap in the current state-of-art of its application in horticultural tree crop management that the optimal protocols regarding image acquisition, correction, and tree attribute extraction approaches are absent. This thesis developed a best practice workflow that identifies optimal procedures for the acquisition, correction, and extraction of spectral data from a drone when used to measure the health and structural properties of horticultural tree crops. This was achieved progressively by: (1) understanding the influence of several commonly used image correction approaches on the integrity of multi-spectral drone imagery data; (2) identifying optimal measures of tree crop
9
condition and establish the methods to map and measure these; and (3) applying the above correction and extraction procedures to estimate the tree structural properties and analyse the change of accuracy of structural properties due to the changes of acquisition variables to understand the impacts of different variable combinations of flight plans.
1.2. Research Aim and Objectives
The main aim of this project was to develop, test, and deliver techniques for optimal drone configuration to measure and monitor canopy structural properties of a selected horticultural tree crop. The main aim consisted of three objectives:
1. To determine the optimal data collection protocols for acquiring multi-spectral drone imagery over horticulture tree crops;
2. To determine the optimal correction methods for multi-spectral drone image data for acquiring imagery over horticultural tree crops;
3. To determine the accuracies of measuring and mapping canopy structural properties and condition of a horticultural tree crop using multi-spectral drone imagery.
For this study, avocado trees were selected as the target horticulture crop due to their characteristics of canopy structures compared to the other candidates (i.e., mango trees and macadamia trees). Avocado trees are not as intensively modified as mango and macadamia trees so that their canopy geometry, in terms of horizontal and vertical shape, is relatively natural, which is good for establishing robust analysis that not only work in specific circumstances. In situ measures of tree crop parameters, including tree height, canopy extent, and plant projective cover, were compared to the extracted canopy characteristics of the target trees to determine the optimal data collection and extraction processes. By delivering on these objectives, this thesis will determine the optimal drone configuration and data processing methodology that will serve as best practice for standardising future multi-spectral drone imagery data collection over horticultural tree crops.
1.3. Outline of hesis
This thesis is structured in relation to publications/manuscript during the PhD candidature from chapters 2 to 4. As these publications, representing these chapters, were written independently, some degree of repetition may appear. Each chapter has an introduction, which presents a comprehensive literature review on its corresponding topic, following by a detailed description of methodology, results, discussion, and conclusion. It is noted that the term remote piloted aircraft system (RPAS) and drone may appear as
10
unmanned aerial system (UAS) in some following chapters because UAS is more commonly used in most of the journals. The tables which have alphabet prefix in front of the numbers are placed in the appendices for better cohesion. The outline of the thesis and a brief description of each chapter are stated below.
Chapter 1: Introduction and Research Significance
This chapter introduces the research background by briefly reviewing the studies, which related to the use of drone imagery in horticultural applications. The knowledge gap is indicated subsequently, and we proposed the progressive objectives for the research project to address the knowledge gap.
Chapter 2: Optimising Flight Planning for Measuring Horticultural Tree Crop Structure
This chapter is altered from the submitted manuscript ‘Optimising Unmanned Aerial System Flight Planning for Measuring Horticultural Tree Crop Structure’ to adapt to a consistent format of the thesis. It uses a total 39 datasets that have various combinations of flight variables and partial least square regression to assess the impacts on data quality due to the change of each flight variable. Optimal image acquisition protocols are proposed accordingly to different flight scenarios.
Chapter 3: Assessing Radiometric Correction Approaches for Horticultural Applications
This chapter is altered from the paper ‘Assessing Radiometric Correction Approaches for Multi-Spectral UAS Imagery for Horticultural Applications’ (Tu et al., 2018) to adapt to a consistent format of the thesis. It uses three flights that have a grid flying pattern, but in different flying altitude to assess the radiometric consistency performance of each correction method of images collected over avocado and banana plantations.
Chapter 4: Measuring Canopy Structure and Condition in a Horticultural Environment
This chapter is altered from the paper ‘Measuring Canopy Structure and Condition Using Multi-Spectral UAS Imagery in a Horticultural Environment.’ (Tu et al., 2019) to adapt to a consistent format of the thesis. It assesses the various structural estimations including tree height, canopy extent, and plant projective cover that were derived from structural, spectral, and textural information from analysis-ready multi-spectral drone images. The highly correlated attributes are then integrated to classify the tree condition and test the overall prediction accuracy.
11
Chapter 5: Conclusions, Significance and Future Research
This chapter describes the findings from this research project and the contribution to knowledge in the context of the aim and objectives. We also address the recommendations of future research directions due to the limitations we encountered during the research and the time constrains we have for accomplishing the candidature.
12
Chapter 2: Optimising Flight Planning for
Measuring Horticultural Tree Crop Structure
This chapter reviews the variables that exist during the image acquisition process. Partial least square regression is applied to analyse the variables and their interactions to several quality indicators. Optimal image acquisition protocols are proposed for different flight scenarios.
Associated Manuscript:
TU, Y.-H., PHINN, S., JOHANSEN, K., ROBSON, A., & WU, D. 2019. Optimising Drone Flight Planning for Measuring Horticultural Tree Crop Structure. Manuscript submitted to ISPRS Journal of Photogrammetry and Remote Sensing for publication.
13 2.1. Introduction
Tree crops contribute a large proportion of the global agricultural economy (Barlow, 1997) and are considered to be essential contributors to the future food and nutritional security of a growing global population (Ushaa and Singh, 2013). In Australia, a report by Econtech et al. (2005) identified that fruit production and growing activities contributed 16% of the total agriculture-dependent GDP. Hence, suitable information for site-specific crop management of orchards and their individual trees is important to minimise production costs and maximise productivity and quality (Ushaa and Singh, 2013). The information required for this type of management includes regularly updated assessments of crop or tree structure (height, canopy properties, number of fruit) and condition. Remote sensing is an effective tool for mapping tree structural variables, including condition, vigour, photosynthetic capacity, and yield potential (Rahman et al., 2018, Viau et al., 2005, Tu et al., 2019, Robson et al., 2017a). Tree crop structural attributes, such as tree height, canopy extent, and plant projective cover (PPC) have a strong correlation with condition and productivity (Sarron et al., 2018, Salgadoe et al., 2018, Schaffer et al., 2013a). While information on these variables may be derived from either satellite or aircraft based remote sensing, data acquisitions are constrained by the time, weather, and sensor resolution.
In the past decade, imagery collected from drones has become increasingly popular for the acquisition of information to assist orchard management. With their ability to cover orchard scales (< 10 km2), information can be acquired on-demand with ultra-high spatial
resolution able to be obtained from miniaturized sensors designed for drones (Johansen et al., 2018, Tu et al., 2019, Zarco-Tejada et al., 2014). However, determining the appropriate setting for flight planning is essential, as different combinations of flight variables influence the quality and useability of final products (Aasen et al., 2018, Dandois et al., 2015, Roth et al., 2018).
Many studies have discovered that different flight planning settings, such as image overlap and flying altitude, influence estimations of tree structure variables (Dandois et al., 2015, Zarco-Tejada et al., 2014, Torres-Sánchez et al., 2015, Singh and Frazier, 2018) as well as the radiometric quality (Tu et al., 2018, Singh and Frazier, 2018). Yet investigations of these influences have been limited to only individual variables. For example, it is known that changing flying altitude changes the pixel GSD, but also produces parallax variation that influences how the features in scenes are measured and observed using computer vision techniques (Johansen et al., 2018, Tu et al., 2018, Remondino et al., 2014). For some cameras, where the trigger speed is constrained by the input/output (I/O) speed, changing altitude will influence the forward overlap at the same time (Torres-Sánchez et al., 2015).
14
Although changing altitude is an effective approach to change the pixel GSD, this can also be achieved e.g. theoretically by changing the focal length of a sensor, or simply by placing a higher-resolution camera. This example demonstrates the more complex effect that a simple change of one variable may have on drone image collection. This may be the reason that some studies found that flight altitude had a significant impact on the accuracy of canopy structure measurements while some studies did not (Johansen et al., 2018, Zarco-Tejada et al., 2014, Dandois et al., 2015). Therefore, it is necessary to systematically assess the effects of different drone flight variables on the quality of the derived imagery and map products.
Apart from altitude, the effect of sun angle variations has seldom been discussed in the literature on drone image data, although it has been dealt with extensively for satellite image data (Tu et al., 2018). Structural attributes such as PPC, which is the projected fraction of plant’s biomass in the relation of sky, is often calculated using spectral information (Johansen et al., 2018, Tu et al., 2019, Salgadoe et al., 2018, Johansen et al., 2008). The variation of sun angles, including solar elevation and solar azimuth causes variations in reflectance measurements of the same target due to bidirectional reflectance distribution function effects (BRDF) (Honkavaara and Khoramshahi, 2018, Tu et al., 2018, Aasen et al., 2018, Singh and Frazier, 2018). Such observed spectral differences may cause inconsistency in the estimation of PPC. In addition, varying sun angles can influence shading within the tree canopy, which may affect the accuracy of biomass estimation (Adeline et al., 2013, Asner and Warner, 2003). Flight line pattern is another variable, which varies significantly between different studies reported in the literature, but its influence on data quality is rarely discussed.
Unlike natural forested environments, horticultural tree crops are usually planted in rows that in some cases are manually shaped to produce a continuous canopy. The influence of linear tree planting and flight direction, i.e. either flying along tree rows, across tree rows or in a grid pattern (Zarco-Tejada et al., 2014, Díaz-Varela et al., 2015, Tu et al., 2019) on the quality of image products has also received little investigation. Tu et al. (2018) indicated that the different flying directions caused inconsistency in the radiometric quality of drone imagery due to the different solar-surface-viewing geometries. However, the impact on image 3D reconstruction of this is still undocumented. Flying speed is yet another variable, which varies significantly between different studies reported in the literatures, ranging from 3 m/s to 17 m/s (Zarco-Tejada et al., 2014, Jiménez-Brenes et al., 2017). The effect of flying speed varies, depending on the type of camera shutter, the acquisition mode, and the type of drone platform, i.e. multirotor or fixed wing (Eisenbeiß, 2009, Pádua et al., 2017). High
15
flying speed tends to capture ‘blurry’ imagery, as it is a function of motion blur (Roth et al., 2018), especially for rolling shutter cameras (Candiago et al., 2015). Flying speed affects the forward overlap as well if the time interval of the camera trigger is fixed (Dandois et al., 2015). Additionally, flying at higher speed can increase the pitch angle of multirotor platforms, and this pitch variation also influences the viewing angle of the camera if the camera is mounted without a self-levelling gimbal. The points above, and lack of drone data acquisition protocols, make it difficult to optimise drone flight planning and imaging workflows to establish set standards of deliverables of multi-spectral drone image products (Aasen et al., 2018, Roth et al., 2018).
This study assessed several acquisition variables, including flying altitude, image side-lap, flying speed, flying directions, and solar elevation, to determine their influences on data quality and consistency, when measuring structural variables of avocado tree crops. Based on the analysis of results, optimal data acquisition protocols for flight planning of drone image collection of horticultural tree crops are presented.
2.2. Materials and Methods 2.2.1. Study Site
The study site for this research was located in southeast Queensland, Australia, near the township of Bundaberg. This region is one of the largest producers of Hass avocadoes in Australia (Whiley, 2000). This subtropical region has hot and humid summers, with the mean temperature at 30 °C and mean monthly rainfall at 158.9 mm, while the temperature in winter is mild and dry, with a mean temperature at 22.8 °C and mean monthly rainfall of 45.6 mm (Bureau of Meteorology, 2019). Avocado trees within this region flower during September and establish final fruit set in January. Harvesting occurs in May followed by limb pruning to maintain access to all trees and maximise light interception of tree canopies. Drone data acquisition occurred over a 1 ha area of avocado trees within a commercial orchard. The trees were planted at 5 m spacing along hedgerows in 2005, with hedgerows 10 m apart. The data were collected in early February 2017, when the foliage density was high due to the summer leaf flush (Newett et al., 2001). The terrain was relatively flat with an average slope of 4 degrees slanting downward towards east and the average elevation of the 1 ha patch was about 60 m above sea level.
2.2.2. Field Measurements
Terrestrial laser scanning (TLS) data and canopy photos were collected on 5 February 2017 for estimating tree height and PPC, respectively. The TLS data were acquired using a