An unbiased Bayesian approach to functional connectomics implicates
social-communication networks in autism
Archana Venkataraman
a,⁎
, James S. Duncan
a,b, Daniel Y.-J. Yang
c, Kevin A. Pelphrey
c aDepartment of Diagnostic Radiology, School of Medicine, Yale University, New Haven, CT, USA bDepartment of Biomedical Engineering, Yale University, New Haven, CT, USA
c
Center for Translational Developmental Neuroscience, Child Study Center, Yale University, New Haven, CT, USA
a b s t r a c t
a r t i c l e i n f o
Article history:
Received 18 November 2014 Received in revised form 20 March 2015 Accepted 26 April 2015
Available online 1 May 2015
Keywords:
Functional MRI Bayesian analysis Autism Brain networks
Resting-state functional magnetic resonance imaging (rsfMRI) studies reveal a complex pattern of hyper- and hypo-connectivity in children with autism spectrum disorder (ASD). Whereas rsfMRIfindings tend to implicate the default mode network and subcortical areas in ASD, task fMRI and behavioral experiments point to social dys-function as a unifying impairment of the disorder. Here, we leverage a novel Bayesian framework for whole-brain functional connectomics that aggregates population differences in connectivity to localize a subset of foci that are most affected by ASD. Our approach is entirely data-driven and does not impose spatial constraints on the region foci or dictate the trajectory of altered functional pathways. We apply our method to data from the openly shared Autism Brain Imaging Data Exchange (ABIDE) and pinpoint two intrinsic functional networks that distinguish ASD patients from typically developing controls. One network involves foci in the right temporal pole, left posterior cingulate cortex, left supramarginal gyrus, and left middle temporal gyrus. Automated decoding of this network by the Neurosynth meta-analytic database suggests high-level concepts of“language”and “compre-hension”as the likely functional correlates. The second network consists of the left banks of the superior temporal sulcus, right posterior superior temporal sulcus extending into temporo-parietal junction, and right middle temporal gyrus. Associated functionality of these regions includes“social”and“person”. The abnormal pathways emanating from the above foci indicate that ASD patients simultaneously exhibit reduced long-range or inter-hemispheric connectivity and increased short-range or intra-inter-hemispheric connectivity. Ourfindings reveal new insights into ASD and highlight possible neural mechanisms of the disorder.
© 2015 The Authors. Published by Elsevier Inc. This is an open access article under the CC BY-NC-ND license (http://creativecommons.org/licenses/by-nc-nd/4.0/).
1. Introduction
Autism spectrum disorder (ASD) is characterized by impaired so-cial–emotional reciprocity, communication deficits, and stereotyped patterns of behavior (Americal Psychiatric Association, 2013). Thus far, the etiological complexity and phenotypic heterogeneity of ASD has greatly limited our understanding of its pathogenesis. Neurologically, ASD cannot be attributed to a single unified brain dysfunction (Waterhouse and Gilberg, 2014; Aoki et al., 2013); rather, it emerges from complex interactions across the brain (Just et al., 2004; Geschwind and Levitt, 2007; Sullivan et al., 2014). Behaviorally, the manifestation and severity of symptoms vary considerably across indi-viduals and over the lifespan of each patient. These challenges have im-peded the discovery of robust neuroimaging biomarkers for the disorder (Sullivan et al., 2014; Hernandez et al., 2014). Despite immense
clinical diversity, social dysfunction is considered a hallmark and unify-ing feature of ASD (Pelphrey et al., 2014). Social abnormalities are ap-parent in both verbal and nonverbal domains and manifest across simple (e.g., shared gaze) and complex (e.g., back-and-forth conversa-tion) behaviors. Since these deficits emerge within thefirst years of life, the prevailing theory posits that ASD alters the developmental tra-jectory of inter-regional connections (Just et al., 2004; Geschwind and Levitt 2007; Just et al., 2012; Melillo and Leisman, 2011; Courchesne and Pierce, 2005) via experience-dependent processes. Specifically, in-dividuals with ASD exhibit reduced long-range connectivity (Wolff et al., 2012). These global patterns likely correspond to integration pro-cesses (Wolff et al., 2012; Oberman and Ramachandran, 2008) essential for higher-order social, emotional and communication functions (Rippon et al., 2007). At the same time, ASD patients show normal or in-creased connectivity within local networks, which may contribute to enhanced sensory-motor processing in clinical sub-populations (Johnson et al., 2002).
Task-based fMRI studies reveal an inconsistent pattern of hyper- and hypo-connectivity between the cortex and limbic structures (Just et al., 2012; Koshino et al., 2005). Such analyses have often been limited to ⁎ Corresponding author.
E-mail addresses:[email protected](A. Venkataraman),
[email protected](J.S. Duncan),[email protected](D.Y.-J. Yang),
[email protected](K.A. Pelphrey).
http://dx.doi.org/10.1016/j.nicl.2015.04.021
2213-1582/© 2015 The Authors. Published by Elsevier Inc. This is an open access article under the CC BY-NC-ND license (http://creativecommons.org/licenses/by-nc-nd/4.0/).
NeuroImage: Clinical
pre-defined neural networks and do not reflect whole-brain patterns. Similarly, temporal correlations within resting-state fMRI (rsfMRI) are believed to reflect the intrinsic functional connectivity of the brain (Biswal et al., 1995; Fox and Raichle, 2007; Buckner and Vincent, 2007). Robust rsfMRI findings have focused on the default mode (Kennedy and Courchesne, 2008; Cherkassky et al., 2006) and salience (von dem Hagen et al., 2013) networks, whereas global rsfMRI analyses have identified distributed abnormalities across multiple neural pro-cesses (Supekar et al., 2013) and have yet to be reproduced. Recently, there has been a push to model the brain as a system of interconnected nodes. However, at present, the network analysis of ASD is limited to ag-gregate measures (e.g., centrality and degree distribution) (Paakki et al., 2010; Cherkassky et al., 2006; Noonan et al., 2009), which do not pin-point a concrete etiological mechanism for the disorder.
In contrast to prior work, we propose to aggregate connectivity dif-ferences between ASD patients and Typically Developing Controls (TDCs) in order to localize the central nodes of the altered functional networks, i.e., thedisease foci. Our novel approach (Venkataraman et al., 2013; Venkataraman, 2012) effectively translates pairwise rsfMRI correlations into estimates of the affected brain regions. Within a Bayes-ian framework, we define alatentgraph that characterizesK indepen-dent networks of abnormal functional connectivity, emanating from the disease foci. These latent variables specify an underlying architec-ture that we cannot directly access, but which generates population-level differences in the observed rsfMRI data. Our solution algorithm jointly infers the regions affected by the disease and the induced net-work topology. Hence, our model provides new insights into the disrupted neural pathways of ASD and promises to enhance our under-standing of its clinical phenomenology.
We demonstrate our approach on data from the publicly available and multi-site Autism Brain Imaging Data Exchange (ABIDE) (DiMartino et al., 2014). Previous work on ABIDE has revealed widespread hypo-connectivity across nearly every functional system, coupled with hyper-connectivity between sub-cortical areas (DiMartino et al., 2014). Region abnormalities have been localized to the thalamus, insula and occipital gyrus (DiMartino et al., 2014), which are not traditionally associated with the social brain. In contrast, our Bayesian model identifies key areas in the default network and tem-poral lobe that are thought to be involved in processing social stimuli. Moreover, the extracted networks tend to exhibit both reduced distal connectivity and increased local connectivity. We selected four ABIDE sites with well-matched populations of children and adolescents (see
Table 2). We used non-parametric permutation tests and a bootstrapping setup to evaluate the reproducibility of our region foci on random subsets of the data. Encouragingly, the identified regions are mainly in the temporal and frontal lobes, and our results show re-markable similarities when inferring one (K= 1) and two (K= 2) ab-normal networks. As such, our model can reliably integrate multi-acquisition rsfMRI data to extract robust and clinically informative biomarkers.
2. Materials and methods
2.1. Connectivity dataset
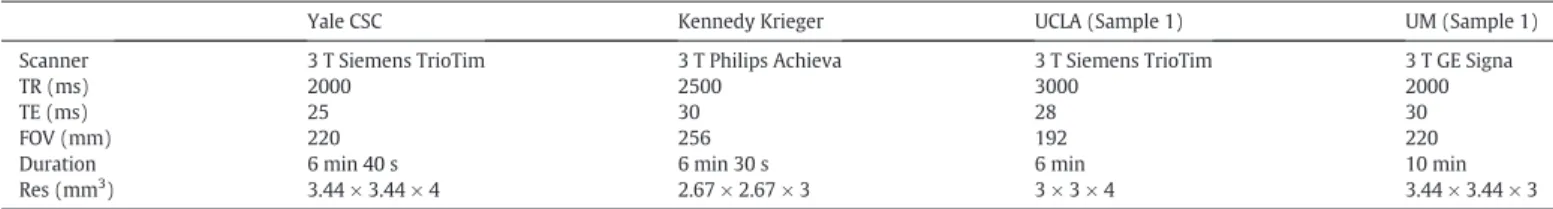
ABIDE includes rsfMRI, anatomical and phenotypic data from 539 patients with ASD and 573 age-matched TDCs (DiMartino et al., 2014). All images were obtained with informed consent, in accordance with established human subject research procedures. Detailed information on participant recruitment, assessment and quality control are found at fcon_1000.projects.nitrc.org/indi/abide/. Given the considerable vari-ation of MR acquisition protocols across sites, we opt to leverage rsfMRI data of children and adolescents (7–19 years) from four participating institutions rather thanfilter all subjects by age. These sites are the Yale Child Study Center, the Kennedy Krieger Institute, the University of California Los Angeles (Sample 1), and the University of Michigan (Sample 1).Table 1reports the functional scan parameters used at each center.
Inclusion criteria for subjects within the chosen sites were whole-brain coverage of the MR acquisition, successful preprocessing with manual inspection of the MPRAGE and BOLD images, and accurate co-registration between the modalities. In addition, we exclude subjects that exhibit significant head motion (N0.5 mm translation orN0.5° rotation) in 25% or more time points of the BOLD series. The maximum rotation between consecutive volumes was 0.8° on average for TDCs and 1.0° for ASD patients, which was not significant (pN0.17). The maximum translation was 0.6 mm on average for TDCs and 0.8 mm for ASD patients. While marginally different (pN0.024), the overall displacement falls within an EPI voxel resolu-tion and can be easily corrected by moresolu-tion scrubbing. We also ex-clude individuals for which the distribution of region-wise rsfMRI correlations was markedly different from all other subjects, as mea-sured by the Hellinger distance. In total, 260 subjects (141 TDC, 119 ASD) were identified for subsequent analysis.Table 2reports the Table 1
Functional scanning protocols across the four selected ABIDE sites.
Yale CSC Kennedy Krieger UCLA (Sample 1) UM (Sample 1) Scanner 3 T Siemens TrioTim 3 T Philips Achieva 3 T Siemens TrioTim 3 T GE Signa
TR (ms) 2000 2500 3000 2000
TE (ms) 25 30 28 30
FOV (mm) 220 256 192 220
Duration 6 min 40 s 6 min 30 s 6 min 10 min
Res (mm3
) 3.44 × 3.44 × 4 2.67 × 2.67 × 3 3 × 3 × 4 3.44 × 3.44 × 3
Table 2
Demographic information for subjects included from the ABIDE dataset. Unless otherwise noted, the data is presented as Mean ± Standard Deviation. The motion values correspond to the
maximumpre-scrubbing displacement between consecutive time points for each rsfMRI scan.
Yale CSC Kennedy Krieger UC Los Angeles Univ. Michigan Control ASD Control ASD Control ASD Control ASD Subjects 27 (19 M) 27 (19 M) 32 (23 M) 18 (15 M) 30 (26 M) 34 (30 M) 52 (37 M) 40 (32 M) Age 12.8 ± 2.7 12.8 ± 3.0 10.2 ± 1.3 9.9 ± 1.4 13.4 ± 2.1 13.5 ± 2.5 14.1 ± 3.1 13.3 ± 2.3 FIQ 104.2 ± 16.9 95.8 ± 20.6 113.2 ± 9.2 98.2 ± 17.2 104.6 ± 9.7 104.1 ± 11.7 107.3 ± 9.8 104.9 ± 17.2 ADI social – 21.9 ± 5.5 – 20 ± 6.3 – 20.2 ± 4.5 – 19.9 ± 4.8 ADI verbal – 17.8 ± 3.9 – 15.2 ± 5.3 – 16.7 ± 4.6 – 15.5 ± 3.7 ADOS total – 11.8 ± 3.2 – 14.3 ± 4.3 – 10.8 ± 3.8 – 10.7 ± 4.1 Trans (mm) 0.7 ± 0.7 0.9 ± 1.1 0.7 ± 0.7 1.0 ± 1.0 0.6 ± 0.7 0.7 ± 0.5 0.4 ± 0.5 0.7 ± 0.6 Rot (°) 0.8 ± 1.2 1.2 ± 2.4 1.0 ± 1.3 1.6 ± 1.7 0.6 ± 1.0 0.6 ± 0.5 0.8 ± 1.15 0.9 ± 0.9
demographic information for these subjects and confirms adequate matching in age and clinical measures across sites. Despite the FIQ differences at Yale and Kennedy Krieger, the population means in the full dataset are 107.4 ± 11.9 for TDCs vs. 102.3 ± 16.0 for ASD patients, and the box plots inFig. 1reveal considerable overlap in the corresponding interquartile intervals.
2.2. Preprocessing
We used Freesurfer (Fischl et al., 2004) to process the MPRAGE ana-tomical images. Consistent region boundaries across subjects were de-rived from the built-in Desikan–Killiany atlas, which segments the brain into 86 cortical and subcortical regions that roughly correspond to Brodmann areas. The structural ROIs were then projected onto the subject-native fMRI space for each individual.
The BOLD data was processed using FSL (Smith et al., 2004) and MATLAB (MATLAB, 2013). We discarded thefirst seven rsfMRI time points, performed motion correction via rigid body alignment and slice timing correction using trilinear/sinc interpolation. The data was spatially smoothed using a Gaussian kernel with 5 mm FWHM and bandpassfiltered with cutoffs 0.01 Hz and 0.1 Hz. Finally, we regressed global contributions to the time courses from the white matter, ventri-cles and whole brain to diminish the influence of physiological noise. We also performed data scrubbing to remove consecutive time points withN0.5 mm translation orN0.5° rotation between them. We compute rsfMRI connectivity as the Pearson correlation coefficient between the mean time courses within the two regions. These pairwise connectivity values are then aggregated into a rsfMRI data matrix for each subject. 2.3. Bayesian analysis
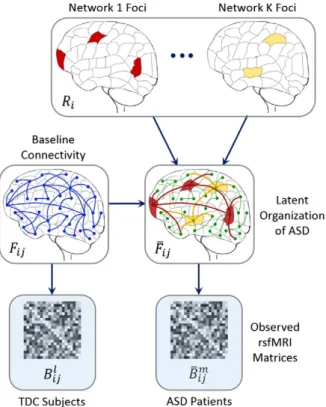
Our model assumes that the connectivity differences induced by ASD can be explained by a set ofK non-overlapping networks, as outlined inFig. 2. Here,Kis a user-specified parameter that controls the model complexity. Each network is characterized by impairments in a small subset of brain regions, orfoci. These impairments subse-quently alter neural communication from the disease foci to the rest of the brain. We use a probabilistic framework to represent the interac-tion between regions and to describe the effects of ASD. Here,latent var-iables specify a template organization of the brain, which we cannot directly access. Instead, we observe noisy measurements of the hidden structure via rsfMRI correlations.
The generative process begins by selecting the region fociRifor each
of theKnetworks. Given these assignments, aberrant functional con-nectivity is defined using a simple set of rules: (1) a connection between two disease foci in the same networkkis always abnormal, (2) a con-nection between two foci in different networks is never abnormal, (3) a connection between two healthy regions is never abnormal, and (4) a connection between a healthy and a diseased region is abnormal with probabilityη. As seen, condition 2 ensures that theKnetworks
remain distinct, and conditions 3 and 4 impose an outward spreading topology on the altered pathways. We use latent functional connectivity variablesFijandFi jto model the neural synchrony between two regions
in the control and ASD populations, respectively. Ideally Fi j≠Fi j for abnormal connections andFi j¼Fi jfor healthy connections. However, due to noise, we assume that the latent templates can deviate from the above rules with probability. Finally, the subject rsfMRI observa-tionsBijl andB
m
i j provide noisy information about the hidden structure. Appendix A presents the four mathematical equations that define our model.
We employ a variational Expectation-Maximization (EM) algorithm (Jordan et al., 1999) to estimate both the latent posterior probability of each regionqiand the nonrandom model parameters from the observed
data. We evaluate the robustness of our approach via non-parametric permutation tests and byfitting the model to random subsets of the data. To construct the null distribution of disease foci, we randomly per-mute the subject diagnoses (TDC vs. ASD) 1000 times and compute the region posterior probabilitiesqifor each trial. The significance of regioni
is the proportion of permutations that yield a larger value ofqi(for any
of theKnetworks) than is obtained under the true labeling. Notice that this is a particularly stringent criterion forKN2, since the abovep-value does not account for the dependencies between the networks. For the bootstrapping experiment, wefit the models using 50% of the data, such that the ratio of TDC subjects to ASD patients remains constant. We intentionally do not control for other demographic or clinical vari-ables (site, age, IQ, ADOS/ADI scores) in order to test the limits of our method on heterogeneous data. We resample the data 50 times and consider the region posterior statisticqi, as averaged across runs.
2.4. Meta-analytic decoding of network function
We rely on the Neurosynth database (www.neurosynth.org) to pro-vide an unbiased and comprehensive evaluation of the functionality supported by each intrinsic network. The meta-analytic framework lever-ages the power of large datasets to compute whole-brain posterior distri-butions P(Feature|Activation) for individual psychological features (i.e., words or terms) (Yarkoni et al., 2011). In this way, we can perform an unbiased reverse-inference to identify constructs that have been con-sistently associated with a particular activation coordinate across a wide variety of fMRI studies. Thus, one effectively“decodes”mental states from brain activity. Statistical inference is performed using a chi-square test to generatep-value maps, which are FDR-corrected (qb0.01) for multiple comparisons (for details, seeYarkoni et al., 2011). At the time of this writing, the database included fMRI results across 9721 studies, with over 347,911 reported coordinates and 3099 feature terms (topics). A complete listing of the individual studies, along with guidelines for the user interface, can be found on the Neurosynth website.
For each set of network foci inFig. 4, we computed the voxel-wise Pearson correlation with the statistical maps obtained from each of the 3099 Neurosynth features (Chang et al., 2013); terms with Fig. 1.Age and FIQ within each population. The red lines correspond to median values, the boxes represent the interquartile interval, and the whiskers denote the 10%–90% range.
correlation above the default threshold (rN0.001) were retained. The corresponding topics were automatically generated by the Neurosynth inference engine via Latent Dirichlet Allocation (LDA) (Blei et al., 2003). Whole-brain reverse inference maps for each topic were com-puted in an identical manner to that described previously for feature-based analyses inYarkoni et al. (2011, 2009). The resulting coefficients were then used to generate a ranking of the psychological topics most specifically associated with each intrinsic functional network, where the values indicated the degree to which engagement of the network implied that a psychological state or process was likely to be present.
3. Results
3.1. Intrinsic functional networks
Figs. 3 and 4illustrate the detected foci (region posterior probability qiN0.50) and corresponding pathways forK= 1 andK= 2 abnormal
net-works, respectively. We colored each region according to the uncorrected −ln(p-value); red indicates low significance and yellow corresponds to high significance. From these regions, we estimated the graph of abnor-mal functional pathways, as shown on the right (Xia et al., 2013). The Fig. 2.Generative model of connectivity for ASD. Parcels correspond to regions in the brain, and lines denote pairwise functional connections. For clarity, only a subset of edges is shown. The labelRiindicates whether regioniis healthy (white) or whether it is a focus in one of theKabnormal networks (colored). These foci capture the most salient functional differences
between patients and controls. The neurotypical template {Fij} provides a baseline functional architecture for the brain, whereas the clinical template B m i j n o
for the TDC and ASD popula-tions, respectively.
Fig. 3.Abnormal regions inferred by our Bayesian model forK= 1 using the ABIDE dataset. Left: Significant regions based on permutation tests (region posterior probabilityqiN0.50,
uncorrectedpb0.05). The color bar corresponds to the negative logp-value. The highlighted regions are the supramarginal gyrus (L.SupM), the middle temporal gyrus (L.MidT), the posterior cingulate (L.PCC), and the temporal pole (R.TPole). Right: Estimated graph of abnormal functional connectivity. The yellow nodes correspond to disease foci. Blue lines indicate reduced functional connectivity in ASD, and magenta lines denote increased functional connectivity in ASD.
single network results inFig. 3identify four brain regions localized to the left middle temporal gyrus (qi= 0.97,pb0.001), the left posterior
cingu-late (qi= 1.00,pb0.01), the left supramarginal gyrus (qi= 1.00,pb0.01),
and the right temporal pole (qi= 1.00,pb0.05). Estimation of abnormal
pathways indicates a general reduction in long-range connectivity (blue lines) and an overall increase in short-range connectivity (magenta lines) in ASD. This global pattern has been well established in the autism literature (Wolff et al., 2012; Johnson et al., 2002). Remarkably, thefirst inferred network inFig. 4exhibits near identical posterior probabilities, significance values and abnormal connectivity to the results forK= 1. Ad-ditionally, we recovered a second network with lower overall significance that consists of the left banks of the middle superior temporal sulcus (qi= 1.00,pb0.04), the right posterior superior temporal sulcus
extend-ing into inferior parietal lobule (qi= 0.86,pb0.08), and the right middle
temporal gyrus (qi= 0.98,pb0.07). We accepted a lower significance
threshold for this network due to our stringent criteria of computing p-values forKN1 (seeMethods). The corresponding functional path-ways demonstrate reduced inter-hemispheric connectivity but largely increased intra-hemispheric connectivity. Thesefindings suggest that our framework captures different levels of effect by varying the model complexityK. Finally, we observe consistence in parameter estimates across random subject re-labelings in the permutation procedure (see Figs. 5 and 6). Hence, the main influences of the experiment are reflected in the region posterior assignments rather than in the data likelihood. 3.2. Model reproducibility
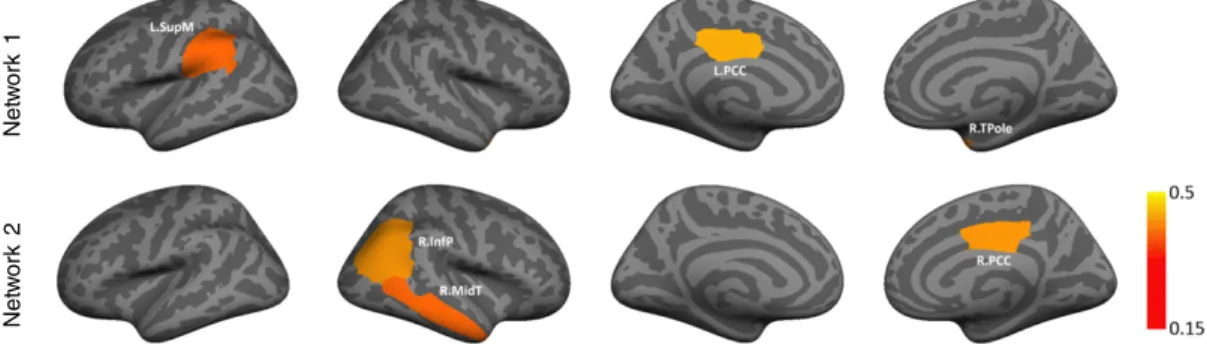
Figs. 7 and 8report the average posterior probability of each region across 50 random samplings of the data, for K = 1 and K = 2,
respectively. Each subset contained half of the subjects, such that the ASD to TDC ratio is preserved. We have displayed only the regions for which the average posterior assignment is greater than 0.15—thereby emphasizing only the most prominent patterns. The color bar indicates the average posterior, such that yellow denotes the strongest foci and red corresponds to the weakest influence. Many of the regions implicat-ed by the single network model inFig. 7correspond to the lower signif-icance cluster of the multi-class solution inFig. 8. This underscores an ongoing debate in thefield that statistical significance, as measured by p-value, is not always a good indicator of reproducibility. Favorably, the two abnormal networks that we obtained from the entire dataset support the consistent patterns inFigs. 5 and 6. This indicates that our Bayesian model can pinpoint robust effects in whole-brain rsfMRI data. 3.3. Meta-analytic decoding
We used the Neurosynth database (www.neurosynth.org) to meta-analytically“decode”the psychological processes associated with each intrinsic network. In particular, the decoder correlated the spatial map of network foci with 3099 topic-based meta-analysis maps in the Neurosynth database. We retained topics with positive correlations at or above the default thresholdr= 0.001. The upper panel ofFig. 9 illus-trates the top 10 constructs implied by each set of foci, including words that overlap between the two networks. We omitted topics that de-scribe a methodological technique (e.g., default mode) or a neurological disorder (e.g., autism, which was among the top 10 for both networks). These mental states, obtained via reverse inference of brain activation, revealed both overlap and clear functional distinctions between the two intrinsic networks. Network 1 was associated with
language-Abnormal Net w ork 1 Abnormal Net w ork 2
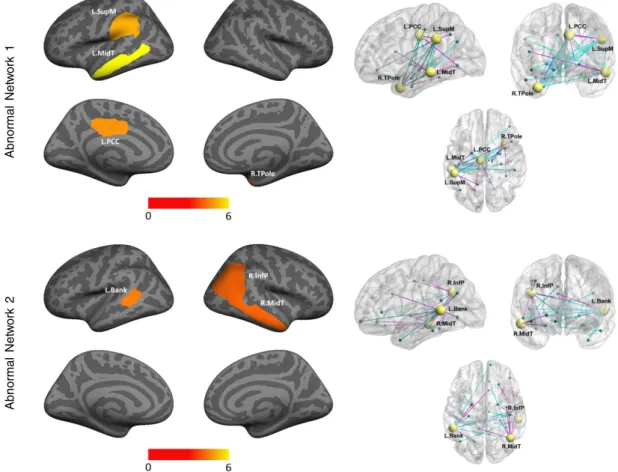
Fig. 4.Abnormal regions inferred by our Bayesian model forK= 2 using the ABIDE dataset. Left: Significant regions based on permutation tests (region posterior probabilityqiN0.50,
uncorrectedpb0.08). Significance is computed as the likelihood of a region appearing ineithernetwork. The color bar corresponds to the negative log p-value. Right: Estimated graph of abnormal functional connectivity. The yellow nodes correspond to disease foci. Blue lines indicate reduced functional connectivity in ASD, and magenta lines denote increased functional connectivity in ASD. Network 1 is nearly identical to the single network obtained inFig. 3. Network 2 extends the solution via the banks of the superior temporal sulcus (L.Bank), the in-ferior parietal cortex (R.InfP), and the middle temporal gyrus (R.MidT).
related topics, including comprehension and semantic processing. Net-work 2 also loaded heavily on language constructs, but was uniquely as-sociated with social-related topics, such as person and self-referential processing. The bottom panels ofFig. 9display the relative specificity of each supra-threshold topic generated by the Neurosynth decoder; the font size reflects the correlation magnitude.
4. Discussion
The localization of region hubs, which describe pathological brain networks, provides key insights into the neural basis of ASD. Our Bayesian model (Venkataraman et al., 2013; Venkataraman, 2012) facil-itates a biological interpretation of the group differences, and the valida-tion procedures confirm the reliability of ourfindings. We emphasize that the model is completely data driven, i.e., we do not guide or con-strain the solution according to a priori theoretical speculations about the networks that should be involved in the disorder. Moreover, the analysis is performed on whole-brain rsfMRI data and treats all regions/connections equally. Our approach marks a new direction of study for ASD and has the potential to reveal unbiased and complex
in-fluences within the brain.
Figs. 3 and 4depict the salient patterns, assuming that population differences in rsfMRI correlations can be explained by one or two abnor-mal networks, respectively. The primary network consists of four ASD-related foci: the right temporal pole, the left posterior cingulate cortex, the left supramarginal gyrus, and the left middle temporal gyrus. Auto-mated decoding of this network by the Neurosynth meta-analytic framework implicates the concepts of“language”and“comprehension” as likely the functional correlates. Our model also identifies a secondary network that consists of the left banks of the superior temporal sulcus, the right poster STS, extending into the inferior parietal lobule, and
the right middle temporal gyrus. The primary associated functions include“social”and“person”. We observe that several of the altered connections inFig. 4(bottom) extend from the temporal lobe foci to the prefrontal cortex. Accordingly, it has been suggested that genes associated with ASD congregate in the deep layer projection neurons of the prefrontal and primary motor cortex, and that they are expressed during midfetal development (Tebbenkamp et al., 2014). Hence, exploring the relationship between our abnormal brain net-works and the underlying genetic influences of ASD is an important direction for future work.
Our approach has revealed abnormal resting state functional connec-tivity in a network of brain regions known to engage in language pro-cessing (left middle temporal gyrus, the left posterior cingulate, the left supramarginal gyrus, and the right temporal pole). Language and communication difficulties are defining features of ASD. Specifically, lan-guage plays a central role in enabling academic achievement, vocational options, independent living, and mainstream integration for individuals with ASD. Task-based fMRI has informed us about the system-level or-ganization of language processing. For example, the upper bank of the STS responds preferentially to the human voice, in comparison to other, well-matched acoustic signals (Belin et al., 2000; Hickok, 2009). Price's review (Price, 2009) on the anatomy of language in typical indi-viduals suggests that phonemic perception is relatively localized to the bilateral superior temporal gyri (STG). Similarly, perception of meaning-ful speech localizes to the middle and inferior temporal cortex, word re-trieval to the left angular gyrus and pars orbitalis, and sentence comprehension to the bilateral STS. Hickok (Hickok, 2009) has sug-gested that fronto-basal ganglia circuits and the anterior temporal lobe/pole are also involved in sentence comprehension.
Task-based fMRI studies of language have also revealed laterali-zation differences in ASD. For example, an investigation of speech
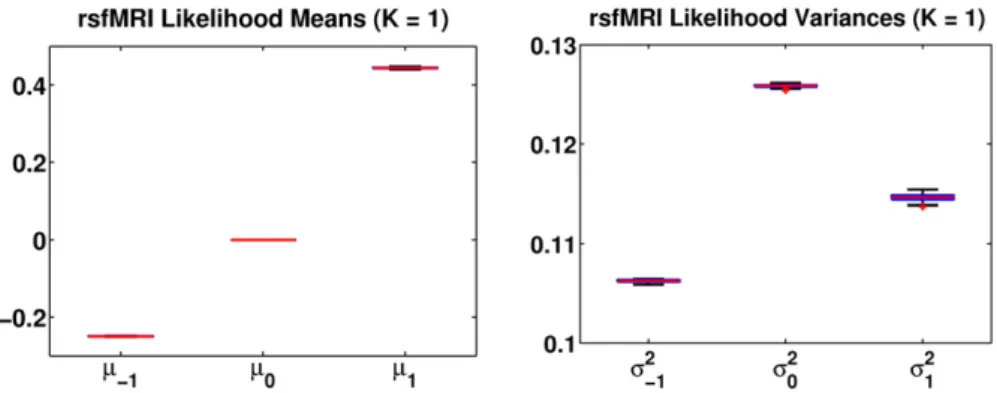
Fig. 6.Gaussian likelihood parameters forK= 2 network across 1000 random permutations of the data. {μk,σk2} represents the mean and variance of rsfMRI observations for the latent
functional connectivity assignmentFij=k. The red lines correspond to median values. The boxes and whiskers (if visible) represent the interquartile interval and 10%–90% range,
respectively.
Fig. 5.Gaussian likelihood parameters forK= 1 network across 1000 random permutations of the data. {μk,σk2} represents the mean and variance of rsfMRI observations for the latent
functional connectivity assignmentFij=k. The red lines correspond to median values. The boxes and whiskers (if visible) represent the interquartile interval and 10%–90% range,
processing in sleeping 2–3 year olds found reduced activity in brain regions associated with language comprehension, along with greater activation in medial and frontal areas of the right hemisphere in ASD (Redcay and Courchesne, 2008). This trend towards greater recruit-ment of right hemisphere regions increases with age into the pre-school period (Eyler et al., 2012). Functional neuroimaging studies in older speakers with ASD have also found evidence of hemispheric abnormalities. Reduced activation in the left inferior frontal gyrus (Just et al., 2004; Garey et al., 2007; Kana et al., 2006; Lai et al., 2012a,b; Mülller et al., 1998, 1999a) and atypical activation in the right frontal lobe (Mülller et al., 1999a,b) have been reported during language paradigms. A meta-analysis by Phillips (Philip et al., 2012) recently summarized thesefindings to suggest greater activation in the right precentral gyrus in children with ASD, as well as reduced activation in the bilateral STG, and generally decreased left laterali-zation of a variety of language functions (see (Boddaert et al., 2003; Dawson et al., 1989; Kleinhans et al., 2008; Knaus et al., 2008) for more details).
Diffusion tensor imaging (DTI) has demonstrated reduced anatomical connectivity for language processing (Just et al., 2004; Kana et al., 2006), as well as white matter disruptions in language pathways (Alexander et al., 2007; Barnea-Goraly et al., 2004; Keller et al., 2007; Lee et al., 2007) in children with ASD. Minshew and Keller (Minshew and Keller, 2010) suggest that speakers with ASD show greater than nor-mal activation and connectivity in posterior areas and reduced connectiv-ity to frontal systems typically involved in language processing. The authors interpret these trends as a sign of over-reliance on visuospatial abilities for verbal reasoning tasks.
Our Bayesian model also pinpoints dysfunction in a well known so-cial perception network centered in the right posterior STS, extending into the inferior parietal lobule and the right middle temporal gyrus (Yang et al., 2015). This network receives and interprets direct input from primary visual and auditory regions in human and nonhuman pri-mates (Belin et al., 2000; Brothers, 1996; Hoffman and Haxby, 2000; Jastorff et al., 2012; Kreifelts et al., 2009). The posterior STS is sensitive to and selective for social stimuli that signal intent in humans (Jastorff et al., 2012). It responds to static social (i.e., faces) vs. non-social stimuli (i.e., objects) as well as complex dynamic social information (Gobbini and Haxby, 2007; Watson et al., 2014). The posterior STS responds
more strongly to socially meaningful human actions than to non-goal-directed movements (Bahnemann et al., 2010). In the auditory domain, the posterior STS responds to affective speech (Wildgruber et al., 2006). Ethofer et al. (2006)discovered that the posterior STS is the input region of the affective voice processing system, where such information is ex-tracted and represented. In terms of somatosensory input, stroking skin areas with C-tactile (CT) nerves with a soft brush, thereby mimick-ing the type of touch durmimick-ing a close social interaction, has been shown to activate the posterior STS (Björnsdotterr et al., 2014; Gordon et al., 2013). Finally, the posterior STS is functionally interconnected to all key regions in the“social brain”(Yang et al., 2015).
There is strong evidence for atypical cortical and subcortical pro-cessing of visual, auditory, and somatosensory signals related to so-cial perception in ASD. When young children with ASD were shown point-light displays of coherent versus scrambled biological motion, they exhibited reduced activity in the FFG, amygdala and posterior STS compared to their unaffected siblings and typically developing peers (Kaiser et al., 2010). In the auditory domain, individuals with ASD showed a similar activation pattern to controls for non-vocal sounds but failed to activate the voice-selective regions of the poste-rior STS in response to vocal sounds (Gervais et al., 2004). Finally, with respect to somatosensory signals, individuals that reported more autistic traits displayed reduced activity in the OFC and poste-rior STS in response to slow and gentile touch to the forearm (Voos et al., 2013).
It is worth mentioning that our method does not identify certain re-gions that have been previously reported in the ASD literature. Examples include the prefrontal cortex, as related to working memory and executive function (Just et al., 2004; Courchesne and Pierce, 2005; Baron-Cohen et al., 1999; Gilbert et al., 2008), and the visuomotor cortex (Koshino et al., 2008; Allen and Courchesne, 2003; Muller et al., 2003; Villalobos et al., 2005). The absence of thesefindings suggests weak evi-dence in the data for prefrontal and visual areas to act as foci. Contributing factors include subtleties of the rsfMRI paradigm, high levels of noise due inter-site variability, heterogeneity of ASD symptoms across subjects, un-explored genetic influences, or (most likely) a combination of the above. A future refinement to the Bayesian framework might include additional random variables to account for external influences. However, such mod-ifications are beyond the scope of this paper.
Net w o rk 1 Net w ork 2
Fig. 8.Average marginal posterior probabilityqifor each network across 50 random samplings from the ABIDE dataset. Each subset includes 50% of the subjects, such that the ratio of ASD
patients to TDCs is preserved. The clusters are aligned to the solution inFig. 4to maintain correspondence across subsets. The color bar denotes the average posterior probability. Once again, the regions correspond to the supramarginal gyrus (L.SupM), the inferior parietal cortex (R.InfP), the middle temporal gyrus (R.MidT), and the posterior cingulate (L.PCC & R.PCC).
Fig. 7.Average marginal posterior probabilityqiacross 50 random samplings from the ABIDE dataset. Each subset includes 50% of the subjects, such that the ratio of ASD patients to TDCs is
preserved. The color bar indicates the average posterior probability. The regions correspond to the banks of the superior temporal sulcus (L.Bank), the inferior parietal cortex (R.InfP), the middle temporal gyrus (R.MidT), and the posterior cingulate (L.PCC & R.PCC).
A major limitation of prior connectivity analyses is the difficulty interpreting the results post hoc. For example, univariate tests select independent connections influenced by disorder. However, the bulk of our knowledge about the brain is organized around regions (e.g., functional localization, cortical thickness) and not the connections between them. Moreover, it is nearly impossible to design noninvasive experiments that probe an arbitrary connection in the brain. While region statistics attempt to localize the impairments, they also average the pairwise effects measured by rsfMRI. Hence, we can rarely tie statistical differences in region statistics to an underlying etiological mechanism. Our method overcomes these limitations by explicitly modeling the prop-agation of information in the brain from regions to connections. Given the rsfMRI correlation matrices, we can easily infer both the disease foci and the neural breakdown associated with ASD. These variables have a straightforward biological meaning and can be used to design follow-up studies for ASD.
We provide two forms of validation: statistical significance, as quan-tified by non-parametric permutation tests, and test–retest reliability on random subsets of the data. On average, we are able tofind the orig-inal disease foci inFigs. 7 and 8. However, these experiments highlight an important point; namely, the most robust foci have among the low-est statistical significance inFigs. 3 and 4. This ties into an ongoing de-bate about the utility and reliability ofp-values (Goodman, 2008). Furthermore, it is unclear whether to apply significance and multiple comparison correction to Bayesian models, since these formulations are not designed for conventional hypothesis testing. Encouragingly, both evaluation schemes produce similar results, which supports that the region foci correspond to robust phenomena within the highly het-erogeneous ABIDE data.
It is important to note that our results may be influenced by the se-lection of regions. Due to the copious inter-site and inter-subject vari-ability of rsfMRI within ABIDE, if the regions are too small, then group differences are likely driven by noise. In contrast, larger regions
potentially blur relevant functional distinctions. This work relies on the Desikan–Killiany atlas in Freesurfer (Fischl et al., 2004), which pro-vide anatomically meaningful correspondences across subjects that re-late to functional divisions within the brain. We include the results for K= 1, 2, and 3 using the Freesurfer Destrieux atlas in Supplementary Results. As seen, there is a great deal of overlap between the two parcellations, in terms of identifying social brain regions. However, there are lso notable differences, which suggest that selecting the ap-propriate resolution for analysis is a nontrivial problem. We emphasize that the Bayesian framework readily applies to any set of consistent ROIs across subjects.
Finally, we address the model complexity parameterK, which spec-ifies the number of abnormal networks to explain the data. Our results forK= 1 and 2 suggest an evolution of disease foci, such that additional clusters explain progressively weaker phenomena. Intuitively, the re-producibility goes down with increasingK, as the model possesses more degrees of freedom (seeFig. 7vs.8). This posits a tradeoff between robustness and our ability to pinpoint smaller effects. Due to the absence of ground truth connectivity information, we believe that meta-analysis and clinical relevance are the best measures to evaluate the impact ofK. The present work uses a data-driven clustering scheme to estimate multiple abnormal networks. Alternatively, we might use clinical scores to tailor the networks to particular subtypes of the ASD population. Therefore, our Bayesian model promises to be a powerful analysis tool for future exploration.
5. Conclusion
We have demonstrated that a Bayesian analysis of whole-brain func-tional connectivity, as measured via resting-state fMRI, supports the theory of impaired social cognition in ASD. Our model captures multi-variate dependencies between pairwise connections to infer both the region foci that are most affected by ASD and the corresponding Fig. 9.The polar plot provides the correlation values of the top 10 topics for each network, which represent the specificity of neurocognitive functions derived from meta-analytic decoding. We include words that overlap between networks, resulting in 14 total features. Lower: Word clouds illustrate the rankings of psychological functions. Word size reflects rank-ordered correlation coefficients, which emphasizes terms that are most associated with each network (Poldrack et al., 2009).
these results is confirmed by non-parametric permutation tests and test–retest experiments. Our discoveries provide valuable insights into the underlying neural mechanisms of ASD and bring us one step closer to deciphering its complex pathogenesis.
Acknowledgments
This work was supported in part by R01 NS035193 (NINDS) “Extraction of Functional Subnetworks in Autism Using Multimodal MRI” and R01 MH100028 (NIMH) “Autism Center of Excellence Network: Multimodal Developmental Neurogenetics of Females with ASD”. D. Yang. is also supported by the Autism Speaks Meixner Postdoc-toral Fellowship in Translational Research (#9284).
Appendix A. Bayesian model formulation
This appendix highlights the mathematical details of our Bayesian model fromSection 2.3. The complete generative process is depicted inFig. 2. Additional details about the probabilistic formulation and infer-ence algorithm can be found in Venkataraman et al. (2013) and Venkataraman (2012).
The multinomial variableRiindicates whether regioniis healthy
(Ri= 0), or whether it belongs to an abnormal communityk. We
assume ani.i.d.multinomial prior forRi:
P Rið ¼k;πrÞ ¼πr
k; k¼0;…;K ðA:1Þ
where the unknown prior parametersπkrare shared by all nodes in the
network.
The latent functional connectivityFijdescribes how regioniand
re-gionjco-activate in the TDC population: positive synchrony (Fij= 1),
negative synchrony (Fij=−1), and no co-activation (Fij= 0). This
tri-state random variable is drawn from a multinomial distribution with parametersπsf. For convenience, we representFijas a length three
indicator vector with exactly one of its elements [Fij,−1Fij0Fij1]Tequal to one, i.e., P Fi j ;πf¼ ∏1 s¼−1 π f s Fi jk : ðA:2Þ
This discrete representation of functional connectivity is a notable departure from conventional analysis. Essentially, we assume that rsfMRI correlations fall into one of three general categories and differ-ences in bin assignment are the relevant markers of a disease. Our choice of three states is motivated by the rsfMRI literature. For example, most works specify a threshold to determine functionally connected areas, which corresponds toFij= 1 in our framework. Moreover, strong
negative correlations are often found in rsfMRI data. Since there is no consensus about their origin and significance (van Dijk et al., 2010), we isolate negative connectivity (i.e.,Fij=−1) as a separate category.
The latent functional connectivityFi jof the ASD population is also tri-state and is based onFijand the region indicator variablesRi:
P Fi jjFi j;Ri;Rj;η; ¼ 1− ð ÞFT i jFi j 2 1−FT i jFi j ; Ri¼Rj¼0; 1− ð ÞFT i jFi j 2 1−FT i jFi j ; Ri≠Rj≠0; FT i jFi j 1−ε 2 1−FT i jFi j ; Ri¼Rj¼kN0; FTi jFi j 1 1−ε1 2 1−FT i jFi j ; Ri¼0; RjN0 or RjN0; Rj¼0; 8 > > > > > > > > > > > > < > > > > > > > > > > > > : ðA:3Þ
tion is equal to that of the control population with probability 1−, and it differs with probability. This relationship also holds if the two re-gions are foci in different abnormal networks (second line of Eq.(A.3)). The third term is similarly obtained by replacingwith 1−. Finally, the probability1in the fourth condition reflects the coupling between ηandif one region is healthy and the other is diseased.
The rsfMRI correlationBijl between regionsiandjin thelth TDC
subject is a noisy observation of the functional connectivityFij:
P B li jjFi j;μ;σ2 ¼ ∏1 k¼−1N Bl i j;μk;σ 2 k Fi jk : ðA:4Þ
Wefixμ0= 0 to center the parameter estimates. The likelihood for Bmi j in the ASD population has the same functional form and parameter values as Eq.(A.4)but relies on the clinical templateFi j. We have previ-ously demonstrated (Venkataraman et al., 2012) that the Gaussian distribution in Eq.(A.4)is a reasonable approximation to the global his-togram of rsfMRI data.
Appendix B. Supplementary Results
Supplementary data to this article can be found online athttp://dx. doi.org/10.1016/j.nicl.2015.04.021.
References
Alexander, A., Lee, J., Lazar, M., Boudos, R., DuBray, M., Oakes, T., Miller, J., Lu, J., Jeong, E., McMahon, W., Bigler, E., Lainhart, J., 2007. Diffusion tensor imaging of the corpus callosum in autism. Neuroimage 34 (1), 61–73 (URLhttp://view.ncbi.nlm.nih.gov/
pubmed/17023185).
Allen, G., Courchesne, E., 2003. Differential effects of developmental cerebellar abnormal-ity on cognitive and motor functions in the cerebellum: an fMRI study of autism. Am. J. Psychiatry 160, 262–273.http://dx.doi.org/10.1176/appi.ajp.160.2.262.
Americal Psychiatric Association, 2013.Diagnostic and Statistical Manual of Mental Disor-ders. 5th ed. American Psychiatric Publishing, Arlington, VA.
Aoki, Y., Abe, O., Nippashi, Y., Yamasue, H., 2013. Comparison of white matter integrity be-tween autism spectrum disorder subjects and typically developing individuals: a meta-analysis of diffusion tensor imaging tractography studies. Mol. Autism 4, 25.
http://dx.doi.org/10.1186/2040-2392-4-25.
Bahnemann, M., Dziobek, I., Prehn, K., Wolf, I., Heekeren, H., 2010. Sociotopy in the temporoparietal cortex: common versus distinct processes. Soc. Cogn. Affect. Neurosci. 5 (1), 48–58.http://dx.doi.org/10.1093/scan/nsp045(URLhttp://dx.doi.
org/10.1093/scan/nsp045).
Barnea-Goraly, N., Kwon, H., Menon, V., Eliez, S., Lotspeich, L., Reiss, A., 2004. White mat-ter structure in autism: preliminary evidence from diffusion tensor imaging. Biol. Psy-chiatry 55 (3), 323–326 (URLhttp://view.ncbi.nlm.nih.gov/pubmed/14744477). Baron-Cohen, S., Ring, H., Wheelwright, S., Bullmore, E., Brammer, M., Simmons, A.,
Williams, S., 1999. Social intelligence in the normal and autistic brain: an fMRI study. Eur. J. Neurosci. 11, 1891–1898.http://dx.doi.org/10.1046/j.1460-9568.1999.
00621.x.
Belin, P., Zatorre, R., Lafaille, P., Ahad, P., Pike, B., 2000. Voice-selective areas in human au-ditory cortex. Nature 403 (6767), 309–312 (URLhttp://view.ncbi.nlm.nih.gov/
pubmed/10659849).
Biswal, B., Yatkin, F., Haughton, V., Hyde, J., 1995.Functional connectivity in the motor cortex of resting human brain using echo-planar MRI. Magn. Reson. Med. 34,
537–541.
Björnsdotter, M., Gordon, I., Pelphrey, K., Olausson, H., Kaiser, M., 2014. Development of brain mechanisms for processing affective touch. Front. Behav. Neurosci. 8.http://
dx.doi.org/10.3389/Fnbeh.2014.00024URLhttp://view.ncbi.nlm.nih.gov/pubmed/
24550800.
Blei, D., Ng, A., Jordan, M., 2003.Latent dirichlet allocation. J. Mach. Learn. Res. 3, 993–1022.
Boddaert, N., Belin, P., Chabane, N., Poline, J., Barthélémy, C., Mouren-Simeoni, M., Brunelle, F., Samson, Y., Zilbovicius, M., 2003. Perception of complex sounds: abnor-mal pattern of cortical activation in autism. Am. J. Psychiatry 160 (11), 2057–2060
(URLhttp://view.ncbi.nlm.nih.gov/pubmed/14594758).
Brothers, L., 1996. Brain mechanisms of social cognition. J. Psychopharmacol. 10, 2–8.
http://dx.doi.org/10.1177/026988119601000102.
Buckner, R.L., Vincent, J.L., 2007. Unrest at rest: default activity and spontaneous network correlations. Neuroimage 37, 1091–1096.http://dx.doi.org/10.1016/j.neuroimage.
2007.01.010.
Chang, L., Yarkoni, T., Khaw, M., Sanfey, A., 2013. Decoding the role of the insula in human cognition: functional parcellation and large-scale reverse inference. Cereb. Cortex 23,
Cherkassky, V., Kana, R., Keller, T., Just, M., 2006.Functional connectivity in a baseline
resting-state network in autism. NeuroReport 17, 1687–1690.
Courchesne, E., Pierce, K., 2005. Why the frontal cortex in autism might be talking only to itself: local over-connectivity but long-distance disconnection. Curr. Opin. Neurobiol. 15, 225–230.http://dx.doi.org/10.1016/j.conb.2005.03.001.
Dawson, G., Finley, C., Phillips, S., Lewy, A., 1989.A comparison of hemispheric asymmetries in speech related brain potentials of autistic and dysphasic children.
Brain Lang. 37, 26–41.
DiMartino, A., Yan, C., Li, Q., Denio, E., Castellanos, F., Alaerts, K., et al., 2014. The autism brain imaging data exchange: towards a large-scale evaluation of the intrinsic brain architecture in autism. Mol. Psychiatry 19.http://dx.doi.org/10.1038/mp.2013.78. Ethofer, T., Anders, S., Erb, M., Herbert, C., Wiethoff, S., Kissler, J., Grodd, W., Wildgruber,
D., 2006. Cerebral pathways in processing of affective prosody: a dynamic causal modeling study. Neuroimage 30 (2), 580–587. http://dx.doi.org/10.1016/j.
neuroimage.2005.09.059(URLhttp://dx.doi.org/10.1016/j.neuroimage.2005.09.059).
Eyler, L., Pierce, L., Courchesne, E., 2012. A failure of left temporal cortex to specialize for language is an early emerging and fundamental property of autism. Brain 135,
949–960.http://dx.doi.org/10.1093/brain/awr364.
Fischl, B., Salat, D.H., van der Kouwe, A.J., Makris, N., Ségonne, F., Quinn, B.T., Dale, A.M., 2004. Sequence-independent segmentation of magnetic resonance images. Neuroimage 23, 69–84.http://dx.doi.org/10.1016/j.neuroimage.2004.07.016. Fox, M.D., Raichle, M.E., 2007. Spontaneousfluctuations in brain activity observed
with functional magnetic resonance imaging. Nature 8, 700–711.http://dx.
doi.org/10.1038/nrn2201.
Gaffrey, M., Kleinhans, N., Haist, F., Akshoomoff, N., Campbell, A., Courchesne, E., Müller, R., 2007. Atypical participation of visual cortex during word processing in autism: an fMRI study of semantic decision. Neuropsychologia 45 (8), 1672–1684.http://dx.doi.org/10.1016/j.neuropsychologia.2007.01.008(URLhttp://
dx.doi.org/10.1016/j.neuropsychologia.2007.01.008).
Gervais, H., Belin, P., Boddaert, N., Leboyer, M., Coez, A., Sfaello, I., Barthélémy, C., Brunelle, F., Samson, Y., Zilbovicius, M., 2004.Abnormal cortical voice processing in autism. Nat.
Neurosci. 7, 801–802.
Geschwind, D., Levitt, P., 2007. Autism spectrum disorders: developmental disconnection syndromes. Curr. Opin. Neurobiol. 17, 103–111.http://dx.doi.org/10.1016/j.conb.2007.
01.009.
Gilbert, S., Bird, G., Brindley, R., Frith, C., Burgess, P., 2008. Atypical recruitment of medial prefrontal cortex in autism spectrum disorders: an fMRI study of two executive function tasks. Neuropsychologia 46, 2281–2291.http://dx.doi.org/10.1016/j.neuropsychologia.
2008.03.025.
Gobbini, M., Haxby, J., 2007. Neural systems for recognition of familiar faces. Neuropsychologia 45 (1), 32–41 (URLhttp://view.ncbi.nlm.nih.gov/pubmed/16797608).
Goodman, S., 2008. A dirty dozen: twelve p-value misconceptions. Semin. Hematol. 45,
135–140.http://dx.doi.org/10.1053/j.seminhematol.2008.04.003.
Gordon, I., Voos, A., Bennett, R., Bolling, D., Pelphrey, K., Kaiser, M., 2013. Brain mecha-nisms for processing affective touch. Hum. Brain Mapp. 34 (4), 914–922.http://dx.
doi.org/10.1002/hbm.21480(URLhttp://view.ncbi.nlm.nih.gov/pubmed/22125232).
Hernandez, L., Rudie, J., Green, S., Bookheimer, S., Dapretto, M., 2014. Neural signatures of au-tism spectrum disorders: insights into brain network dynamics. Neuropsychopharmacol. Rev. 1–19http://dx.doi.org/10.1038/npp.2014.172(epub).
Hickok, G., 2009. The functional neuroanatomy of language. Phys. Life Rev. 6, 121–143.
http://dx.doi.org/10.1016/j.plrev.2009.06.001.
Hoffman, E., Haxby, J., 2000. Distinct representations of eye gaze and identity in the distributed human neural system for face perception. Nat. Neurosci. 3 (1), 80–84.
http://dx.doi.org/10.1038/71152(URLhttp://dx.doi.org/10.1038/71152).
Jastorff, J., Popivanov, I., Vogels, R., Vanduffel, W., Orban, G., 2012. Integration of shape and motion cues in biological motion processing in the monkey STS. Neuroimage 60 (2),
911–921.http://dx.doi.org/10.1016/j.neuroimage.2011.12.087(URLhttp://dx.doi.org/
10.1016/j.neuroimage.2011.12.087).
Johnson, M., Halit, H., Grice, S., Karmiloff-Smith, A., 2002. Neuroimaging of typical and atypical development: a perspective from multiple levels of analysis. Dev. Psychopathol. 41, 521–536.http://dx.doi.org/10.1017/S0954579402003073. Jordan, M., Ghahramani, Z., Jaakkola, T.S., Saul, L.K., 1999.An introduction to variational
methods for graphical models. Mach. Learn. 37, 183–233.
Just, M., Cherkassky, V., Keller, T., Minshew, N., 2004. Cortical activation and synchro-nization during sentence comprehension in high-functioning autism: evidence of underconnectivity. Brain 127, 1811–1821.http://dx.doi.org/10.1093/brain/
awh199.
Just, M., Keller, T., Malavea, V., Kana, R., Varmac, S., 2012. Autism as a neural systems disorder: a theory of frontal–posterior underconnectivity. Neurosci. Biobehav. Rev. 36, 1292–1313.http://dx.doi.org/10.1016/j.neubiorev.2012.02.007.
Kaiser, M., Hudac, C., Shultz, S., Lee, S., Cheung, C., Berken, A., Deen, B., Pitskel, N., Sugrue, D., Voos, A., Saulnier, C., Ventola, P., Wolf, J., Klin, A., Wyk, B.V., Pelphrey, K., 2010. Neural signatures of autism. Proc. Natl. Acad. Sci. U. S. A. 107 (49), 21223–21228.
http://dx.doi.org/10.1073/pnas.1010412107.
Kana, R., Keller, T., Cherkassky, V., Minshew, N., Just, M., 2006. Sentence comprehension in autism: thinking in pictures with decreased functional connectivity. Brain 129 (9), 2484–2493.http://dx.doi.org/10.1093/brain/awl164(URLhttp://dx.doi.org/10.1093/
brain/awl164).
Keller, T., Kana, R., Just, M., 2007. A developmental study of the structural integrity of white matter in autism. Neuroreport 18 (1), 23–27 (URLhttp://view.ncbi.nlm.nih.
gov/pubmed/17259855).
Kennedy, D., Courchesne, E., 2008. The intrinsic functional organization of the brain is al-tered in autism. Neuroimage 39, 1877–1887.http://dx.doi.org/10.1016/j.neuroimage.
2007.10.052.
Kleinhans, N., Müller, R., Cohen, D., Courchesne, E., 2008. Atypical functional lateralization of language in autism spectrum disorders. Brain Res. 1221, 115–125.http://dx.doi.
org/10.1016/j.brainres.2008.04.080(URLhttp://view.ncbi.nlm.nih.gov/pubmed/
18555209).
Knaus, T., Silver, A., Lindgren, K., Hadjikhani, N., Tager-Flusberg, H., 2008. fMRI activation during a language task in adolescents with ASD. J. Int. Neuropsychol. Soc. 14 (6),
967–979.http://dx.doi.org/10.1017/S1355617708081216(URLhttp://view.ncbi.
nlm.nih.gov/pubmed/18954477).
Koshino, H., Carpenter, P., Minshew, N., Cherkassky, V., Keller, T., Just, M., 2005. Functional connectivity in an fMRI working memory task in high-functioning autism. Neuroimage 24, 810–821.http://dx.doi.org/10.1016/j.neuroimage.2004.09.028. Koshino, H., Kana, R., Keller, T., Cherkassky, V., Minshew, N., Just, M., 2008.fMRI
investiga-tion of working memory for faces in autism: visual coding and underconnectivity
with frontal areas. Cereb. Cortex 18, 289–300.
Kreifelts, B., Ethofer, T., Shiozawa, T., Grodd, W., Wildgruber, D., 2009. Cerebral representa-tion of non-verbal emorepresenta-tional perceprepresenta-tion: fMRI reveals audiovisual integrarepresenta-tion area be-tween voice- and face-sensitive regions in the superior temporal sulcus. Neuropsychologia 14, 3059–3066.http://dx.doi.org/10.1016/j.neuropsychologia.2009.
07.001URLhttp://view.ncbi.nlm.nih.gov/pubmed/19596021.
Lai, G., Schneider, H., Schwarzenberger, J., Hirsch, J., 2012a. Speech stimulation during functional MR imaging as a potential indicator of autism. Radiology 260, 521–530.
http://dx.doi.org/10.1148/radiol.11101576.
Lai, G., Pantazatos, S., Schneider, H., Hirsch, J., 2012b. Neural systems for speech and song in autism. Brain 135 (3), 961–975.http://dx.doi.org/10.1093/brain/awr335(URL
http://dx.doi.org/10.1093/brain/awr335).
Lee, J., Bigler, E., Alexander, A., Lazar, M., DuBray, M., Chung, M., Johnson, M., Morgan, J., Miller, J., McMahon, W., Lu, J., Jeong, E., Lainhart, J., 2007. Diffusion tensor imaging of white matter in the superior temporal gyrus and temporal stem in autism. Neurosci. Lett. 424 (2), 127–132.http://dx.doi.org/10.1016/j.neulet.2007.07.042(URLhttp://dx.
doi.org/10.1016/j.neulet.2007.07.042).
MATLAB, 2013.Version 8.2.0.701 (R2013b). The MathWorks Inc., Natick, MA.
Melillo, R., Leisman, G., 2011. Autistic spectrum disorders as functional disconnection syndrome. Rev. Neurosci. 20, 111–131.http://dx.doi.org/10.1515/REVNEURO.2009.20.
2.111.
Minshew, N., Keller, T., 2010. The nature of brain dysfunction in autism: functional brain imaging studies. Curr. Opin. Neurol. 23 (2), 124–130 (URLhttp://view.ncbi.nlm.nih.
gov/pubmed/20154614).
Müller, R., Chugani, D., Behen, M., Rothermel, R., Muzik, O., Chakraborty, P., Chugani, H., 1998. Impairment of dentato-thalamo-cortical pathway in autistic men: language ac-tivation data from positron emission tomography. Neurosci. Lett. 245 (1), 1–4 (URL
http://view.ncbi.nlm.nih.gov/pubmed/9596341).
Müller, R., Behen, M., Rothermel, R., Chugani, D., Muzik, O., Mangner, T., Chugani, H., 1999a. Brain mapping of language and auditory perception in high-functioning autis-tic adults: a PET study. J. Autism Dev. Disord. 29 (1), 19–31 (URLhttp://view.ncbi.
nlm.nih.gov/pubmed/10097992).
Müller, R., Rothermel, R., Behen, M., Muzik, O., Chakraborty, P., Chugani, H., 1999b. Language organization in patients with early and late left-hemisphere lesion: a PET study. Neuropsychologia 37 (5), 545–557 (URL http://view.ncbi.nlm.nih.gov/
pubmed/10340314).
Müller, R.-A., Kleinhans, N., Kemmotsu, N., Pierce, K., Courchesne, E., 2003. Abnormal vari-ability and distribution of functional maps in autism: an fMRI study of visuomotor learn-ing. Am. J. Psychiatry 160, 1847–1862.http://dx.doi.org/10.1176/appi.ajp.160.10.1847. Noonan, S., Haist, F., Müller, R., 2009. Aberrant functional connectivity in autism: evidence
from low-frequency bold signalfluctuations. Brain Res. 1262, 48–63.http://dx.doi.
org/10.1016/j.brainres.2008.12.076.
Oberman, L., Ramachandran, V., 2008. Preliminary evidence for deficits in multisensory integration in autism spectrum disorders: the mirror neuron hypothesis. Soc. Neurosci. 3, 348–355.http://dx.doi.org/10.1080/17470910701563681.
Paakki, J., Rahko, J., Long, X., Moilanen, I., Tervonen, O., Nikkinen, J., Starck, T., Remes, J., Hurtig, T., Haapsamo, H., Jussila, K., Kuusikko-Gauffin, S., et al., 2010. Alterations in re-gional homogeneity of resting-state brain activity in autism spectrum disorders. Brain Res. 1321, 169–179.http://dx.doi.org/10.1016/j.brainres.2009.12.081.
Pelphrey, K., Yang, D.Y.-J., McPartland, J., 2014. Building a social neuroscience of autism spectrum disorder. Curr. Top. Behav. Neurosci. 16, 215–233.http://dx.doi.org/10.
1007/7854_2013_253.
Philip, R., Dauvermann, M., Whalley, H., Baynham, K., Lawrie, S., Stanfield, A., 2012. A systematic review and meta-analysis of the fMRI investigation of autism spectrum disorders. Neurosci. Biobehav. Rev. 36 (2), 901–942.http://dx.doi.org/10.1016/j.
neubiorev.2011.10.008(URLhttp://view.ncbi.nlm.nih.gov/pubmed/22101112).
Poldrack, R., Halchenko, Y., Hanson, S., 2009.Decoding the large-scale structure of brain function by classifying mental states across individuals. Psychol. Sci. 20,
1364–1372.
Price, C., 2009. The anatomy of language: a review of 100 fMRI studies published in 2009. Ann. N. Y. Acad. Sci. 1191, 62–88.http://dx.doi.org/10.1111/j.1749-6632.2010.05444.x. Redcay, E., Courchesne, E., 2008. Deviant functional magnetic resonance imaging patterns
of brain activity to speech in 2–3-year-old children with autism spectrum disorder. Biol. Psychiatry 64, 589–598.http://dx.doi.org/10.1016/j.biopsych.2008.05.020. Rippon, G., Brock, J., Brown, C., Boucher, J., 2007. Disordered connectivity in the autistic
brain: challenges for the“new psychophysiology”. Int. J. Psychophysiol. 63,
164–172.http://dx.doi.org/10.1016/j.ijpsycho.2006.03.012.
Smith, S.M., Jenkinson, M., Woolrich, M.W., Beckmann, C.F., Behrens, T.E., Johansen-Bern, H., Bannister, P.R., Luca, M.D., Drobnjak, I., Flitney, D.E., Niazy, R.K., Saunders, J., Vickers, J., Zhang, Y., Stefano, N.D., Brady, J.M., Matthews, P.M., 2004. Advances in functional and structural MR image analysis and implementation as FSL. Neuroimage 23, 208–219.http://dx.doi.org/10.1016/j.neuroimage.2004.07.051.
Sullivan, K., Stone, W., Dawson, G., 2014. Potential neural mechanisms underlying the effectiveness of early intervention for children with autism spectrum disorder. Res. Dev. Disabil. 35, 2921–2932.http://dx.doi.org/10.1016/j.ridd.2014.07.027.
of the human brain: implications for neurodevelopmental disorders. Curr. Opin. Neurol. 27, 1–8.http://dx.doi.org/10.1097/WCO.0000000000000069.
van Dijk, K.R.A., Hedden, T., Venkataraman, A., Evans, K., Lazar, S., Buckner, R., 2010. Intrin-sic functional connectivity as a tool for human connectomics: theory, properties and
optimization. J. Neurophysiol. 103, 297–321.
Venkataraman, A., 2012.Generative Models of Brain Connectivity for Population Studies. (Ph.D. thesis). Massachusetts Institute of Technology.
Venkataraman, A., Rathi, Y., Kubicki, M., Westin, C.-F., Golland, P., 2012.Joint modeling of anatomical and functional connectivity for population studies. IEEE Trans. Med.
Imaging 31, 164–182.
Venkataraman, A., Kubicki, M., Golland, P., 2013. From brain connectivity models to region labels: identifying foci of a neurological disorder. IEEE Trans. Med. Imaging 32, 2078–2098.http://dx.doi.org/10.1109/TMI.2013.2272976.
Villalobos, M., Mizuno, A., Dahl, B., Kemmotsu, N., Müller, R., 2005.Reduced functional connectivity between v1 and inferior frontal cortex associated with visuomotor
performance in autism. Neuroimage 25, 916–925.
von dem Hagen, E., Stoyanova, R., Baron-Cohen, S., Calder, A., 2013. Reduced functional connectivity within and between‘social’resting state networks in autism spectrum conditions. Soc. Cogn. Affect. Neurosci. 8, 694–701.http://dx.doi.org/10.1093/scan/
nss053.
Voos, A., Pelphrey, K., Kaiser, M., 2013. Autistic traits are associated with diminished neural response to affective touch. Soc. Cogn. Affect. Neurosci. 8, 378–386.http://
dx.doi.org/10.1093/scan/nss009.
125–136.http://dx.doi.org/10.1016/j.cortex.2013.07.011(URLhttp://dx.doi.org/10.
1016/j.cortex.2013.07.011).
Wildgruber, D., Ackermann, H., Kreifelts, B., Ethofer, T., 2006. Cerebral processing of linguistic and emotional prosody: fMRI studies. Prog. Brain Res. 156, 249–268.
http://dx.doi.org/10.1016/j.neuroimage.2005.09.059(URLhttp://view.ncbi.nlm.nih.
gov/pubmed/17015084).
Wolff, J., Gu, H., Gerig, G., Elison, J., Styner, M., Gouttard, S., et al., 2012. Differences in white matterfiber tract development present from 6 to 24 months in infants with autism. Am. J. Psychiatry 169, 589–600.http://dx.doi.org/10.1176/appi.ajp.2011.
11091447.
Xia, M., Wang, J., He, Y., 2013. Brainnet viewer: a network visualization tool for human brain connectomics. PLoS ONE 8, e68910.http://dx.doi.org/10.1371/journal.pone.
0068910.
Yang, D., Rosenblau, G., Keifer, C., Pelphrey, K., 2015. An integrative neural model of social perception, action observation, and theory of mind. Neurosci. Biobehav. Rev. 51, 263–275 (URLhttp://view.ncbi.nlm.nih.gov/pubmed/25660957).
Yarkoni, T., Barch, D., Gray, J., Conturo, T., Braver, T., 2009. Bold correlates of trial-by-trial reaction time variability in gray and white matter: a multi-study fMRI analysis. PLoS ONE 4, e4257.http://dx.doi.org/10.1371/journal.pone.0004257.
Yarkoni, T., Poldrack, R., Nichols, T., Essen, D.V., Wager, T., 2011. Large-scale automat-ed synthesis of human functional neuroimaging data. Nat. Methods 8, 665–670.