Flexural Fatigue Behaviour of Corroded
Pretensioned Beams and Their Repair Using
Carbon Fibre Reinforced Polymer Sheets
by
Adham El Menoufy
A thesis
presented to the University of Waterloo in fulfillment of the
thesis requirement for the degree of Doctor of Philosophy
in
Civil Engineering
Waterloo, Ontario, Canada, 2015 ©Adham El Menoufy 2015
AUTHOR'S DECLARATION
This thesis consists of material all of which I authored or co-authored: see Statement of Contributions included in the thesis. This is a true copy of the thesis, including any required final revisions, as accepted by my examiners.
STATEMENT OF CONTRIBUTIONS
I would like to acknowledge the names of my co-authors who contributed to the research presented in this dissertation:
Professor Khaled Soudki Professor Timothy Topper
Abstract
The study presented in this thesis investigated the flexural fatigue behaviour of non-corroded and corroded pretensioned beams and examined the use of externally bonded Carbon Fibre Reinforcement Polymer (CFRP) sheets as a repair technique aimed at restoring the loss in capacity due to corrosion. This was accomplished through an extensive experimental and analytical program.
The experimental program was comprised of a material testing phase and a beam testing phase. The material testing phase consisted of testing seventy-two (72) material samples under monotonic and cyclic axial loading, full strand testing, and corrosion measurements of prestressing strands corroded while embedded in concrete prism. Material testing achieved multiple objectives: (a) it identified the rate of accelerated corrosion of the prestressing strands, (b) it quantified the distribution of the applied nominal tensile force among the seven wires within a single 7-wire strand in a prestressed strand, (c) it determined the material fatigue properties, and the stress-strain behaviour of the strand wires, and (d) it quantified the stress concentration factor in the prestressing strand due to corrosion. The beam testing involved constructing thirty-seven (37) 3.6 m long pretensioned T-beams and testing them in a four-point bending configuration. Twelve (12) beams were tested under monotonic loading, and twenty-five (25) beams were tested under cyclic loading. The main testing variables included: the corrosion level, the applied stress range, and a repair or the lack of it.
Corrosion resulted in a significant deterioration of the monotonic and fatigue resistance of the beams in comparison to non-corroded beams, and repair using externally bonded CFRP sheet
failed by rupture of the prestressing strand. Inspection of the strand’s fracture surface showed signs of surface fretting. In addition, the fracture profile was similar to that reported by Toribio and Ovejero (2005) for hydrogen induced stress cracking of heavily cold drawn prestressing wires. Strands having corrosion levels of 5% and 10% by mass loss exhibited an overall section loss together with distinct deep corrosion pits.
In the analysis phase, fatigue data measured from smooth axial samples taken from the centre wire of a prestrssing strand was used to model the fatigue behaviour of the outer wires of the 7-wire prestressing strand for corroded and non-corroded pretensioned beams. Strain-based fracture mechanics was employed in all the analyses, which included the flexure fatigue behaviour of: non-corroded and corroded single prestressing wires-in-air, a full 7-wire prestressing strand-in-air, and a non-corroded and corroded 7-wire prestressing strand in a beam. The mode results correlated well with the observed experimental results.
This thesis presents extensive experimental work, along with an in depth fatigue analysis that is based on material fatigue properties obtained from simple single wire cyclic testing. The resulting modelling approach offers a mechanistic explanation of 7-wire prestressing strand failure under various conditions.
Acknowledgements
There are many people in my life that whom without I would not be where I am today, and for that I hold them at the highest regards and would like to acknowledge. First and foremost, I would like to deeply thank my wife, Mona, for her love and unwavering support; our daughters Maya and Layla, they are the source of our inspiration, strength, and motivation. I also would like to thank my parents: my mother, Heba; my father, Mohamed; and my sister, Nelly, for all of their support and encouragement throughout my life.
I am sincerely thankful to have had the opportunity to work with, and know, Professor Khaled Soudki during his life. Professor Soudki admirably cared about his students and was always there for us. He was, and remains to be an immense inspiration, a mentor, and a true friend.
I genuinely thank Professor Timothy Topper for his continuous guidance and support. His immeasurable dedication, commitment to his students, wealth of knowledge, and his love for research are a great inspiration. Thank you to Professor Giovanni Cascante for his support and guidance. I would also like to thank my committee members, Professor(s) Mark Green, Scott Walbridge, Steve Lambert and Tarek Hegazy for reviewing my thesis, evaluating my research, and for their insightful feedback.
I am grateful to the technical staff at the University of Waterloo for their expertise and support throughout my graduate studies, namely, Richard Morrison, Douglas Hirst, Rob Sluban, Ken Bowman, Terry Ridgeway, John Boldt, and Rick Forgett. Thanks to my friends and colleagues, Ayman Shihata, Amr Ezzat, Rania Al-hammoud, Rayed Alyousef, Rizwan Azam, Hisham Elhuni, Martin Noel, Mohamed Zawam, Noran Abdelwahab, and Taha Younes. Moreover, I
would like to thank the administrative staff at the Department of Civil and Environmental Engineering for all the support.
Lastly, I would like to acknowledge Hanson Pipe and Precast for their contributions to the construction of the precast-pretensioned beams. Also I would like to thank Pretium Anderson Building Engineers and the Natural Sciences and Engineering Research of Canada (NSERC) for their financial support during my PhD program.
IN MEMORY OF
PROFESSOR KHALED ADNAN SOUDKI
Table of Contents
Table of Contents ... ix
List of Figures ... xiv
List of Tables ... xxiii
Chapter 1 Introduction... 1
1.1 Research objectives ... 3
1.2 Research methodology ... 4
1.3 Thesis organization ... 4
Chapter 2 Background and Literature Review ... 6
2.1 Corrosion of Steel Reinforcement ... 6
2.1.1 Corrosion mechanism ... 6
Carbonation initiated corrosion ... 7
Chloride initiated corrosion ... 7
2.1.2 Types of corrosion cells ... 8
2.1.3 Corrosion reactions ... 9
2.1.4 Laboratory accelerated corrosion techniques ... 10
Artificial climate environment for accelerating corrosion ... 11
Galvanostatic method of accelerating corrosion ... 11
2.2 Prestressed Concrete ... 12
2.2.1 Methods of Prestressing Concrete ... 12
2.3 Fatigue of Reinforced Concrete Structures ... 14
2.3.1 Fatigue of plain concrete ... 14
2.3.2 Fatigue of steel deformed bars ... 17
Bar Deformation geometry ... 19
Yield Strength and bending effect ... 19
2.4 Fatigue of Prestressed Concrete Structures ... 20
2.4.1 Fatigue of prestressing reinforcements ... 20
Wires ... 20
Strands ... 21
Bars ... 24
2.4.2 Fretting fatigue of prestressing strands ... 24
2.4.3 Fatigue of pretensioned beams ... 29
2.5 Corrosion of Prestressed Concrete Structures ... 35
2.5.1 Fracture modes of prestressing reinforcement due corrosion and cyclic loading ... 35
Brittle fracture ... 35
Stress corrosion cracking (SCC) induced fracture ... 36
Fatigue and corrosion induced fracture ... 42
2.5.2 Effects of corrosion on prestressed concrete structures ... 43
2.6 Rehabilitation of Non-Prestressed Concrete Structures Using Fibre Reinforced Polymer (FRP) ... 51
2.6.1 FRP strengthening and repair of RC beams subjected to monotonic loading ... 51
2.6.2 FRP strengthening and repair of RC beams subjected to fatigue loading ... 53
2.6.3 FRP strengthening and repair of prestressed beams subjected to monotonic and fatigue loading ... 57
2.7 Summary ... 61
Chapter 3 Experimental program ... 63
3.1 General ... 63
3.2.2 Phase II ... 67 3.2.3 Phase III ... 67 3.3 Beams Nomenclature ... 68 3.4 Beam Design ... 69 3.4.1 Concrete ... 69 3.4.2 Prestressing strands... 70
3.4.3 Non prestressed flexural reinforcement ... 70
3.4.4 Shear Reinforcement ... 70
3.5 Accelerated Corrosion ... 70
3.6 Beam Construction ... 71
3.7 Mass Loss Analysis ... 76
3.8 Carbon Fibre Reinforced Polymer (CFRP) repair... 76
3.9 Test setups ... 79
3.9.1 Ancillary tests ... 79
Tensile monotonic test setup for 7-wire strands ... 79
Single wire fatigue test setup ... 80
3.9.2 Monotonic beam test setup ... 81
3.9.3 Fatigue beam test setup ... 84
Chapter 4 Experimental Results... 87
4.1 Ancillary Testing – Phase I (a) ... 87
4.1.1 Gravimetric mass loss analysis ... 88
4.2 7-Wire Strand Monotonic Testing - Phase I (b) ... 89
4.3 Material Fatigue Testing – Phase I (c) and (d) ... 94
Phase I (d)-Testing of corroded external wire ... 99
4.4 Monotonic Beam Testing ... 102
4.4.1 Accelerated corrosion results ... 102
4.4.2 Monotonic test results ... 104
Beams prestressed with a single 7-wire strand... 106
Beams prestressed with two7-wire strands ... 117
Beams repaired with CFRP sheets ... 124
4.5 Fatigue Testing ... 131
Chapter 5 Fatigue Analysis and Discussion... 137
5.1 Nomenclature ... 137
5.2 Prestressing strand nominal stress ... 138
5.2.1 Calculation of prestress loss ... 138
5.3 Force Distribution for the 7-wire Strand ... 142
5.4 Discussion of the Stress Range or Strain Range versus Fatigue Life Results ... 146
5.4.1 Fatigue resistance of a non-corroded wire in air, strand in air and a strand inside a beam specimens ... 146
5.4.2 Fatigue resistance of a corroded single wire-in-air and a corroded strand-in-a beam 155 5.4.3 Comparison of the fatigue resistance of non-corroded and corroded strand-in-beam specimens... 159
5.4.4 Fatigue resistance of corroded strand-in-beams repaired with CFRP ... 160
5.5 Fracture Mechanics of Fatigue Crack Propagation ... 162
5.5.1 Fatigue crack growth rate ... 165
5.5.2 Effect of the stress ratio (R) on the fatigue crack growth rate ... 167
5.5.3 Effect of a notch on fatigue life ... 170
5.8 Modelling of the Deteriorated Fatigue Resistance Due to Corrosion Pitting ... 187
5.8.1 Corroded single wire-in-air specimens ... 187
5.8.2 Corroded strand-in-beam specimens ... 194
5.8.3 Corroded strand-in-beam repaired with CFRP ... 197
5.9 Summary ... 202
Chapter 6 Summary, Conclusions and Recommendations ... 206
6.1 Summary ... 206
6.1.1 Beam Testing ... 207
Monotonic behaviour ... 207
Fatigue behaviour ... 208
Material Testing ... 209
Analysis and Modelling... 210
6.2 Conclusions ... 212
6.3 Recommendations for Future Work ... 214
List of Figures
Figure 2-1 – Schematic of (a) micro-cell versus (b) macro-cell corrosion (Poursaee and Hansson
2009) ... 9
Figure 2-2 – Volume comparison of oxide of iron (Mansfeld et al. 1982) ... 10
Figure 2-3 – Prestressed concrete schematic: (a) post-tensioning, and (b) pre-tensioning ... 13
Figure 2-4 – Fatigue strength of plain concrete beams (Mordock 1965) ... 16
Figure 2-5 – Modified Goodman's diagram (ACI 215R-74 1974) ... 16
Figure 2-6 – Stress range vs. life curves for reinforcing bars (ACI 215R-74 1974) ... 17
Figure 2-7 – Fracture surface of 35M (35.7 mm diameter) deformed steel bar (ACI 215R-74 1974) ... 18
Figure 2-8 – 7-wire prestressing strand ... 22
Figure 2-9 – Strength envelopes for strand tested in United States (ACI 215R-74 1974) ... 22
Figure 2-10 – Complied fatigue test results for prestressing strand as an isolated element, the statistical design expression of 95% of no failure, Paulson et al. (1983) ... 24
Figure 2-11 – Stress range vs. fatigue life for post-tensioned beams with strands in metal ducts (Wollmann, 1996) ... 26
Figure 2-12 – Elliptical pressure mark on single wire and the fracture surface, Bahke (1980) ... 27
Figure 2-13 – Load range vs. fatigue life curves for non-fretted and fretted wire specimens (Cullimore, 1979) ... 28
Figure 2-14 – Comparison of the mean regression line of pretensioned beam fatigue test results to Paulson et al. (1983) lower bound strand-in-air model, Overman et al. (1984) ... 30 Figure 2-15 – Comparison of the mean regression line of large scale pretensioned beam fatigue
Figure 2-16 – Large-scale pretensioned beams fatigue test results in comparison to Paulson et al. (1983) lower bound strand-in-air model, Overman et al. (1984) ... 32 Figure 2-17 – Fatigue properties of 5mm cold deformed prestressing steel in relation to the depth of local corrosion (Nurnberger 2002) ... 36 Figure 2-18 – Fracture profile of Hydrogen Assisted Cracking (HAC) at different level of cold drawing (Toribio and Ovejero, 2005) ... 39 Figure 2-19 – A comparison between stressed and unstressed corroded wires (Ngoc et al. 2009) ... 40 Figure 2-20 – Wire fracture plane before immersion (left) and after 96 hrs of immersion (right) in ammonium thiocyanate solution ... 41 Figure 2-21 – Wire surface before immersion (left) and after 96 hrs of immersion (right) in ammonium thiocyanate solution ... 42 Figure 2-22 – Fatigue behaviour of cold drawn prestressing steel wire tested in air, tap-water and sea-water, (Nurnberger, 2002) ... 43 Figure 2-23 – Fracture surface a) non-corroded wire, and b) corroded wire (Darmawan and Stewart, 2007) ... 46 Figure 2-24 – Distribution of cross sectional area reduction vs. time (Darmawan and Stewart, 2007) ... 48 Figure 2-25 – Comparison of load versus midspan deflection for beams at different corrosion levels (Rinaldi et al. 2010) ... 49 Figure 2-26 – Load vs. midspan deflection curves for control, corroded/non-strengthened and corroded/strengthened beams (Soudki and Sherwood, 2000)... 52
Figure 2-27 – Load vs. midspan deflection curves for non-strengthened and strengthened beams
subjected to no wetting and drying cycles (Soudki et al, 2007) ... 53
Figure 2-28 – Moment range versus fatigue life of non-strengthened and strengthened reinforced concrete beams (Heffernan and Erki, 2004) ... 55
Figure 3-1 – Schematic of the concrete prisms ... 64
Figure 3-2 – Machined single wire specimens for fatigue testing ... 65
Figure 3-3 – Schematic of the corrosion electrical circuit ... 71
Figure 3-4 – Beam dimensions and reinforcement details... 73
Figure 3-5 – Beam forms along the prestressing bed ... 74
Figure 3-6 – Prestressing wedge anchor ... 75
Figure 3-7 – Salted portion of the beam ... 75
Figure 3-8 – CFRP sheets repair configuration ... 78
Figure 3-9 – Beams after application of CFRP sheet repair ... 78
Figure 3-10 – Monotonic test setup and instrumentation of 7-wire prestressing strand ... 80
Figure 3-11 – Schematic of beam test setup in four-point bending configuration ... 82
Figure 3-12 – LVDTs for crack opening measurements ... 83
Figure 3-13 – OSMOS FOS across flexure zone for average strain readings at the level of the strand ... 83
Figure 3-14 – Midspan deflection measurement by an external LVDT ... 85
Figure 3-15 – 60 mm strain gauge to monitor the concrete compressive strain ... 85
Figure 3-16 – External LVDTs monitoring flexure cracks width ... 86
Figure 4-3 – Applied load versus individual external wire measured tensile strain ... 91
Figure 4-4 – Applied load versus 7-wire strand elongation ... 91
Figure 4-5 – Applied load versus load carrying capacity per individual wire ... 93
Figure 4-6 – Average load carrying contributions per wire as a percentage of the total load ... 93
Figure 4-7 – Fatigue Life versus strain amplitude of uncorroded centre wire samples ... 97
Figure 4-8 – Fatigue Life versus stress amplitude of uncorroded centre wire samples ... 97
Figure 4-9 – True strain amplitude versus true stress amplitude response for uncorroded centre wire sample ... 98
Figure 4-10 – Stress amplitude versus life for all material samples ... 100
Figure 4-11 – Stainless steel tube configurations for the beams with two prestressing strands . 102 Figure 4-12 – Typical corrosion induced cracking in (a) beams with a single strand, and (b) beams with two strands ... 104
Figure 4-13 – Corrosion induced crack measurements at midspan ... 104
Figure 4-14 – LVDT mounted at beam end to monitor end slip of prestressing strand ... 105
Figure 4-15 – Experimental vs. theoretical elastic deflection response for beams with one strand ... 108
Figure 4-16 – Load vs. midspan deflection at different corrosion levels for beams with one strand ... 110
Figure 4-17 – Load vs. midspan concrete compressive strain at different corrosion levels for beams with one strand ... 110
Figure 4-18 – Cumulative crack opening within the constant moment zone vs. load ... 111 Figure 4-19 – Average tensile strain at the level of the strand vs. load at different corrosion levels
Figure 4-20 – Cracking pattern at failure for an uncorroded beam ... 113
Figure 4-21 – Cracking pattern at failure for a corroded beam ... 113
Figure 4-22 – Concrete strand interface below the strand ... 114
Figure 4-23 – Concrete strand interface above the strand ... 114
Figure 4-24 – Multi-wire rupture at the same location for the uncorroded beam ... 115
Figure 4-25 – Wires rupture at adjacent locations in a corroded beam ... 116
Figure 4-26 – Experimental vs. theoretical deflection response for beams with 2 strands ... 119
Figure 4-27 – Load vs. midspan deflection at different corrosion levels for beams with 2 strands ... 122
Figure 4-28 – Load vs. midspan concrete compressive strain for beams with two strand ... 122
Figure 4-29 – Cumulative crack opening within the constant moment zone vs. load ... 123
Figure 4-30 – Average tensile strand strain vs. load at different corrosion levels ... 123
Figure 4-31 – Failure by concrete crushing of beam ST-2S-10%-NW-SC ... 124
Figure 4-32 – Load vs. midspan deflection comparison of the repaired and unrepaired beams 127 Figure 4-33 – Load vs. concrete midspan compressive strain for corroded and repaired beams 127 Figure 4-34 – Load vs. CFRP strain at midspan for corroded and repaired beams ... 128
Figure 4-35 – Typical failure of a prestressed beam repaired by CFRP sheets ... 128
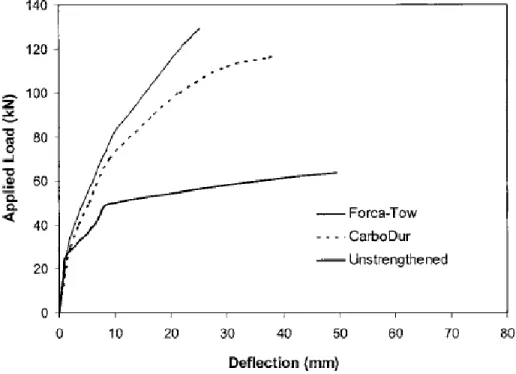
Figure 4-36 – Design repair load capacity compared to experimental response of the beam corroded to 5% by mass loss ... 130
Figure 4-37 – Design repair load capacity compared to experimental response for the beam corroded to 5% by mass loss ... 130
Figure 4-39 –Midspan deflection versus fatigue life response of non-repaired beams with
different corrosion levels ... 136
Figure 5-1 – Calculation flowchart for calculating the prestressing strand stress level due to moment applied on the beam ... 140
Figure 5-2 – (a) Schematics of 7-wire strand (b) Force diagram for an external wire, and (c) change in geometry (length and rotation) due to applied load F (Castello, 1997) ... 143
Figure 5-3 – Strain range versus fatigue life data for all the fatigue tests ... 146
Figure 5-4 – wire-in-air, strand-in-air, and strand-in-beam versus fatigue life ... 147
Figure 5-5 – Close up of a 7-wire strand as extracted from the beam after fatigue failure ... 150
Figure 5-6 – Close of the centre wire of a 7-wire prestressing strand at the failure location as extracted from the beam after failure ... 151
Figure 5-7 – Close-up of concrete-wire fretting damage on an external wire of the 7-wire prestressing strand as extracted from the beam after failure... 151
Figure 5-8 – Close-up of inter-wire fretting damage on an external wire of a 7-wire prestressing strand as extracted from the beam after failure ... 152
Figure 5-9 – Close up of the fracture surface of the wire shown in Figure 5-7 & Figure 5-8 .... 152
Figure 5-10 – Fatigue fracture plane of the wire shown in Figure 5-7 & Figure 5-8 ... 153
Figure 5-11 – 200× magnification of the fretting damage circled in Figure 5-10 ... 153
Figure 5-12 – 200× magnification of a sample the fretting damage ... 154
Figure 5-13 – Strain range-fatigue life behaviour of wire-in-air, corroded-wire-in-air & (5% & 10%) corroded strand-in-a beam ... 155
Figure 5-16 – Pitting cross section through the failure plain on corroded single wire specimens
... 158
Figure 5-17 – Comparison of the Strain range-Life behaviour of non-corroded strand-in-beam & (5% & 10%) corroded strand-in-beam ... 160
Figure 5-18 – Strain range versus the fatigue life data for the corroded strand-in-beam non-repaired and non-repaired with CFRP specimens ... 161
Figure 5-19 – Constant amplitude cyclic loading ... 163
Figure 5-20 – Graphical representation of the fatigue crack growth rate ... 165
Figure 5-21 – Schematic of the different stages of fatigue crack growth ... 167
Figure 5-22 – Schematic showing the effect of the stress ratio on the fatigue crack growth rate ... 168
Figure 5-23 – Effect of a notch on the fatigue resistance ... 171
Figure 5-24 – Load range vs. fatigue life for non-corroded and corroded concrete reinforced beams (Soudki et al., 2007)... 172
Figure 5-25 – Schematic of the impact of notch/crack within a notch on fatigue resistance ... 173
Figure 5-26 – Fatigue behaviour of cold drawn prestressing steel wire tested in air, tap-water and sea-water, (Nurnberger, 2002) ... 174
Figure 5-27 – Schematic showing fitting the experimental Strain-Life data by an assumed intrinsic strain range (i) ... 176
Figure 5-28 – Schematic of fatigue crack growth rate versus the stress intensity factor ... 177
Figure 5-29 – Derived crack growth rate for 7-wire prestressing strand steel ... 179 Figure 5-30 – Comparison of the Strain-Life curve based on the fracture mechanics analysis of
Figure 5-31 – Schematic of the fatigue crack propagation from the fretting induced flaw is presented ... 182 Figure 5-32 – Strain versus fatigue life comparison of experimental and modelled non-corroded-strand-in-beam specimens ... 183 Figure 5-33 – Experimental results from the literature for pretensioned beams and fatigue life results and modelling from the present study ... 184 Figure 5-34 – Comparison of the modelled Strain-Fatigue life curve to Paulson et al. (1983) data using an incremental introduction of the fretting damage ... 186 Figure 5-35 – Strain-fatigue life modelling using a strain-life approach (Kt=2.19 and 10) ... 188 Figure 5-36 – Schematic for a fatigue crack propagating from a secondary notch at the root of the primary notch ... 189 Figure 5-37 – Strain-fatigue life model of corroded-wire-in-air specimens ... 192 Figure 5-38 – Strain-fatigue life modelling of corroded-wire-in-air specimens (incremental introduction of the flaw at the notch root) ... 194 Figure 5-39 – Schematic showing a fatigue crack propagating from a fretting induced flaw intersecting the edge of a pit for a corroded strand-in-beam specimen ... 195 Figure 5-40 – Strain-fatigue life model of corroded-strand-in-beam specimens Adham correct spelling ... 197 Figure 5-41 – Modelled and experimental strain range vs. fatigue life data for non-repaired and repaired corroded strand-in-beam specimens ... 198 Figure 5-42 – Load vs. midspan deflection comparison of the repaired and unrepaired beams 200 Figure 5-43 – Modelled strange range vs. fatigue life curve non-repaired and repaired corroded
List of Tables
Table 3-1 –Ancillary testing program ... 66 Table 3-2 –Beam testing program... 68 Table 3-3 - Mix proportions for a 1m3 batch ... 69 Table 3-4 – Average concrete compressive strength at transfer ... 76 Table 3-5 – Cured CFRP laminate properties with Sikadur® 330 epoxy ... 77 Table 4-1 – Breakdown of actual number of uncorroded samples tested for material properties 94 Table 4-2 – Summary of cyclic testing data of non-corroded centre wire samples ... 96 Table 4-3 – Cyclic material properties of low relaxation 7-wire prestressing strands ... 98 Table 4-4 – Summary of cyclic testing data for corroded external wire samples ... 101 Table 4-5 – Monotonic testing result summary of beam prestressed with single strand ... 107 Table 4-6 – Summary of the measured ultimate concrete compressive strength for beams with a single prestressing strand ... 109 Table 4-7 – Monotonic testing result summary of beam prestressed with two strands ... 118 Table 4-8 – Summary of measured ultimate midspan concrete compressive strain for beams with two prestressing strands ... 120 Table 4-9 – Test result summary for CFRP repaired, unrepaired, and control beams ... 126 Table 4-10 – Fatigue testing matrix ... 131 Table 4-11 – Summary of fatigue testing of prestressed T-beams ... 133 Table 5-1 – Summary of beam fatigue results and calculated nominal strand stresses ... 141 Table 5-2 – Fatigue crack growth rate parameters ... 179
Chapter 1
Introduction
Prestressing is a technique that has been widely used for decades in all sorts of concrete structures. Its ability to minimize reinforcement congestion, decrease deflection, and control cracking under service loads has made it a widely popular choice for large spans and for the precast industry. Prestressing a member can be achieved through pre-tensioning or post-tensioning of tendons/wires as the main tension reinforcement. Pre-post-tensioning is widely adopted by the precast industry while post-tensioning is primarily used for cast in-place concrete structures.
Bridge infrastructure in North America is aging with more than 40% percent of the bridges built in Canada and the United States being over 50 years old (Pakniat and Hammad 2008), and in need of significant maintenance, rehabilitation, or replacement. Many prestressed concrete bridge structures are subjected to corrosive environments. In addition, the Ontario highway network bridge latest inventory lists a total of 2802 bridges, out of which 1124 (40%) are prestressed concrete structures. One of the major reasons for this is the limited corrosion resistance of old structures and the continually increasing use of de-icing salts in cold regions, (PCI Bridge Design Manual Steering Committee 2011). Bridge infrastructure is also subjected to an increasing number of fatigue load cycles due to increased traffic demand.
In evaluating bridge rehabilitation options, it is very important to consider the differences between pre-stressed/pre-tensioned structures and reinforced concrete structures in the form of
away spalled or delaminated concrete, and cleaning reinforcement or even replacing it, is not always viable for pretensioned concrete structures because of the risk involved in exposing a highly stressed, heavily corroded steel prestressing strand. Often in pretensioned members the prestressed strands are designed as the main flexural reinforcement, making their corrosion a critical deterioration of the structure that requires immediate intervention. Although corrosion effects on the fatigue performance of steel rebars are well documented and studied; only limited studies have focused on the corrosion fatigue of prestressing strand or wire (ACI 222.2R-14). To the author’s knowledge, only very limited research is available in the literature on the fatigue behaviour of corroded pretensioned concrete members. There are no available studies that address repair techniques to restore the capacity of corroded pretensioned concrete members subjected to cyclic/fatigue loading. This topic is of critical importance and needs to be addressed because of the aging bridge infrastructure and increased load demands.
This study focuses on studying the impact of the corrosion of prestressing steel strands on the residual capacity of pretensioned concrete T-beams subjected to fatigue loading, and investigates a viable repair technique that uses Carbon Fibre Reinforced Polymer (CFRP) sheets. It consists of experimental and analytical phases. The experimental phase comprises of T-beam testing as well as material testing on 7-wire prestressing strands. The beam testing involves the construction and testing of thirty-seven (37) pretensioned concrete T-beams under monotonic and fatigue cyclic loading. The experimental variables are the corrosion level (0%, 5%, and 10% by mass loss), the repair condition (unrepaired beams and repaired beams using adhesively bonded CFRP sheets, and the fatigue stress range as a percentage of the monotonic ultimate load
experimentally quantify the stress distribution amongst individual wires, and fatigue testing of corroded and uncorroded single prestressing wires. The analytical program quantifies the material fatigue properties and analytically calculates the force distribution within a 7-wire prestressing strand to confirm experimental findings. Finally strain based fracture mechanics is used to model the fatigue life of pretensioned concrete members exposed to different corrosion levels, and to predict the life extension after CFRP repair.
1.1 Research objectives
This research aimed to investigate the monotonic and fatigue flexural behaviour of corroded pretensioned beams and their repair using CFRP sheets. Specific objectives of this study are as follows:
Experimentally quantify the effects of corrosion on pretensioned concrete beams under monotonic and fatigue cyclic loading through a series of monotonic and fatigue tests on pretensioned beams
Experimentally identify the material fatigue properties of 7-wire prestressing strands through a comprehensive material testing program comprised of non-corroded and corroded single wire specimens tested under fatigue cyclic loading.
Experimentally investigate the viability of CFRP repair of corroded pretensioned beams to restore their monotonic and fatigue capacity by testing corroded then repaired pretensioned beams.
Experimentally quantify the mean stress effect on the fatigue response of prestressing strands.
Derive the closure-free fatigue crack growth rate curve from the effective stress data based on constant amplitude fatigue test results of smooth wire specimens.
Model the fatigue life of smooth wire specimens in air, corroded wire specimens in air, and prestressing strands in air.
Model the fatigue life of non-corroded and corroded pretensioned concrete beams.
Model the fatigue life extension of corroded pretensioned beams due to CFRP repair.
1.2 Research methodology
The research objectives are achieved through an extensive experimental program, which is divided in to a material testing and beam testing components that were designed with specific sub-objectives. Following the experimental program an in depth analytical program is explains the failure mechanisms of the 7-wire prestressing strand and provides a modelling approach that reasonably replicates that fatigue behaviour of non-corroded and corroded pretensioned beams.
1.3 Thesis organization
Chapter 2 presents an in-depth background and literature review of related topics and research studies. Chapter 3 presents the experimental program and details the experimental setups, variables and procedures. Experimental results are presented in Chapter 4, while Chapter 5 presents a detailed analysis of the experimental results, describing the modelling approach, and
the modelling results. Finally, Chapter 6 offers a closing summary, conclusions, and recommendations.
Chapter 2
Background and Literature Review
In this Chapter an in-depth background in relevant topics and a comprehensive literature review are presented.
2.1 Corrosion of Steel Reinforcement
Corrosion is a destructive deterioration mechanism that gradually attacks metals. When in contact with the environment (oxygen), metals undergo an electrochemical oxidation resulting in the formation of rust products (Jones 1996). Corrosion requires the presence of an anode and a cathode within a common electrolyte to produce an electrochemical reaction similar to that of a galvanic cell. Typically the rust products are oxides of the metal. In essence corrosion returns the metal to its original state from which it was extracted (Masoud 2002).
2.1.1Corrosion mechanism
Reinforced concrete structures if designed and constructed in accordance with the best practices should be protected against the corrosion reaction. “This is counter intuitive because we know that concrete is a porous material and it contains moisture, so why should steel not corrode?” (Broomfield 2007). Reinforcing steel is protected by a passive film, which remains intact as long as the surrounding concrete maintains its alkalinity, a pH above 12.5. This passive film is a thin layer of iron oxide that significantly slows down the corrosion process by limiting the further access of oxygen to the steel. There are two ways for this protective passive film to be destroyed: carbonation of concrete or chloride penetration into the concrete. Once the passive film has been
broken, the aqueous concrete medium acts as the electrolyte, whilst the reinforcing steel will act as the electrode and corrosion continues.
Carbonation initiated corrosion
In the presence of moisture, carbon dioxide will react with calcium hydroxide after penetrating the concrete to produce calcium carbonate. Calcium carbonate reduces the concrete pH to about 8.5, which in turn destabilizes the passive protection film (Roberts 1981). Carbonation can be affected by multiple factors; a thin concrete cover, porosity, and cracking. The most aggressive environment for attacking the passive film would be the alteration between wetting and drying cycles and high temperature, with an ambient relative humidity of 60% (Tuutti 1977; ACI 222R-01 2222R-010; Beeby 1983).
Chloride initiated corrosion
Sources for chlorides in concrete can be de-icing salts, a marine environment, contaminants, a concrete admixture, or even industrial brine. The above mentioned chloride sources make the presence of chloride ions the dominant corrosion initiation mechanism (ACI 222R-01 2010). Chlorides can be introduced in concrete either during the mixing stage by error or by chloride containing admixtures, or they can be introduced after curing by diffusion. The diffusion rate varies based on a number of factors such as the cement type, the temperature, and the age of concrete (Mehta 1980; Page et al. 1986; Goto and Roy 1981a; Goto and Roy 1981b; Schonlin and Hilsdorf 1988). When chlorides are introduced in concrete they may affect the corrosion process in multiple ways. Chlorides can reduce the resistivity of concrete and increase the rate of additional chloride ingress (Young 1988), increased conductivity of concrete thus accelerating
introduced during the mixing stage can increase the corrosion rates in the plastic stages of the concrete (ACI 222R-01 2010).
Regardless of whether chlorides were added or penetrated the concrete, there is a threshold under which corrosion will not initiate. This threshold depends on several factors, some of which are contradictory. For instance a higher concrete pH means a higher level of chloride resistivity of the steel, but also means a higher chloride concentration (Stratfull et al. 1974; Clear 1974). It has been shown that the initiation of chloride corrosion depends on the chloride to hydroxide ion ratio (Cl-/OH-). Threshold values for this ratio are 0.3 at pH 13.3 (Evans 1961; Hansson and Sorensen 1990), and 0.29 at pH 12.6 (Page et al. 1986; Structures 1992).
2.1.2Types of corrosion cells
There are two common corrosion mechanisms in steel; micro-cell and macro-cell corrosion, shown in Figure 2-1. Microcell corrosion refers to a corrosion process on a microscopic level. The cathode and anode exist on the same reinforcing bar. On the other hand, macro-cell corrosion indicates a separation of the anodic and cathodic sites. This occurs during a chloride attack which is associated with a high moisture content that creates a low electrical resistance allowing the anode and cathode to be further apart (Jones 1996).
Figure 2-1 – Schematic of (a) micro-cell versus (b) macro-cell corrosion (Poursaee and Hansson 2009)
2.1.3Corrosion reactions
Whether corrosion occurs due to chlorides or carbonation does not change the chemical reaction. As steel starts corroding it dissolves in water and releases two electrons. This is referred to as the anodic reaction, Equation (2-1). In order to preserve electrical neutrality, these electrons are consumed by the cathodic reaction, Equation (2-2). The cathodic reaction releases hydroxide ions, which increase the alkalinity, and thus preventing corrosion at the cathode.
(2-1)
(2-2)
The hydroxide ions then migrate towards the anode through the electrolyte (moisture in the concrete). At the anodic site, the hydroxide ions react with the ferrous ions resulting in ferrous hydroxide, which then reacts with oxygen and water to form ferric hydroxide, and then finally
(2-3)
(2-4)
(2-5) The rust product can occupy up to six times the original volume of iron (Fe), Figure 2-2 (Mansfeld et al. 1982). The forms of the rust products depend on the amount of dissolved oxygen in the surrounding environment (Phillips 1993). In an oxygen deprived environment such as the submerged portion of a marine structure, a black/greenish rust product (Fe3O4) is observed (Bentur 1997).
Figure 2-2 – Volume comparison of oxide of iron (Mansfeld et al. 1982)
2.1.4Laboratory accelerated corrosion techniques
Reinforced concrete members in their natural environment corrode at very low rates ranging between 10 to 15 A/cm2. In the laboratory, researchers have used two methods to simulate
Fe FeO Fe3O4 Fe2O3 Fe(OH)2 Fe(OH)3 Fe(OH)3.3H2O 0 1 2 3 4 5 6
Artificial climate environment for accelerating corrosion
In this method the corrosion process is accelerated by creating an artificially aggressive environment of high temperature, high humidity, repeated wetting and drying cycles, or wetting by spraying a salt solution (Yuan et al. 2007).
Galvanostatic method of accelerating corrosion
In this method an impressed current is introduced in the reinforcing steel while the member is exposed to salt. Impressed current densities reported in the literature have ranged from 25 up to 10400 A/cm2 (Andrade, C. 1993). An upper limit of 200 A/cm2 is recommended as higher current densities have a damaging influence on the steel/concrete interfacial bond and affect the corrosion cracking (El Maaddawy and Soudki 2003). The estimated time to achieve the required corrosion mass loss in the steel bar is calculated using Faraday’s law presented by Equation (2-6) (ACI 222R-01 2010).
(2-6)
Where, t = the corrosion time (sec) M = the mass loss of steel rebar
a = the atomic weight of steel (for Fe = 56 g) i = the impressed current density
z = the ionic charge (+2 for steel)
F = Faraday’s constant (96,500 amp-sec) = the metal density (7.86 g/cm3 for Fe)
2.2 Prestressed Concrete
The prestressing concept is based on the application of an axial compression force, which creates a moment that counter acts tensile flexural stresses due to service loads. This in turn controls deflection and reduces or even eliminates cracking under service loads. The prestressing force is applied by an externally stressed high strength steel wires, strands, or bars, the force is then transferred to the concrete member by means of end anchorages or bond to the surrounding concrete.
2.2.1Methods of Prestressing Concrete
There are two method of introducing a prestressing force to a concrete member: post-tensioning, which is used for onsite applications, and pre-tensioning which is used in precast plants.
Post-tensioning - Post-tensioning can be achieved by running prestressing strands (tendons) through hollow ducts prior to casting the concrete. The ducts are laid with a specific profile within a member based on the required design. After the concrete is poured the strands are stressed against the concrete by a hydraulic jack to a pre-calculated stress. The force is transferred to the concrete by anchors at the end of the strands, Figure 2-3(a). This allows post-tensioned strands to be either bonded or unbonded. If bonded, the void within the ducts is filled with grout after the strand has been stressed.
Pre-tensioning - Pre-tensioned concrete generally applies to members prefabricated in a precast plant operation. The strands are prestressed before the concrete is poured. The strands are stressed and anchored at bulkheads outside of the member’s formwork. Once stressed the force is maintained by the stressing bulkhead while the concrete is poured into the formwork. After the
concrete reaches the designed strength for release the strands are cut and the force is transferred to the concrete by bond and a mechanical interlock between the strand and concrete, Figure 2-3(b).
(a) Post-tensioning setup for prestressed concrete
(b) Post-tensioning setup for prestressed concrete
Figure 2-3 – Prestressed concrete schematic: (a) post-tensioning, and (b) pre-tensioning Concrete girder Prestressing strand Hydraulic jack Stressing bulkhead Stressing bed Concrete girder Prestressing strand Hydraulic jack
2.3 Fatigue of Reinforced Concrete Structures
Many reinforced concrete structures undergo dynamic loads. Structures such as bridges are subjected to cyclic traffic loading. Typically such structures are expected to survive 7108 loading cycles during their service life (Tilly 1979). Fatigue is a form of dynamic loading consisting of repetitive loading cycles that may lead to failure (ACI 215R-74 1974). The number of load cycles to failure (fatigue life) is influenced by a number of factors, such as the stress range, the loading rate, and the mean stress (Bannantine 1990). In general, most materials exhibit a lower strength under fatigue loading than under monotonic loading. To understand the overall fatigue response of a reinforced structure, it is important to understand the fatigue behaviour of each of its components.
2.3.1Fatigue of plain concrete
The fatigue strength of plain concrete is considered to be the fraction of its ultimate monotonic capacity that it can withstand under repeated load cycles (ACI 215R-74 1974). When subjected to cyclic loading, concrete will exhibit excessive cracks and eventually fail, this may occur even if the applied load is lower than the monotonic load capacity. In addition concrete will show softening behaviour similar to that under monotonic loading (Neville 1996). The applied stress range (maximum-minimum applied stress) is the primary variable causing fatigue of concrete. Other factors such as the water/cement ratio, the type of aggregates, and the concrete age have been found to affect the fatigue life in the same way as they affect the concrete strength. For a maximum stress level lower than 75% of the monotonic capacity, a variation in fatigue loading frequency between 1-15 Hz has little to no effect on the fatigue life of concrete (ACI 215R-74
A fatigue S-N curve (stress range versus the number of cycles to failure) for plain concrete beams is shown in Figure 2-4. The beams were loaded at 7.5 Hz. The figure shows the ratio of computed flexural tensile stress (Smax) to the rupture stress (fr) on the vertical axis, and the number of cycles to failure on a logarithmic scale on the horizontal axis. The figure shows that the fatigue strength decreases with an increasing number of cycles. Also, the S-N curves are linear between 102 to 107 cycles which means that a stress limit under which concrete life is considered infinite does not exist in this life range, and it is evident that as the stress range decreases the fatigue life increases (ACI 215R-74 1974).
A modified Goodman diagram is used to predict the fatigue strength of plain concrete load in compression, Figure 2-5. This diagram presents the relationship between the stress range and the minimum applied stress in a constant amplitude compressive loading test, and the fatigue life (presented as the number of cycles). Using Figure 2-5 for a given minimum applied stress and a desired fatigue life the allowable maximum applied stress can be determined.
Figure 2-4 – Fatigue strength of plain concrete beams (Mordock 1965)
2.3.2Fatigue of steel deformed bars
The S-N curves for reinforcing steel display a transition from a steep to a more flat response at around the one millionth loading cycle, Figure 2-6. This indicates that unlike plain concrete a reinforcing steel bar exhibits a practical fatigue limit stress (ACI 215R-74 1974). Figure 2-7 shows a typical failure surface of a deformed 35M steel bar (35.7mm diameter). The smooth surface is the fatigue crack surface, while the rugged surface is the fracture surface (fracture occurs after the fatigue crack has reduced the bar strength significantly). In deformed steel bars, the deformations act as stress raisers, which is why the fatigue crack in Figure 2-7 initiated at the stress raiser at the bottom of the deformation (ACI 215R-74 1974).
Figure 2-7 – Fracture surface of 35M (35.7 mm diameter) deformed steel bar (ACI 215R-74 1974) Previous studies in the literature to determine whether the fatigue behaviour of steel bars tested in air resembles that of bars tested within a concrete beam are contradictory (ACI 215R-74 1974). Some studies indicate higher fatigue strength for steel embedded in concrete versus steel tested in air, while other studies report otherwise (Rehm 1967). MacGregor et al. (1971) reported that as long as the geometry of the lugs is sufficient to provide proper bond, very little difference in fracture behaviour should exist. Physical characteristics of deformed steel bars that affect the fatigue strength include: the bar diameter, the geometry of the lugs, bent bars, and the yield strength with stress concentration factors varying between 1.5 and 2.0 (ACI 215R-74 1974).
Bar diameter
It was reported that the fatigue strength of steel bars decreases as the bar diameter increases. MacGregor et al. (1971) tested bars in air in tension, while (Wascheidt 1965; Kokubu and
#5 bars (16mm nominal diameter) exhibited an 8% higher fatigue life than #8 bars (25.4mm nominal diameter)). One theory to explain the higher fatigue strength for smaller diameter bars is that the notch root at the lugs in the larger diameter bars exhibits a higher stress raiser than that found at the notch root in the lugs in the smaller bars.
Bar Deformation geometry
Deformed steel bars rely on their lugs to provide the mechanical bond with concrete; however, those lugs are also the source of the stress concentrations where fatigue fracture initiates (Burton and Hognestad 1967; Pfister and Hognestad 1964). Differences in the rolling and cutting techniques during fabrication of deformed bars lead to variations in the deformation geometry of the bars. (Derecho and Munse 1966) found in their analytical study that the variations in the geometry can significantly influence the fatigue strength by affecting the magnitude of the stress concentration factor. The stress concentration factor varies from 1.5 to 2.0 (ACI 215R-74 1974). It was reported that when the base radius of the deformation is increased from 0.1 to 1-2 times the deformation height, the fatigue strength significantly increases (MacGregor et al. 1971; Helgason et al. 1976; Kokubu and Okamura 1965; Hanson et al. 1968). However, if the base radius of the lugs on the bar is increased beyond 5 times the height of the deformation bond capacity can deteriorate (Kokubu and Okamura 1965).
Yield Strength and bending effect
The yield strength of deformed steel bars has little effect on the fatigue strength (MacGregor et al. 1971; Pfister and Hognestad 1964; Lash 1969). On the other hand, it was shown that bent bars with a 45 degrees bend angle could exhibit 29-50% less fatigue strength than straight bars,(Rehm
2.4 Fatigue of Prestressed Concrete Structures
A properly designed prestressed member will remain uncracked under service loads, and as such the fatigue response of prestressing strand/wire is unlikely to be critical (Bondy 1970). As a result, the fatigue behaviour of steel in prestressed concrete has not been a major issue in design guides and specifications. However, with more prestressed structures subjected to repetitive loading and a higher probability of over loading, there is a growing concern regarding the fatigue behaviour of prestressed members, especially with partially prestressed members (ACI 215R-74 1974; ACI 318-14). This concern is reflected in recent recommendations by ACI, ASCE, and PCI for unbonded construction that requires a prestressing steel and anchorage assembly to withstand a minimum of 500,000 cycles of a varying stress range from 60% to 66% of the specified ultimate strength of the assembly (ACI 318-14; ACI-ASCE 423-05).
2.4.1Fatigue of prestressing reinforcements
Prestressing steel reinforcement can take the form of wires, strands or bars, each of which undergo different manufacturing and treatment processes, which greatly affect their fatigue strength.
Wires
Prestressing wires are usually made from drawn steel and have strengths ranging between 1720 and 1930 MPa (250 and 280 ksi). Drawing has multiple benefits: it increases the tensile strength of wires, produces a grain structure which inhibits crack nucleation and provides a smooth surface that reduces stress concentrations due to surface irregularities (ACI 215R-74 1974). Properties of wires can vary based on the manufacturing process. A study carried out on different
wires from Germany, Czechoslovakia, Belgium,and Japan showed that the fatigue strength of wire was a 30 ksi (207 MPa) stress range at a fatigue life of 4 million cycles. Testing wires of different diameters showed that their fatigue characteristics are within 5% of each other, and that similar to normal deformed steel bars the fatigue characteristics depend on the geometry of their ribs. Wires with ribs of 0.3 mm height and 45 degrees in slope and no base radius had a theoretical stress concentration factor of 2.0, and exhibited a 57% reduction in fatigue strength (Baus and Brenneisen 1968).
Strands
Similar to wires, strands are made out of drawn steel. Strands are comprised of 6 wires wrapped helically around a centre wire (often referred to as the king wire), Figure 2-8. Tests conducted on 11.1mm and 12.7mm 7-wire strands revealed a decrease in fatigue strength with increase in diameter (ACI 215R-74 1974). Figure 2-9 is a modified Goodman diagram that predicts the minimum or maximum allowable stress levels to achieve a desired number of cycles with a specific survival probability (Hilmes 1965).
Figure 2-8 – 7-wire prestressing strand
Paulson el at (1983) conducted an in-depth literature review and an investigation on the fatigue performance of steel prestressing strand as an isolated element as part of a research project sponsored by the Federal Highway Administration (FHWA) and the Department of Highways and Public Transportation of the State of Texas. Part of their investigation was compiling a database of available prestressing strand fatigue testing. They compiled close to 700 fatigue test results from various researchers including their own test results. They analyzed the compiled database and used a regression analysis to develop a lower bound design expression for the 95th percentile of 97.5% probability of no failure, Equation (2-7). The authors state that a stress range of 138MPa (20ksi) is a reasonable fatigue limit, and emphasized that their equation is only applicable to strands as isolated elements. Figure 2-10 shows the complied experimental data the statistical design model as presented by Paulson et al. (1983).
(2-7)
Where, Sr Stress range (ksi)
N Number of cycles
Paulson et al. (1983) also noted that the fatigue behaviour of the prestressing strand varied from one manufacturer to another, and between strands from the same manufacturer. In addition, they observed that the fatigue resistance decreased with increased specimen length, which they attributed to the increased likelihood of flaws being present with a longer length.
Figure 2-10 – Complied fatigue test results for prestressing strand as an isolated element, the statistical design expression of 95% of no failure, Paulson et al. (1983)
Bars
Tests on bars ranging between 25 and 35 mm in diameter have shown that the fatigue limits of these bars are in excess of 0.1 times the tensile strength of the bar for 1 x 10⁶ cycles of loading with a minimum stress of 0.6 times the tensile strength (ACI 215R-74 1974).
2.4.2Fretting fatigue of prestressing strands
Fretting fatigue occurs when two elements in contact under an applied lateral force exhibit relative movement in terms of slip or rotation under cyclic fatigue loading. This relative movement results in surface damage such as abrasive wear and corrosion. Surface abrasion
elements may fuse together (cold welding) at areas of local pressure exceeding the elastic limits. Furthermore, under cyclic displacement the adhesion formed between the two elements would break and another one would form; this cyclic behaviour eventually results in crack initiation, Waterhouse (1982), Wollmann et al. (1996).
Fretting fatigue of metals is a well-known phenomenon and has been extensively investigated. For prestressed concrete elements research efforts in the literature appears to have been focused on fretting in post-tensioned members due to obvious rubbing/abrasion between the prestressing strand and the strand duct, Ryals et al. (1992).
Wollmann et al. (1996) conducted an experimental investigation on fretting fatigue of post-tensioned concrete beams. The experimental program consisted of beam and strand fatigue testing. They concluded that fretting between the strand and the duct, and between the individual strands, reduced the fatigue resistance of bonded post-tensioned beams. Moreover, they compared their strand fatigue test results to the Paulson et al. (1983) model, and stated that although the strand tests were in good agreement with the Paulson model, strand-in-air data are not adequate to evaluate the allowable stress range in post-tensioned beams. They also observed that fretting between the strand and the metal duct was the predominant fretting mechanism, and recommended the use of plastic ducts and epoxy-coated strands. Figure 2-11 presents the fatigue test results for post-tensioned beams with strand in metal ducts and the strand-in-air fatigue failure zone.
Figure 2-11 – Stress range vs. fatigue life for post-tensioned beams with strands in metal ducts (Wollmann, 1996)
Little attention has been given to fretting fatigue in pretensioned members, however, steel strands with a similar formation to concrete prestressing strands are widely used in other applications; electro-mechanical cables, anchors/tethers for deep water platforms, and cable/stayed bridges to name a few. A significant amount to studies was carried out on the fatigue of strand ropes as early as the 1970s. Although the strand rope geometry and mechanical behaviour is similar to concrete prestressing strands the metallurgy, the size of the wires and the number of layers are different which have an impact on the fatigue resistance.
For multilayered strands there are two types fretting mechanisms; longitudinal fretting and rotational fretting. Longitudinal fretting occurs between two adjacent wires with the same
lay/helix angle (inter-wire), while rotational fretting occurs at locations where two wires in different layers with opposite lay/helix angles cross each other (inter-layer). For concrete prestressing with 7-wire strands, longitudinal fretting is of concern since there is only one layer of helically wrapped wires.
Bahke (1980) reported a study conducted by Pantucek (1977) in which fatigue tests were conducted on wire ropes under combined pulsating tensile stresses and transverse pressure. The transverse pressure was increased from 600 to 3600 N. As the magnitude of the transverse pressure increased the detrimental impact on the fatigue life increased. Pantucek inspected the fracture surface under a microscope and found that cracks typically initiated at the edge of the elliptical pressure mark where high plastic deformations occurred, See Figure 2-12.
Blakeborough and Cullimore (1984) conducted a study on the fretting effects on the fatigue of 5 mm diameter galvanized bridge-wires. They used fretting rigs to simulate the fretting of galvanized steel wires due inter-wire contact in ropes, and found that longitudinal fretting causes a significant reduction in the fatigue resistance with an increasing deterioration effect beyond 1.5x10⁵ cycles, see Figure 2-13. They noted that the fretting scar had an elliptical shape and stated that as the impact is localized to the fretting area, the shape of the fretted body is of secondary importance.
Figure 2-13 – Load range vs. fatigue life curves for non-fretted and fretted wire specimens (Cullimore, 1979)
2.4.3Fatigue of pretensioned beams
Overman et al. (1984) conducted an investigation on the fatigue behaviour of pretensioned concrete girders. The investigation was a continuation of the research project of Paulson et al. (1983). The investigation comprised of testing eleven (11) pretensioned girders, and compared their behaviour to previous experimental results in the literature. In addition, they gave design recommendation with an emphasis on predicting their fatigue behaviour based on the fatigue behaviour of the prestressing strand. The authors cited six (6) flexure fatigue studies on pretensioned girders that reported the strand stress range or gave sufficient information to calculate it, with a total of 47 data points. They then used a linear regression analysis with the least squares method to construct the mean regression line and compared it to that by Paulson et at (1983), see Figure 2-14. The solid data points represents girders tested under a single point load, which in general had longer fatigue lives in comparison to the remaining girders tested under four-point bending (having a constant moment zone). Overman et al. note that for stress ranges below 180 MPa (26 ksi) beams exhibit shorter fatigue lives in comparison to strand-in-air lives.
Moreover, Overman et al. (1984) conducted a regression analysis on what they referred to only as large-scale beam tests, namely by Ozel (1962) and Rabbat et al. (1978), and compared the mean regression line to Paulson et al. model, see Figure 2-15. They commented that the regression lines are approximately parallel and that this type to behaviour is to be expected from a constant stress increase due to flexure cracking.
Figure 2-14 – Comparison of the mean regression line of pretensioned beam fatigue test results to Paulson et al. (1983) lower bound strand-in-air model, Overman et al. (1984)
Figure 2-15 – Comparison of the mean regression line of large scale pretensioned beam fatigue tests to the Paulson et al. (1983) lower bound strand-in-air model, Overman et al. (1984)
Finally, Overman et al. (1984) tested eleven (11) large-scale beams measuring 14.65 m (48 ft) in length; four (4) beams with straight strands, four beams (4) with draped strands, and three (3) beams with supplementary crack control non-prestressed reinforcements. They compared their fatigue test results to Paulson et al. model, see Figure 2-16, and made the following notable conclusions:
The Paulson et al. (1983) strand-in-air model can be used to predict the fatigue life of pretensioned concrete beams, with the modification that no endurance limit can be set. However, they state that a stress range below 34.5 Mpa (5 ksi) would be insignificant.
Conservative minimum prestress forces should be used in predicted the beams fatigue life as the prestress losses have a direct influence on the strand stress range.
The strand stress in a cracked concrete section can be calculated using an approximate manual cracked section analysis.
Premature failures could not be correlated to draping of the prestressing strand.
A small number of overload cycles of the order of 20 % above the applied load level can be detrimental and sharply decrease the fatigue life.
Figure 2-16 – Large-scale pretensioned beams fatigue test results in comparison to Paulson et al. (1983) lower bound strand-in-air model, Overman et al. (1984)
Naaman, A. E. (1989) conducted an experimental study that was comprised of testing a total of 38 partially and fully prestressed concrete beams. Twenty-four (24) pre-cracked prestressed concrete beams with rectangular sections were tested; twelve (12) beams were tested under monotonic loading and twelve (12) beams were tested under constant amplitude cyclic loading ranging between 40% and 60% of the monotonic beam capacity. Also fourteen (14) partially prestressed T-beams were tested under monotonic and variable amplitude cyclic loading. The beams tested under variable amplitude loading had a minimum load of 40 % of the monotonic beam capacity.
Three (3) of the rectangular fully prestressed beams failed in less than 2 million cycles and the remaining beams after surviving 5 million cycles were tested monotonically to failure. Naaman reported a correlation between an increase in the strand’s stress level and the observed crack width. The beams failed in less than 2 million cycles had a crack width of 0.15 mm while the beams that survived to 5 million cycles had a crack width of 0.08 mm
Of the T-beams tested under variable amplitude cyclic loading four (4) beams failed in less than 2 million cycles. He reported that these beams had a measured crack width of more than 0.15 mm and exhibited variability in the measured stress levels between the strands and between the wires of the same strand. However, the average measured wire stress was in agreement with his analytically calculated stress. Failure of the partially prestressed beams was by fracture of the reinforcing steel or the prestressing strand.
Naaman suggested that in addition to the applied stress range, several parameters can significantly deteriorate the fatigue resistance; such as stress concentrations at anchoring
locations, fretting between adjacent wires or between the prestressing strand and the concrete. Finally he stated that the fatigue life of prestressing strands under minimal fretting conditions could be predicted by Equation (2-8) for stress ranges above 70MPa.
(2-8)
Where, S The stress range
fpu The ultimate strand tensile capacity
N Number to load cycles
2.5 Corrosion of Prestressed Concrete Structures
Prestressing steels are highly susceptible to corrosion attack due to the metallurgy associated with their high strength and the high stresses due to prestressing. This corrosion can significantly reduce the service life of prestressed concrete structures. Multiple factors contribute to the severity of corrosion in prestressing steels. This section presents the primary factors contributing to the corrosion of prestressing steel, and the impact of corrosion on prestressed structures.
2.5.1Fracture modes of prestressing reinforcement due corrosion and cyclic loading
Depending on the loading condition, steel properties, and corrosion environment different fracture modes can occur in prestressing steel reinforcement (Nurnberger 2002; Ngoc et al. 2009):
Brittle fracture.
Stress corrosion cracking induced fracture. Fracture due to fatigue and corrosion influences.
Brittle fracture
Brittle failure may occur when a tensile stress is applied to high strength steels. Whether the fracture is brittle or not is influenced by general and local corrosion. In the case of general corrosion due to normal weathering, if a significant loss of cross section occurs, the residual load capacity of the high strength steel can be exceeded thus causing failure. On the other hand, if the local corrosion attack is characterized by deep pitting, the load bearing capacity can be severely affected at an early age of the structure. The latter case is more of a concern for post-tensioned
ducts. Figure 2-17 shows the effect of pitting depth on the fatigue life of 5 mm cold deformed prestressing steel wire.
Figure 2-17 – Fatigue properties of 5mm cold deformed prestressing steel in relation to the depth of local corrosion (Nurnberger 2002)
Stress corrosion cracking (SCC) induced fracture
Stress corrosion cracking (SCC) is defined as the initiation and propagation of a crack within a material in the presence of a corrosive medium (Nurnberger 2002). This is can be either Anodic or hydrogen induced stress corrosion cracking (H-SCC). Anodic stress corrosion cracking occurs in the presence of a non-alkaline nitrate contaminate electrolyte, especially in low-carbon reinforcement. However, currently used prestressing steels are highly resistant to it.
Hydrogen induced stress corrosion cracking (H-SCC) occurs as hydrogen atoms are set free and are absorbed by the prestressing steel during the corrosion process. Coupled with the high mechanical tensile stresses due to prestressing, it can cause pre-cracks along grain boundaries. This requires the presence of hydrogen and an acidic aqueous media, which is a common attacking medium for concrete. As corrosion occurs the pH within the pit drops due to hydrolysis of the Fe2+ ions, creating the required acidic environment for crack initiation. The latter case is referred to as pitting induced hydrogen induced stress corrosion cracking.
Alonso et al. (1993) investigated the susceptibility of prestressing steel to stress corrosion cracking in a Sodium bicarbonate (NaHCO3) solution. They conducted electrochemical and slow strain rate tests on cold drawn prestressing steel rod with a tensile strength of 1650 MPa. The rods were machined down to 2.5 mm diameter and 25 mm in length. The main variables of the study were the concentration of NaHCO3, the aeration methods (air, Nitrogen or none), and the strain rate. They concluded that the prestressing steel tested was susceptible to stress corrosion cracking in NaHCO3 with the greatest susceptibility being at a critical concentration of 0.1M of NaHCO3. They also found that the susceptibility to cracking was affected by the solution’s pH, and that a solution alkalinity with a pH of about 9.7 is required for cracking to occur.
Toribio and Ovejero (2005) studied the impact of the level of cold drawing of prestressing steel wires on their susceptibility to stress corrosion in the case of pure stress corrosion cracking (localized anodic dissolution, LAD) as well as fracture by hydrogen embrittlement (hydrogen assisted cracking, HAC).