Detecting and Quantifying Insider Trading and Stocks Manipulation in Asia1* Gishan Dissanaike
University of Cambridge
Judge Business School, Trumpington Street, Cambridge CB2 1AG, UK
g.dissanaike@jbs.cam.ac.uk
Kim-Hwa Lim
University of Cambridge
Judge Business School, Trumpington Street, Cambridge CB2 1AG, UK Penang Institute
10 Brown Road, 10350 Penang, Malaysia
kh.lim@jbs.cam.ac.uk, limkimhwa@penanginstitute.org
Abstract
This paper focuses on insider trading where the perpetrators exploit market sensitive information to earn profits or avoid losses. The paper’s objectives are: First, we seek to examine whether we can detect possible insider trading and stock manipulation and react in almost real time manner, even though it is intended to be evasive. Second we also estimate the extent of illicit profits (or loss avoidance) that might have been earned. Finally, we analyze if detection is possible, the appropriate response for regulators and other market participants. We do not restrict our study to cases where corporate events have materialized, as we hope to capture insider trading surrounding market rumours and failed corporate events. However, since insider trading is executed with the aim to be evasive and not to be detected, it is impossible to conclude with certainty. However, using a hypothesized model based on how insiders and stock manipulators trade, we detect price patterns that are consistent with their objective to maximize profits and at the same time to be evasive.
Key words: corporate governance, insider trading
1. Introduction
“Greed, for lack of a better word, is good”
Gordon Gekko, the main antagonist of the 1987 film Wall Street
The film mentioned above revolves around insider trading and securities manipulation with Gordon Gekko modelled loosely after Ivan Boesky and Michael Milken. In real life, Boesky and Milken were respectively fined US $100m (about US $200m in today’s prices) in 1986 and US $600m (around US $1bn today) in 1990. The magnitude of their fines indicate the amount of money involved in insider trading and securities manipulation. Greed and the lure of big money have continued since, with recent cases of insider trading and securities fraud in the United States such as Raj Rajaratnam in 2011, Angelo Mozilo in 2009 and Martha
Stewart in 2004.
We take the mainstream view that insider trading is detrimental to the resource allocation mechanism of the market, unjust and distorts the integrity of the market. Most of the studies in the literature focus on legal insider trading where corporate insiders (directors, company executives) trade their own stocks and such trades are reported to the market2.
However, the type of insider trading undertaken by Gordon Gekko and company are illegal and are meant to manipulate stock prices for personal gain. Our paper focuses on the Gordon Gekko’s types of insider trading and stock manipulation. The few studies in the area of illegal
2 Some examples of existing literature include legal insider trading relationship with subsequent stock returns
(Lakonishok et al. 2001), accounting restatements (Badertscher, Hribar, and Jenkins 2011), earnings management (Ke, Huddart, and Petroni 2003), mispricing (Ali, Wei, and Zhou 2011), news announcements (Korczak, Korczak, and Lasfer 2010) or the effect of Sarbanes-Oxley Act (Brochet 2010).
insider trading tend to focus on specific corporate events, usually mergers and acquisitions (M&A)3. We do not limit our study to cases of corporate events (M&A, share repurchases etc.) because this would exclude cases involving corporate events that did not materialize or cases with price sensitive market rumours which are outside the purview of the regulators and they are not reported by mainstream news providers.
Our research endeavour is challenging because illegal insider trades are difficult to detect since they are structured to evade the regulators and other market participants while insiders can be widely dispersed both geographically and in identity due to the prevalence of online trading, the ease in opening such accounts using real, “borrowed” or stolen identities. Moreover, the syndicates are usually close knit groups and difficult to identify and penetrate. There is also difficulty in collecting evidence since the spread of market manipulating
rumours are usually through friends or via unregistered mobile phones, avoiding fixed line phones which are recorded in banks. Lastly, most rumours are not reported in mainstream media or main financial news providers such as Bloomberg and Reuters and hence data collection is difficult.
The aforementioned insider trading cases came to light due to the amount of money involved, extent of evidence collected through wire taps, use of witnesses as part of their plea bargain and the degree of resources devoted by the Securities and Exchange Commission to these cases. Even then, most cases result in out of court settlements, a fine instead of conviction4. To increase the chance of detecting insider trading and stock manipulation, we focus on Asian markets as these markets are similar to the United States markets in that insider trading
3 Bris (2005) studies the insiders’ behaviour before tender offer announcements across many markets between
1990 and 1999. King (2009) analyses insider trading around Canadian takeovers whereas Meulbroek and Hart (1997) focuses on U.S. takeover premia in cases of insider trading.
4
For example, most UK cases are civil actions that encourage defendants to settle without going to trial. The difficulties in onus of proof implies that criminal prosecutions are reserved for the big scandals.
is illegal in all these countries. However, Asian regulators are less likely to pursue enforcement and detection due to lack of resources. There is a lower incentive to reveal insider trading because there are less whistle blower/witness protection regulations5, while culturally, insider trading is much more “acceptable” due to the importance of personally relationships in Asian culture6 and thus, less it is likely to be pursued. Moreover, equities are the easiest and most liquid instrument to express a bullish or bearish view since other
instruments such as options and convertible bonds are not widely traded7. At the same time, the penalty for insider trading is less stiff (e.g. in Japan, the worst penalty a court can hand down under the civil procedure prior to its revision in June 2013 is the offender’s return of trading profits to the shareholders of the listed company). But Asia have become more integrated8 and most Asian investors have a strong home bias. Therefore such behaviour should be more prevalent in Asian markets, which is supported by anecdotal evidence from non-Asian based fund managers that indicate pervasive insider trading and stock
manipulation in Asia.
This paper has three objectives. First we seek to examine whether we can detect possible insider trading and stock manipulation and react in almost real time manner, even though it is intended to evade market participants and regulators? Being able to react close to real time manner is important so that remedial actions can be taken. Second, we aim to estimate the extent of illicit profits that might have been earned. Finally, if detection is possible, we also
5 The environment in the United States is more conducive to whistle blowers to assist in the investigations. For
example, defendants under insider trading cases who agree to cooperate with investigators, pay fines or implement corporate reforms, have charges against them dismissed if they fully comply.
6
For example, Liu, Wang and Zhang (2013) find that Chinese firms with political connections have a greater probability in engaging in M&As.
7 U.S. studies have found that informed insider traders might prefer to use the options market to capitalize on
their private information (Chakravarty, Gulen and Mayhew 2004).
8 Chen and Woo (2010) find that trade and investment integration increased between 1990 and 2000, weakened
analyse the appropriate response of the regulators and other market participants. This paper is significant because it is, to our knowledge, the first attempt to model the behaviour of insider trading and stock manipulation without restricting to corporate events that have materialized, and to empirically answer the three objectives.
Setting the null hypothesis being the market performance, we hypothesize a model using the typical pattern of insider dealing and stock manipulation, whereby stock prices fall regularly as insiders short the stock prior to some negative news (such as secondary equity offering); or stock prices rise constantly without any news as insiders build up long positions and prior to a positive event (e.g. a special dividend, a M&A). Subsequent to the rise or fall, we
hypothesize that the insider will liquidate the position to maximize profits and then, the stock may revert to its long term price. Through such stock price pattern and trading, the insider will be able to front run other market participants, extract illicit profits and outperform the market.
We recognize that it is impossible to detect and conclude that insider trading or stock manipulation has occurred with certainty. However, based on our hypothesized model, we detect a certain price pattern that is consistent with what an insider or stock manipulator may want to achieve. Setting the null hypothesis being the market performance, we test and find that an insider that practices stock manipulation in our hypothesized manner: 1) will
outperform the market; and 2) may earn illicit profits or avoid losses that amount to a mean daily return of 0.61223 percent (before transaction costs) across twelve markets in Asia between 1997 and 2010. This daily return translates to an annualized return of 366 percent per year; and 3) market participants who are alert to possible insider trading can react almost in real time manner – regulators can initiate investigations, investors can capitalize on the
hidden news and price changes while companies can make the necessary market disclosures. Over time, this should reduce the profitability of engaging in insider trading and stocks manipulation.
Our results are robust to market directions, company characteristics such as stock market capitalization and liquidity, trading style and aggressiveness of the investor. The implication of our findings is that regulators need to devote more resources on surveillance and
enforcement and support more research work into this area; investors need to be more alert; and companies should be more careful in handling market sensitive information to avoid information leakage.
This paper is organized as follows: Section 2 presents our hypothesized detection model; Section 3 describes our methodology, data and analyse the results from our hypothesized model; Section 4 reports some robustness tests; and Section 5 concludes with the key
implications for the main market participants – regulators, sophisticated and naïve investors; as well as companies.
2. Hypothesis development
We believe the insider and stock manipulator’s aim is to beat the market and maximize profits. Therefore, we set the null hypothesis to be the market return. To maximize profits, the insider would want to buy in before price rises or when stock price starts to increase; then liquidate the positions almost at the peak before the price falls. This must be achieved subject to a few conditions such as being able to evade the regulators, not to startle the market nor to alert other market participants and not to exhaust their own resources.
We hypothesize that there are four phases to price manipulation and insider trading – see Figure 1 – which if true, would beat the null hypothesis of market performance. To simplify, we describe our hypothesis using the case when prices are manipulated upwards (the reverse is true for downwards manipulation).
========== Figure 1============== 2.1 Stealth phase
At this stage, insiders buy the stock but keep their total positions below the disclosure limit. The increase in position must not result in drastic and obvious price and it has to be safe from attracting the attention of the regulator or other market participants. Therefore, prices are closing higher daily but the closing price must not be significantly higher than its usual past price. The volume traded must also be close to the norm.
2.2 Awareness phase
At the earlier stage, rumours start to circulate due to insiders spreading rumours or increasing market knowledge of inside information. Therefore the volume traded will start to rise above average as alert investors buy in. The gradual increase in prices will soon become more
intense as investors rebalance their portfolios and short positions on the stock are bought back. Towards the end of this phase, there may be parabolic price rise as investors jump onto the bandwagon and the media may report about the rumours and the dramatic price increases.
2.3 Liquidation phase
As rumours become more prevalent and inside information is leaked to a wider audience, the regulators may make enquiries. The company may be forced to issue an official denial of the rumour/s or confirmation of the event. With the new information, whether substantiated or
rumoured, analysts may revise their estimates and investors rebalance their portfolios. The mainstream media starts to report the stock widely and the stock enjoys maximum publicity. The insiders find this an opportune moment to exit for maximum profits since both the volume traded and prices are high.
2.4 Enlightenment phase
Liquidation by insiders needs to be gradual so as not to cause prices to crash. Naïve and other investors that are not part of the insider syndicate will not exit their positions and will hold on to their positions, hoping that the fall in process is a temporary hiatus. This may be due to them being overly hopeful of the company’s prospects, or being blinded by the rumours or over-confident of their ability to re-adjust their perceptions to the new realities. Such behaviour is consistent with cognitive psychology in that individuals base their decision excessively on recent historical data and do not fully acknowledging the uncertainties of the future (Tversky and Kahneman 1992). The media and the company involved may put undue emphasis on the significance of the M&A, or divestment event. However, over time, price and volume traded will start to drift lower and fall towards their long term mean.
3. Methodology, data description and test results
We test our hypothesis against the null hypothesis of market performance. We initiate long or short positions after receiving a trigger and replicate the trade as if we are the insider. If our hypothesis as depicted in Figure 1 is correct, we will then be able to generate positive returns over and above the market, which acts as the control group. To quantify the returns, we will build up $1 in the long or short position, and gradually liquidate the position as if we are insiders with full knowledge of the manipulation. We use
Figure 2 to illustrate the profile of our position. After receiving a bullish trigger on day 0, we commit $0.50 per day on day 1 and day 2 to buy into the stock, resulting in a long position of $1. Then we hold the position for 5 days and gradually liquidate a tenth of the long position over the next 10 days.
===============
Figure 2================
We adopt this method so that once we can react the following day once we detect possible insider trading. The bullish/bearish triggers under the three different phases are computed differently and likewise our position’s profile (entry/held/liquidation days) are different. Since we use price and volume data, our triggers are not conditional to other corporate events. Hence, we will be able to capture market rumours as well as corporate events that have and have not materialized. We will use the case when prices are manipulated upwards to show the trading profile.
Since we want to mimic how the insider trades, our trading direction must be in the same direction as the insider. So if we detect upward price manipulation during the Stealth and Awareness phases when the insider is taking long position, we will also buy the stock but at different speed. As shown in Figure 3, because stealth phase is at the early stage of
manipulation, we can afford to enter into position slowly, hold it longer and liquidate our position gradually (see solid line with asterisks). However, if we only detect upward price manipulation at the awareness phase, we will need to get into position quickly, hold it briefly before clearing off our position (solid line). But if we only manage to detect the upward price manipulation at the liquidation phase when insiders are exiting the long position, we must quickly take a short position and slowly buy back the stock as we have not bought into the stock previously and we hypothesize that prices will fall (see the dashed line in Figure 3).
Thus, depending on when we manage to detect the upward price manipulation, the trading profiles will be different. The opposite position profile will hold for downward price manipulation.
=============Figure 3================
Our testing sample includes all constituents of the major indices from Japan, Australia, South Korea, Taiwan, Singapore, Hong Kong, Malaysia, Thailand, Philippines, Indonesia, China and India9. This amounts to around 2,010 companies. The data spans from 1 January 1997 to 31 August 2010. Opening prices, closing prices, day’s high, day’s low, volume and market capitalization are sourced from Datastream. We filter our dataset to exclude stocks with market capitalization less than US $50m, stocks with average daily volume traded in the past 40 days less than US $0.5m and to exclude stocks with closing prices less than US $0.50. The first filter is to avoid low liquidity and small stocks that can be easily manipulated, while the latter filter avoids low-priced stocks that may suffer from bid-ask bounces.
3.1 Stealth phase
Unless one is part of the insider syndicate, one cannot know a priori which stock will be manipulated. Therefore we expect this phase to be least detectable as the insider will want to build up the long or short position stealthily. Hence in a bullish circumstance, the trade volume, opening, high, low and closing prices for the day are likely to be higher than the mean of the data for the past five days. Although the price return is positive, to avoid being too obvious and alerting others, the insiders must not buy too aggressively. Hence, the mean
9 The indices, following the sequence of the countries above, are respectively: TOPIX 500, S&P/ASX 200,
KOSPI 200, MSCI Taiwan, Singapore Straits Times index, Hang Seng Composite Index, Bursa Malaysia KLCI, Thailand SET 50, Philippines Stock Exchange PSEi (formerly named PSE Composite), Jakarta LQ45,
past five days’ data are still less than the past twenty days’ data. If all these conditions are fulfilled, then it is a bullish trigger. The reverse conditions apply in a bearish case.
The first column in Table 1 reports our detection during the Stealth phase. We find that between 1997 and 2010, there were 60,299 (36,630 bullish and 23,669 bearish) triggers where insiders may be stealthily taking long/short positions amongst the 2,010 companies (about 0.84 percent of the transaction days). Over the period, the mean daily occurrence is across 16.9 companies; while the mean occurrence per stock is 30 times (about twice
annually). Since the Stealth phase is at the beginning of stock manipulation, we can afford to build our position slowly and linearly over ten days, and then hold the position for five days before liquidating linearly over 20 days.
The first column in Table 1 shows that the median daily gross (long plus absolute short) position held is $285.20, with a bias towards being net long (median of $61.05 daily). This is unsurprising as we expect insiders can trade easier on a bullish signal and it is more difficult to manipulate prices downwards because there are short sale restrictions – no naked short selling allowed, short selling must be pre-borrowed, short selling is only allowed for certain stocks and some markets have only allowed short selling during the later period of our analysis. Moreover, Asian markets enjoyed a bull market for a period prior to the 2008-09 global financial crisis.
By trading (entering/holding/liquidating the position) in this manner during the Stealth phase, the first column in Table 1 shows that the mean and median daily returns are 1.790bps and 2.573bps respectively (1bps is a hundredth of a percentage). The daily return is calculated based on the profit for the day divided by the gross position for the day. To test if the triggers
during the Stealth phase will beat our null hypothesis of market performance, we also invest the equivalent gross position in the market index, thereby having a benchmark return from the same level of gross exposure which also acts as our control return.
Figure 4 shows the cumulative profit if we trade using the hypothesized manner by insiders (black line) and the cumulative profit from the market indices (dashed line). We find that although the triggers generated from our hypothesized manner yield small returns (annualized to 4.6% per year), they outperform the market cumulatively over the period.
=============Table 1====================== 3.2 Awareness phase
At this phase, we hypothesize that the price movements have attracted the attention of other participants and they are rebalancing their portfolios accordingly. We expect it to be more detectable as compared to the Stealth phase. In a bullish case, it is detectable with the opening prices being higher than the previous two days’ and previous day’s opening, closing and high prices. Likewise, the high and low prices for the day are also higher than the previous two days’ and the previous day’s high and low prices. The closing price is also higher than the mean past five days’ closing price, with the mean of the previous five days’ closing price also being higher than the mean of the previous twenty days’ closing price. The average return over the past five days is also positive. Such optimism is reflected in the volume being 50 percent more than the mean past twenty and 200 days’ volume. The reverse idea applies in a bearish case.
The second column in Table 1 shows that there were 39,209 (24,430 bullish and 14,779 bearish) triggers during the fourteen years of this study. As we detected this during the Awareness phase, we enter our $1 long or short quickly within a day after receiving the
signal; hold it over five days before liquidating linearly over the next five days. Consistent with our expectation that in the Awareness phase, the triggers are more detectable and albeit lesser number, they are more informative and generate higher mean and median daily return (4.466 bps and 5.907 bps respectively – second column in Table 1). The higher return, annualized to 12 percent per year, is mainly because the triggers initiate positions that latch on to the rapid price change during the Awareness phase as shown in Figure 1. This is also confirmed in Figure 5 where the cumulative profits from our hypothesized insider trading model beat a similar investment in the market indices. Due to fewer triggers, the second column in Table 1 shows that capital requirement is lower with the median daily gross exposure falling to $98.00 and the median daily net long position falling to $25.40 as compared to the Stealth phase.
The triggers in the Awareness phase above were calculated independent to the triggers during the Stealth phase, meaning the triggers do not consider any detection during the Stealth phase. We now calculate the triggers in the Awareness phase to be conditional upon being detected in the Stealth phase as well. Therefore, we would initiate long/short positions during the Awareness phase only if we have also detected suspicious signals in the same direction during the Stealth phase.
The third column in Table 1 shows that being stricter in our analysis generates fewer triggers (4,192 triggers) with lower capital requirement (median daily gross exposure of $9.20). However, the fewer signals are more informative. The mean and median daily return improves to 7.256 bps and 7.946 bps respectively, and outperformed the market (see Figure 6). The significance of this detection is that for an outsider who managed to detect the
suspicious price activity during the Stealth phase and confirmed again by the suspicious signal during the Awareness phase can join in, yielding an annualized return of 20 percent.
Therefore by combining the information collected at the Stealth and Awareness phases, we believe we are detecting cases where the insider has stealthily taken a position ahead of the dissemination of price sensitive rumour or event news, which occurred during the Awareness phase. The third column in Table 1 shows that frequency of such stock manipulation is low – on average 1.2 cases per day. Thus, we believe we are focusing on those cases with higher likelihood of actually being manipulated.
To get an idea of the potential illicit profits being earned and losses being avoided by the insider on these particular cases, we would initiate the long or short positions as if we are the insiders after we have detected the triggers at the Stealth phase. The last column in Table 1 shows that for these 4,192 cases, the mean and median daily return increase significantly to 61.223 bps and 53.797 bps respectively. Assuming that the insider adopts a similar trading profile of entering, holding and liquidating the position like us, this daily return gives an estimate of the illicit profits being earned. A mean daily return of 61.223 bps translates to an annualized return of 366% per year.
3.3 Liquidation phase
We hypothesize that during this phase, the inside information has become common news and the rumours have been confirmed or denied by the company. The insider believes that the prices have reached the highest or lowest and the stock is now traded actively. Therefore, it is an opportune time to exit with maximum profits and minimal price impact.
We detect the end of a bullish case when mean opening, closing, high and low prices for the past forty days are higher than the same previous hundred days’ data, but the mean past five days’ data are lower than the mean past twenty days’ data and the day’s data is also lower than the mean previous five days’ data. Prices have fallen for the day compared to five days ago but remain higher compared to twenty or forty days ago. Therefore this points to the end of the bull run. The lack of further upward price impetus is also backed up by elevated but diminishing trading activity with the mean five days’ volume being less than 150 percent but remain more than 120 percent of the previous 20 days’ volume; and the day’s volume is less than 120 percent of the previous five days’ volume. The reverse idea applies in the end of a bearish case.
The first column of Table 2 shows that there were 4,049 triggers (2,330 bullish and 1,719 bearish), with an average of 1.1 triggers per day and 2 triggers per stock over 14 years. Since insiders are exiting their long positions by selling down, and so we must also sell. Because we only detected the trigger at this point and we do not have a long position, this will result in a short position. Therefore although receiving a bullish signal, we will initiate a short position quickly within a day and gradually buy back the stock over the subsequent forty days.
Trading this way would yield mean and median returns of -2.638 bps and -0.750 bps respectively. Figure 7 shows the cumulative profit and loss. The returns are negative, and match the market initially but underperform the market after 2006. Yielding a negative return on a short position implies that stock prices have continued to rise. However, since it is a small negative return (statistically not significant at 5% – see first column in Table 2), it shows that stock prices are not reverting and are plateauing. Hence, we believe that the insiders are likely to have exited almost at the top/bottom of the price cycle.
Similar to the earlier analysis at the Awareness phase, we also condition our Liquidation phase triggers to be detected at the Awareness phase; and at the Awareness and at the earlier Stealth phase. The second and third columns of Table 2 show that this will result in fewer triggers (1,362 and 435 triggers respectively) and largely similar returns profile (mean of -3.261 bps and -2.714 bps; and statistically not significant). Our results in the first three columns of Table 2 show that our hypothesized triggers are not successful in detecting prices falling after being manipulated upwards, nor prices rising after being manipulated downwards. The results from Table 2 imply that insiders have already creamed off the best returns,
leaving the naïve investors to reap the average 2.638 bps return with a high standard deviation (since the naïve investors would be adopting the opposite trading profile to us. Moreover, there are other participants, who are unaware of the price manipulation or suffer from behavioural biases, taking the opposite side to us. Finally, it also implies that detecting turning points in trend using only price and volume data has limited power.
For sake of completeness, using the same cases, we also estimate the illicit profits as if we know the insider is exiting his position during the Liquidation phase but have entered the position during the Awareness or during the Stealth phases. In an upward price manipulation case, the insiders are building long positions during the Awareness or Stealth phases before exiting during the Liquidation phase. Therefore we mimic this by also building long position at the earlier phases and then exiting at the Liquidation phase. So, we need not take the short position when we only detect a suspicious signal at the Liquidation phase.
Our results in the fourth and fifth columns of Table 2 show that the daily mean/median returns to be 12.112 bps / 11.764 bps and 14.252 bps / 13.499 bps, respectively. These represent the illicit profits when insiders trade in during the Awareness and Stealth phases
respectively and trade out during the Liquidation phase as detected purely using the
conditions at the Liquidation phase. The returns, though lower compared to the fourth column in Table 1, still annualizes to a respectable 35 to 43 percent per year.
In summary, we show in this section, certain price pattern that is consistent with our hypothesis of what an insider or stock manipulator may want to achieve. We show that if a stock manipulator trades in a similar pattern as our hypothesis, he would outperform the market as well as extract illicit profits or avoid losses that may amount to a mean daily return of 0.61223 percent (annualizing to 366 percent per year). For outsiders who managed to detect the suspicious signals at the Stealth and then at the Awareness phase, they can also extract a mean daily return of 0.07256 percent (annualizing to 20 percent per year). Therefore, it is imperative for regulators to be more alert to the possible price manipulations.
4. Robustness tests
We subject our results to robustness tests in this section. We focus on the Stealth and Awareness phases where most of the profits accrue.
4.1 Can our hypothesized model detect such behaviour in large and liquid stocks? A priori, we expect smaller and less liquid stocks to be more easily manipulated. In our main analysis, we excluded small (market capitalization less than US $50m), illiquid (average daily volume in the past 40 days less than US $0.5m) and low priced stocks (closing price less than US $0.50). However, these filters may be insufficient. Therefore we re-ran our analysis to focus only on stocks exceeding US $500m market capitalization and with average daily volume in past 40 days exceeding US $5m.
Our reduced sample yields results similar to our main findings, albeit with fewer instances. Consistent with expectation, the mean and median daily returns are lower than our main results in Table 1. Nevertheless, we find that the insiders may still be able to extract significant profits or avoid losses that average 58.535 bps daily (results not reported). An alert outsider who has spotted suspicious trading patterns in the Stealth and Awareness phases may also be able to enjoy an average 4.867 bps return daily (results not reported).
4.2 Removing the liquidity, size and price filters since the stocks are constituents of the main benchmark in each country
The twelve indices are the flagship/benchmark indices of the respective markets. So to gauge the prevalence of insider trading and stock manipulation throughout Asia and to increase the power of our tests, we do not impose any size and liquidity filters and re-ran our analysis. Unreported results from our enlarged sample indicate findings which are stronger and consistent with our main findings in Table 1.
4.3 How much does the market direction affect our conclusion?
In our main results in Table 1 and Table 2, we notice that the mean net position is positive because there were more long/bullish triggers than short/bearish triggers. This, coupled with the general upward trend of the markets, may skew our returns upwards and give a false impression of the power of our hypothesized model in detecting stock manipulation. We did not neutralize this effect in the main analysis because in most of the markets, there are short sale restrictions and short selling introduces additional costs and risks to the stock
manipulator in a generally upward trending market. Besides, it is also easier to spread
net long exposure is because there are days when only longs or only shorts triggers were detected. In these days, there is no way of neutralizing this effect apart from deleting the triggers. However, deletion will eliminate useful information and reduce the power of our analysis.
Nevertheless, we re-ran our analysis using market neutral positions. We neutralize the net long (or short) position by proportionally reducing all the long (or short) positions for that day by the amount of the net exposure. For example, if on a certain day, the total long and short positions are $100 and $90 respectively, we obtain our market neutral exposure by reducing each long position by 10%. Our additional tests show that our main findings remain robust. Adopting strictly a market neutral position (zero net position) at all times, our
unreported results show that the mean and median daily returns have fallen slightly compared to Table 1. This is expected since the overall markets were trending upwards. However, the main crux of our analysis remains.
4.4 Are the results robust to alternative trading profiles (number of entering, holding and liquidating days)?
We hypothesized that insiders and stock manipulators trade in a certain way and to estimate the amount of illicit profits or loss avoidance, we create our position with our trading profile (days entering the position, holding and liquidating the position). However, this profile is just our conjecture and not all insiders have the same trading style as us. For each column of results reported in Table 1 and Table 2, we undertook eight alternative trading profiles. Our unreported results show that although there are alternative trading profiles that would yield higher returns, our main findings are valid and robust.
5. Conclusion
Our paper focuses on insider trading where perpetrators exploit market sensitive information to earn profits or avoid losses. Our paper seeks to examine the detection of possible insider trading and stock manipulation and react in almost real time manner, even though it is intended to evade market participants and the regulators as well estimate the extent of illicit profits that might have been earned. Finally, we also examine if detection is possible, what should be the response of other market participants?
Setting the null hypothesis being the market return, using a hypothesized model based on how insiders and stock manipulators might trade, we detect price patterns that are consistent with their objective to maximize profits. Using our hypothesized model, we also estimate insiders avoid losses and earn profits with a mean daily return of 0.61223 percent (annualized to 336 percent per year) and that such insider trading outperforms the market.
With the lure of such high returns, insider trading and stock manipulation is likely to continue and market participants have to respond accordingly. Regulators need to devote more
resources and support more research work into this area. Unless one is part of the (illegal) stock manipulation syndicate, investors can only detect this phenomenon at the Awareness phase when prices have been moved by the rumours or news, and from then respond depending on their level of investment sophistication. Finally, companies have to be more careful in the dissemination of market sensitive information even to authorized personnel to avoid information leakage.
References
Ali, Ashiq, Kelsey D. Wei, and Yibin Zhou. 2011. Insider Trading and Option Grant Timing in Response to Fire Sales (and Purchases) of Stocks by Mutual Funds. Journal of Accounting Research 49 (3): 595–632.
Badertscher, Brad A., S. Paul Hribar, and Nicole Thorne Jenkins. 2011. Informed Trading and the Market Reaction to Accounting Restatements. Accounting Review 86 (5): 1519–1547. Bin Ke, Steven Huddart, and Kathy Petroni. 2003. What Insiders Know About Future
Earnings and How They Use It: Evidence from Insider Trades. Journal of Accounting & Economics 35 (3): 315–346.
Bris, Arturo. 2005. Do Insider Trading Laws Work? European Financial Management 11 (3): 267–312.
Brochet, Francois. 2010. Information Content of Insider Trades Before and After the Sarbanes-Oxley Act. Accounting Review 85 (2): 419–446.
Chakravarty, Sugato, Huseyin Gulen, and Stewart Mayhew. 2004. Informed Trading in Stock and Option Markets. Journal of Finance 59 (3): 1235–1257.
Chen, Bo, and Yuen Pau Woo. 2010. Measuring Economic Integration in the Asia-Pacific Region: A Principal Components Approach. Asian Economic Papers 9 (2): 121-143
King, Michael R. 2009. Prebid Run-Ups Ahead of Canadian Takeovers: How Big Is the Problem? Financial Management (Wiley-Blackwell) 38 (4): 699–726.
Korczak, Adriana, Piotr Korczak, and Meziane Lasfer. 2010. To Trade or Not to Trade: The Strategic Trading of Insiders Around News Announcements. Journal of Business Finance & Accounting 37 (3/4): 369–407.
Lakonishok, J, Josef Lakonishok, I Lee, and Inmoo Lee. 2001. Are Insider Trades Informative? Review of Financial Studies 14 (1).
Liu, Ningyue, Liming Wang, and Min Zhang. 2013. Corporate Ownership, Political
Connections and M&A: Empirical Evidence from China Asian Economic Papers 12 (3): 41-57.
Meulbroek, Lisa K., and Carolyn Hart. 1997. The Effect of Illegal Insider Trading on Takeover Premia. European Finance Review 1 (1): 51–80.
Tversky, Amos, and Daniel Kahneman. 1992. Advances in Prospect Theory: Cumulative Representation of Uncertainty. Journal of Risk & Uncertainty 5 (4): 297–323.
Figure 1. Phases to our hypothesized insider trading stock price pattern
Source: Authors’ calculation.
Figure 2. Illustration of a long position profile
Source: Authors’ calculation.
90 100 110 120 130 140 150 1 11 21 31 41 51 61 71 81 91 101 Stealth Awareness Liquidation Enlightenment 0 2 4 6 8 10 12 14 16 18 0 0.1 0.2 0.3 0.4 0.5 0.6 0.7 0.8 0.9 1
Days after detection
P o s it io n ( $ )
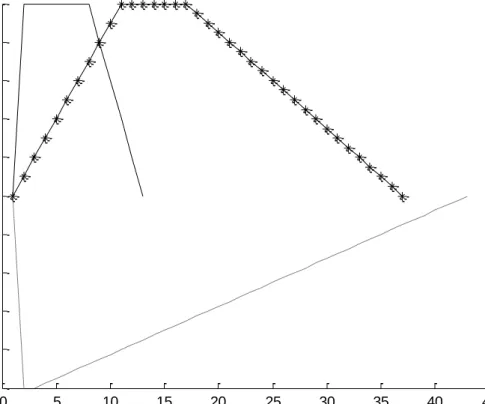
Figure 3. Trading profiles depending on when we detect upward price manipulation
Source: Authors’ calculation.
Note: Trading profiles to build up position when we detect upward price manipulation during stealth (solid line), awareness (solid line with asterisks) and liquidation (dashed line) phases.
0 5 10 15 20 25 30 35 40 45 -1 -0.8 -0.6 -0.4 -0.2 0 0.2 0.4 0.6 0.8 1
Days after detection
P o s it io n ( $ )
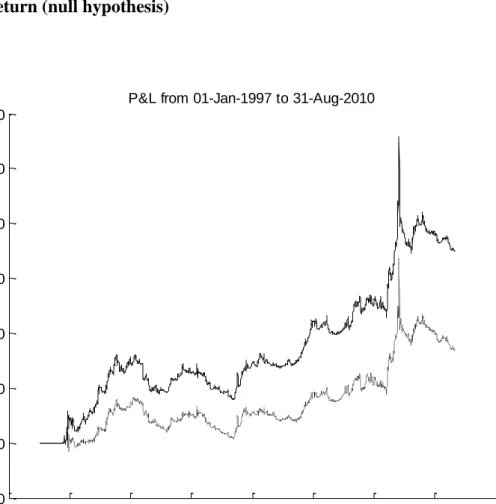
Figure 4. Stealth phase – Cumulative profit and loss from the hypothesized model vs. market return (null hypothesis)
Source: Authors’ calculation.
Note: The dashed line represents the profit and loss cumulated from investing the gross exposure (long plus absolute short) in the market indices while the black line represents the profit and loss cumulated from taking long or short position hypothesized to be executed by insiders. 1996 1998 2000 2002 2004 2006 2008 2010 2012 -100 -50 0 50 100 150 200 250 300 350 Year P & L i n $ u n it s
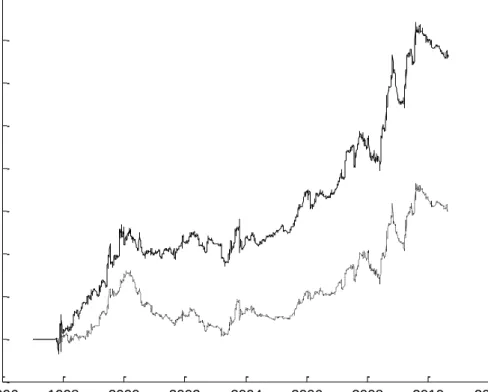
Figure 5. Awareness phase – cumulative profit and loss from the hypothesized model vs. market return (null hypothesis)
Source: Authors’ calculation.
Note: The dashed line represents the profit and loss cumulated from investing the gross exposure (long plus absolute short) in the market indices while the black line represents the profit and loss cumulated from taking long or short position hypothesized to be executed by insiders. 1996 1998 2000 2002 2004 2006 2008 2010 2012 -50 0 50 100 150 200 250 300 Year P & L i n $ u n it s
Figure 6: Awareness phase, and conditional on being detected during Stealth phase – cumulative profit and loss from the hypothesized model vs. market return (null hypothesis)
Source: Authors’ calculation.
Note: The dashed line represents the profit and loss cumulated from investing the gross exposure (long plus absolute short) in the market indices while the black line represents the profit and loss cumulated from taking long or short position hypothesized to be executed by insiders. 1996 1998 2000 2002 2004 2006 2008 2010 2012 -5 0 5 10 15 20 25 30 35 40 Year P & L i n $ u n it s
Figure 7. Liquidation phase – cumulative profit and loss from the hypothesized model vs. market return (null hypothesis)
Source: Authors’ calculation.
Note: The dashed line represents the profit and loss cumulated from investing the gross exposure (long plus absolute short) in the market indices while the black line represents the profit and loss cumulated from taking long or short position hypothesized to be executed by insiders. 1996 1998 2000 2002 2004 2006 2008 2010 2012 -30 -25 -20 -15 -10 -5 0 5 Year P & L i n $ u n it s
Table 1. Stealth and awareness phase results
Phases: Stealth Awareness
Awareness & conditional on being detected during Stealth Awareness & conditional on being detected during Stealth - Illicit profits and loss avoidance
Number of triggers 60299 39209 4192 4192
% of transaction days 0.84% 0.55% 0.06% 0.06%
Mean trigger per day 16.9 11.0 1.2 1.2
Mean trigger per stock 30.0 19.5 2.1 2.1
Long triggers 36630 24430 2886 2886
Short triggers 23669 14779 1306 1306
Days to enter position 10 1 1 6
Days holding the position 5 5 5 10
Days to liquidate position 20 5 5 5
Mean net position ($) 75.64 25.86 4.29 7.74
Median net position ($) 61.05 25.40 3.00 5.77
Mean gross position ($) 300.56 104.42 11.21 20.45 Median gross position ($) 285.20 98.00 9.20 17.27 Daily return: mean (bps) 1.790 4.466 7.256 61.223 median (bps) 2.573 5.907 7.946 53.797 std deviation (bps) 43.74 107.50 161.14 133.63 ttest p-value 0.015 0.016 0.009 0.000 Source: Authors’ calculation.
Note: The triggers are generated when the stocks satisfy certain bullish and bearish conditions as described in the main text. We initiate the $1 long/short positions by entering/holding and liquidating the position linearly over days as described. Daily return is calculated based on the profit divided by the gross exposure (long plus absolute of short). Bps is a hundredth of a percentage.
Table 2. Liquidation phase results Phases: Liquidation Liquidation, conditional on being detected during Awareness Liquidation, conditional on being detected during Stealth and Awareness
Liquidation,
conditional on being detected during Awareness - Illicit profits and loss avoidance
Liquidation,
conditional on being detected during
Awareness and Stealth - Illicit profits and loss avoidance
Number of triggers 4049 1362 435 1362 435
% of transaction days 0.06% 0.02% 0.01% 0.02% 0.01%
Mean trigger per day 1.1 0.4 0.1 0.4 0.1
Mean trigger per stock 2.0 0.7 0.2 0.7 0.2
Long triggers 2330 474 120 888 315
Short triggers 1719 888 315 474 120
Days to enter position 1 1 1 26 26
Days holding the position 0 0 0 25 25
Days to liquidate position 40 40 40 40 40
Mean net position ($) 3.80 -2.78 -1.44 7.50 3.67
Median net position ($) 2.58 -1.13 -0.70 3.47 1.50
Mean gross position ($) 24.88 9.13 3.23 24.62 8.08
Median gross position ($) 19.23 7.25 1.93 20.13 5.38
Daily return: mean (bps) -2.638 -3.261 -2.714 12.112 14.252
median (bps) -0.750 -4.489 -3.107 11.764 13.499
std deviation (bps) 89.79 129.08 176.22 95.88 131.15
ttest p-value 0.084 0.154 0.412 0.000 0.000
Source: Authors’ calculation.
Note: The triggers are generated when the stocks satisfy certain bullish and bearish conditions as described in the main text. We initiate the $1 long/short positions by entering/holding and liquidating the position linearly over days as described. Daily return is calculated based on the profit divided by the gross exposure (long plus absolute of short). Bps is a hundredth of a percentage.