Takustraße 7 D-14195 Berlin-Dahlem Germany
Konrad-Zuse-Zentrum
f ¨ur Informationstechnik Berlin
H
ANS
-C
HRISTIAN
H
EGE
, A
NDREI
H
UTANU
, R
ALF
K ¨
AHLER
, A
NDR
E
´
M
ERZKY
,
T
HOMAS
R
ADKE
, E
DWARD
S
EIDEL
, B
RYGG
U
LLMER
Progressive Retrieval and Hierarchical Visualization of
Large Remote Data
PROGRESSIVE RETRIEVAL AND HIERARCHICAL VISUALIZATION OF LARGE REMOTE DATA
HANS-CHRISTIAN HEGE1, ANDREI HUTANU1, RALF K ¨AHLER1, ANDR ´E MERZKY1,
THOMAS RADKE2, EDWARD SEIDEL2, BRYGG ULLMER1
Abstract.
The size of data sets produced on remote supercomputer facilities frequently exceeds the processing capabilities of local visualization workstations. This phenomenon increasingly limits scientists when analyzing results of large-scale scientific simulations. That problem gets even more prominent in scientific collaborations, spanning large virtual organizations, working on common shared sets of data distributed in Grid environments. In the visualization community, this problem is addressed by distributing the visualization pipeline. In particular, early stages of the pipeline are executed on resources closer to the initial (remote) locations of the data sets.
This paper presents an efficient technique for placing the first two stages of the visualization pipeline (data access and data filter) onto remote resources. This is realized by exploiting the “extended retrieve” feature of GridFTP for flexible, high performance access to very large HDF5 files. We reduce the number of network transactions for filtering operations by utilizing a server side data processing plugin, and hence reduce latency overhead compared to GridFTP partial file access. The paper further describes the application of hierarchical rendering techniques on remote uniform data sets, which make use of the remote data filtering stage.
1. Introduction. The amount of data produced by numerical simulations on supercomputing facilities continues to increase rapidly in parallel with the increasing compute power, main memory, storage space, and I/O transfer rates available to researchers. These developments in supercomputing have been observed to exceed the growth of commodity network bandwith and visualization workstation memory/performance by a factor of 4 [1]. Hence, it is increasingly critical to use remote data access techniques for analyzing this data. Among other factors, this tendency is strengthened by the increasing prominence of large, spatially distributed scientific collaborations working on common, shared sets of data. Under these conditions, the simple approach of (partial) data replication for local data analysis does not scale.
The sheer size of existing data sets creates a demand for flexible and adaptive visualization techniques, such as hierarchical rendering or viewpoint dependent resolution. Such techniques can reduce the initial amount of data to be visualized by maintaining the overall visual impression of the full data set. This can be achieved (e.g.) by retrieving the portions of the data set which are important to the user; or by retrieving low resolution versions of the full data set first, and refining this data later. Remote access to partialinteresting
portions of large data files can significantly support these techniques.
One major problem of naive remote data access techniques is the inherent difficulty in handling meta data for large data sets. Meta data is the highly structured set of information describing the data set, containing (e.g.) the number of samples per coordinate axis and the data volume bounds within physical space. While the metadata itself is relatively small, meta data access is often connected with many small read operations and many seek operations. However, individually requesting many seeks over a remote, potentially high-latency connection is quite inefficient for protocols that do not support transactions over higher level operations [2, 3].
In general, these developments ultimately require distributing the pipeline used for data visualization. The present paper describes techniques useable for distributing early stages of this visualization pipeline. Specifically, we enable the application to efficiently access portions of remote large data sets present in the HDF5 file format [4]. This general approach can be adapted both to other file formats and other access patterns. The paper further presents higher level visualization techniques which utilize these data access mechanisms to provide adaptive and progressive rendering capabilities.
The paper is structured as follows. First, we describe the problem space our approach is targeting in more detail in sect. 2. Next, we relate our research to other relevant research activities (see sect. 3). In sect. 4 follows an overall description of the techniques we developed. Sect. 5 and 6 describe the main components in more technical detail. The paper concludes with two sections about our results and an outlook for future work.
0This work was funded by the German Research Network (the DFN GriKSL project, grant TK-602-AN-200), and by the
2. Scenario. The increasing gap between resources available at remote supercomputing centers and on the local workstations of individual researchers is one of the major motivations for our research. In particular, we aim to improve the access to Grand Challenge simulation results as produced by numerous research collaborations around the world [5, 6, 7]. These simulations tend to drive the resource utilization of supercomputer resources to the available maximum, and often produce immense amounts of data during single simulations runs.
As an exemplary application we consider numerical relativity simulations performed in the Cactus simu-lation framework [8]. Among other things, this framework provides the simusimu-lation code with an efficient I/O infrastructure to write data to HDF5 files. The astrophysical simulations in question write data for scalar, vector and tensor fields (as components stored in separate data sets or files), and parameters for simulation runs. A typical size for a data file is on the order of tens of gigabytes1.
Visualization of this data during post simulation analysis usually does not require access to the complete data set. For typical production runs, where many different physical fields are written to disk, only a couple of these fields are visualized later. The data sets and subsets that are to be visualized are not initially known, but depend on interactive selections by the user (timestep, field, resolution, spatial area, etc.). For our target users, this flexibility needs to be maintained as far as possible.
Within these constraints, our target scenario is the following:
A scientist performs a large scale simulation run, utilizing one or more supercomputing resources at different locations. The simulation run produces up to TBytes of data, by storing various scalar and vector fields to HDF5 files. These HDF5 files are created according to a custom predefined structure.
After the simulation finishes, members of the scientists’ collaboration wish to visualize the data, or portions hereof, from remote workstations. They would like to use standard visu-alization techniques from their visuvisu-alization environment. They also wish to interactively choose the data fields to be visualized, and to interactively change the spatial selection and resolution for the data.
Ideally, the data transfer and visualization are adaptive to the available network connectivity, and hides data distribution details from the user.
This scenario defines the problem space we are targeting. We explicitely do not expect to find data on the remote systems which are, by pre- or postprocessing, specifically prepared for later visualization. We also want to provide a solution for environments with notorious short supply of I/O bandwith and compute resources. And we want to enable remote visualization for a broad width of end users, connected to the Grid by a wide range of network types and with varying, potentially low end commodity systems. The ability of the visualization pipeline to be adaptive to that range of boundary conditions is a central point of our efforts – the focus of the paper on progressive data retrieval patterns and on hierarchical rendering techniques emphasizes this.
3. Related Work. To support the scenario we presented, it is ultimately necessary to distribute the pipeline used for data visualization. In principle, there are many possible ways to distribute this pipeline (fig. 3) over remote resources. The distribution schemes used in real world systems are limited by the communication requirements for transferring data between the stages of the pipeline, and by the complexity of the resulting distributed software systems.
Early stages of the pipeline – remote access and remote filtering – potentially need to transfer and pro-cess large amounts of data, but show considerable flexibility with respect to latency. Also, by distributing these early stages, it is possible to completely hide the data locality from application and end user. Remote access solutions as NFS [10] and AFS [11] allow transparent utilization of standard (local) file I/O tech-niques. However, systems like NFS and AFS are problematic in the administrative maintenance. For widely distributed environments spanning multiple administrative domains these solutions are not applicable.
Common remote data access techniques crossing administrative boundaries are marked by several lim-itations. Some, like SCP and FTP, do not support access to partial files, which is not acceptable for our purpose of adaptive visualizing. Other techniques fail to deliver the performance required for interactive
1With a spatial resolution of 256 cubed, this corresponds to only a few scalar fields and one vector field in 64 bit, for 1000
Data
Source Data Set Image
filter map render display
access view
Geometry
user control
Fig. 3.1. Most visualization systems share the same underlying visualization pipeline [9]. The components of the pipeline can be freely distributed, in principle, as the communication elements between these components have different demands on latency and bandwith required. All elements of the pipeline should be controlled by the end user or by the application.
data visualization. For example, the GridFTP support for access to remote files with the partial file access feature [12] is inefficient for meta data access. Due to the file format chosen by HDF5, meta data is not necessarily stored in a continuous file space, but instead scattered in a hierarchical binary tree. Also, a single read on the HDF5 API level may be translated by the library into many individual low-level seek/read operations on the virtual file driver level. Other protocols are similarly lacking in support for transactions of higher level operations [2, 3].
Remote filtering techniques often integrate models of meta data and data structures, and can perform the data access efficiently2. Also, putting the remote filter on the remote site can significantly reduce the amount
of data to be transferred over the net, and ensures that only the data actually needed for the visualization process is retrieved and transferred. A standard problem for remote filtering is that this process needs to integrate a model of the data structures it is operating upon. It is difficult or impossible to implement filtering without explicit information about what is to be filtered, and this information is difficult to express in a general way that is applicable over a broad range of data formats and models. Hence, remote filtering techniques are often limited to specific file and data types, and to specific filtering operations.
The Data Cutter project [13] is another well known representative of the remote filtering approach. It provides the application programmer with a flexible and extensible filter pipeline to access portions of the original data set. Compared to our approach, there are several main differences. First, the data cutter
requiresthe data to be stored in chunked data files in order to benefit from its boundary box indexing scheme, since all chunks with a bounding box at least partly overlapping with the area of interest are completely read into memory, and passed to the filter pipeline. Also, since all filters pass data using network communication, the total network load is much higher than for our approach, where the filter resides at the data source, and is tightly coupled to the data access stage. Further, our utilization of standard Grid tools (GridFTP and GSI) seems more appropriate for the targeted Grid environment. On the other hand, Data Cutters user definable filter pipeline is more flexible than our approach.
One widely used compromise for remote filtering is the usage of preprocessed data sets: during the simulations I/O stage or during a post processing step, filter operations are applied to create new data sets on the remote resources. These data sets are stored in optimized form making later remote access and visualization very efficient. In the future, more and more simulation frameworks will support such features, not at least in order to improve their own I/O characteristics, i.e. due to compression on the fly, but also to enable the efficient handling of the very large data sets, after completion of the source simulation. Wavelet transformed data storage is an excellent example of that technique [14], which allows lossless compression, and adaptive, efficient offline acces to optimally resolved data samples. Other example filters create octrees [15] or similar structured representations [16], or provide progressive mesh generation.
For the problem space we described with our scenario, pre applied filters are no valid option, since they either need to be integrated into the simulation I/O code, what they aren’t in our case; or they need to be executed via external jobs on the remote resource. This duplicates the storage needed and potentially performs excess work, thereby wasting costly supercomputing resources.
After filtering, visualization algorithms work on the data and map essential features into geometries (including color and texture information, etc.). The next stage renders images from these geometrical
sentation. In the future, these stages may also be executed close to the data source, on the supercomputer itself. This would be the most efficient way to handle large simulation data, since the amount of data to be transfered during the later stages of the visualization pipeline typically decreases significantly. Completely changed access patterns to remote data can significantly reduce the amount of data transfered. Visualization algorithms using such patterns [17], in particular for large data, are seen as use cases for the presented work. The best prospects of deploying such scenarios have those environments containing PC-cluster based supercomputers. Here, adding commodity graphics boards to all nodes does not increase the total costs significantly, but allows high performance image rendering. These types of clusters are becoming increasingly common, but are still rare in the top500 [18]. For the collaborative and highly interactive visualization scenario we envision, the feedback to the remote and distributed rendering system gets important, and complex. Also, in perhaps the most important point, the field is currently missing sufficiently flexible software solutions which are able to realize such scenarios. Promising approaches do exist through work such as [19, 20, 21], and we expect major progress in that field over the next decade.
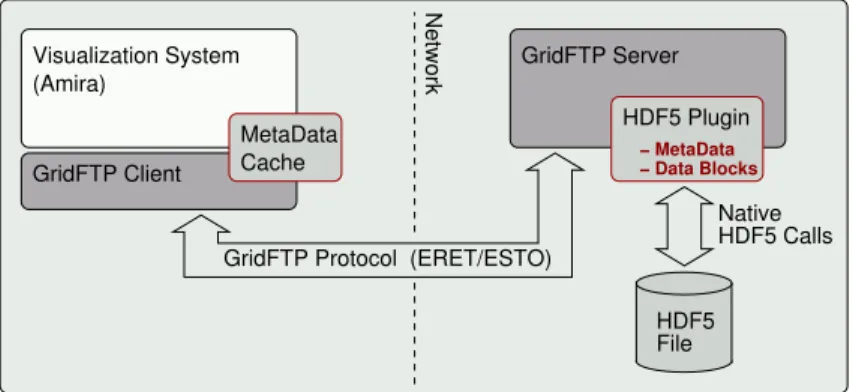
4. Architecture. Our proposed remote data access scheme builds upon the GridFTP protocol [12]. GridFTP is a Grid-aware extension to the standard FTP protocol. Amongst others, it provides a flexible server side processing feature, and allows specification ofcustomoperations on remote data. These operations are performed by corresponding custom extensions (“plugins”) to the GridFTP server. This technique is described in more detail in sect. 5. We utilize these server side data processing capabilities to perform data filtering operations on the scientific data sets. As described, the data sets are stored remotely in HDF5 format. Our plugin to the GridFTP server accesses this data locally via the HDF5 library, and performs data filtering on the fly.
HDF5 File Visualization System (Amira) GridFTP Client Network HDF5 Plugin − MetaData − Data Blocks MetaData Cache Native HDF5 Calls GridFTP Protocol (ERET/ESTO)
GridFTP Server
Fig. 4.1.The GridFTP protocol transports ERET commands from the visualization system to the GridFTP server, which forwards them to the HDF5 plugin. This way, the plugin can perform I/O operations plus filtering and data type conversion on the HDF5 file with full local performance. Data is transferred back via ESTO commands, and is written into the memory buffer of the visualization process.
An important element for the architectural decisions is the usage of the HDF5 file format [22]. Given the complexity of this format and the ongoing improvement efforts concerning the associated API, the decision was to use the existing API and to have the remote access procedures either on top of the API or as also described in sect. 3 underneath of it. The architecture described in this work has the remote operations on top of the HDF5 API, a limited set of high-level operations was chosen to be implemented by making use of the existing API, and these operations were integrated in the GridFTP server to be executed at the remote site.
A complete visualization session is performed as follows. The user selects a data file to be visualized by browsing the remote file space. Next, a connection to the remote GridFTP server is established, using the users GSI credential. The server plugin is utilized to perform an extraction of the files meta data (see sect. 5), which is then transfered to the visualization host and cached on the local file system. The visualization system accesses this local HDF5 file, extracts all needed information (number of time steps, bounding box, resolution, ...), and creates an octree hierarchy fitting the data set. The user can interactively specify the depth of the hierarchy. As the user then triggers various visualization operations on the data (to
produce orthoslices, hight fields, volumetric renderings), the octree blocks are scheduled in a separate thread for data reading. The read requests are served according to a priority tag defined for the visualization, and each trigger a GridFTP data access. This GridFTP data access utilizes our remote GridFTP server side data processing plugin. It extracts the data in the block specific resolution and returns this data. On arrival, the data is stored within the octree hierarchy, and the visualization is triggered to update the rendering by including the newly arrived data. On user request (e.g., next timestep) or timeout, all pending block reads can be canceled. Our visualization techniques (see sect. 6) use these features for dynamic data access to optimize visualization performance by requesting data blocks close to the viewpoint first, and by progressively improving data (and image) resolution.
5. GridFTP. As described in sect. 4, the GridFTP protocol plays a central role in our data access schema. GridFTP is mostly used for network file transfer, whereby this paper explores its usage for memory to memory transfer. This approach gives us a number of advantages if compared to approaches implemented on top of custom or proprietary protocols.
1. GridFTP allows for server side data processing, which we utilize for data filtering.
2. The GridFTP protocol, as an extension to the standard FTP protocol, is well known and reliable. 3. It allows the incorporation of standard servers for solutions with limited functionality.3
4. The GridFTP infrastructure takes care of: • establishing the data connection;
• ensuring authentication and authorization; • invoking the data filter plugin; and
• performing the data transfer;
In this way, the data transfer task is reduced to filling a buffer on the writing and reading it on the receiving end.
The following subsections describe the server side processing in more detail, and specify the low level oper-ations we use.
5.1. Server-Side Processing. As described before, the GridFTP protocol enables support for adding custom commands for server side data processing [12]. Specifically, the plugins offered by a server define sets of ERET and ESTO parameters that correspond to the data filter module implemented by the plugin4.
The extended store (ESTO) and extended retrieve (ERET) commands of the GridFTP protocol are defined as following:
ESTO <module_name>="<modules_parms>" <filename> ERET <module_name>="<modules_parms>" <filename>
module nameis a server-specific string representing the name of the module to be used. The second string (module parms) is module specific and defines the operation to be performed by the module. The last parameter (filename) specifies the file to be processed, which can be any file that can be processed by the given module. In our case, any HDF5 file.
5.2. Operations. We use this ERET/ESTO mechanism to define two operations that can be applied to HDF5 files: one for meta data filtering, and a second one for data access.
Meta Data Filtering. The first operation is the filtering of meta data from the HDF5 file. This is achieved by creating a filtered copy of the original file. Toward this end, the module reads and parses the original file, and writes the meta data information to a copy of the file. However, when copying (writing) a data set, we use the HDF5 filter interface and apply a filter to the original files data set. This filter reduces all data sets to zero length5. Thus, the only resulting differences between the generated file and the original one are in the data array and storage layout of the data sets. All other information – e.g., the hierarchy (groups), attributes, and data set information (name, data type and data space) – is preserved. While this approach might seem like a significant overhead, it is in fact very fast, due to the good performance of HDF5.
3bakwards compatible with FTP, by using normal FTP we could transfer the file to a local disk cache; for standard GridFTP
server(without plugins) we use direct partial file access (ERET PART, for filtering inefficient).
4Not all servers implement the same set of modules. In the current implementation, the plugins are compiled together with
the server, and are statically linked.
The generated file is transferred to the requesting client using GridFTP. The ERET command for requesting the meta data file is:
ERET Hdf5="METADATA" <filename>
filenameis the file from which the meta data will be extracted. Given the now dramatically reduced size of the file, the transfer time is very small relative to the transfer time of the original data6. After the high-level
filtering call is executed remotely and the transfer is finished, the client can access the local meta data file using the standard HDF5 API. In this way, we avoid to execute each HDF5 API call remote, and still offer the user the flexibility of the original API for meta data access. Because the data set structures within this temporary local file do not contain actual data, the standard API cannot be used for data access. For this task, we provide a second API call.
Data Set Reading and Subsampling. The second operation performs data selection and filtering. By knowing the data set coordinates (dimensions, data type) from the now locally available meta data, the client can choose to read an entire data set, or a portion of the data set. The HDF5 data sets logically group the actual data within multidimensional arrays named ”data spaces.” The model we use to specify a portion from a data set is based on the HDF5 ”hyperslab” model. A hyperslab describes either a contiguous collection of points, or a regular pattern of points or blocks in the data spaces. A hyperslab is specified by four parameters:
• origin: the starting location;
• size: the number of elements (or blocks) to select along each dimension;
• stride: the number of elements to separate each element (or block) to be selected; and • block: the size of each block selected from the data set.
All of these parameters are one-dimensional lists, with lengths equal to the number of dimensions of the data set. The elements of these lists specify data array lengths or offsets for corresponding dimensions of the data arrays. Currently the size of element blocks is predefined to one, which is adequate for the targeted visualization scenario. In future work, we will extend the protocol to accept variable block sizes.
Our current mechanism for specifying the hyperslab coordinates takes the following form: ERET Hdf5="BLOCK:NAME=<datasetname>;\ DIMENSIONS=<dims>;\ ORIGIN=<orig0>,<orig1>,...,<orign>;\ SIZE=<size0>,<size1>,...,<sizen>;\ SAMPLING=<sampling0>,<sampling1>,...,<samplingn>" <filename>
datasetnameis the fully qualified name (including the path to the data set) of the data set from which data should be read; orig0 to orign are the coordinates of the first element to be selected from the data set; size0tosizen are the number of elements to be selected in each dimension; andsampling0tosamplingn
represent the distance between two selected elements for each dimension.
This request is sent to the server. The server opens the file filename, opens the given data set, and reads the portion of the file specified by the given parameters. This procedure is performed via native HDF5 library calls. Next, the retrieved data is sent via the GridFTP connection to the client, which will convert the data to the local byte order if needed. To determine if conversion is necessary, the first 32 bits sent by the server represent an integer with the value of 1, encoded using the servers byte ordering.
The approach we have taken in creating this limited HDF5 API wrapper does reduce the flexibility provided by the original API. Nonetheless, for our visualization scenario this API is appropriate, and makes significant steps toward maximizing overall performance. To retain the flexibility of the original API, one approach would be to execute each native API call remotely. In this case, the cost per call is at least that of the network latency. This, combined with the relatively large number of calls needed for example to gather the meta data from the file, significantly reduces the performance. This motivates the usage of higher level API wrappers, as the one we have implemented. However, such wrappers need not to be as limited as our current version of course.
5.3. Security. The security model used used by the GridFTP server is GSI (Grid Security Infrastruc-ture) [23]. The client needs to hold a valid GSI proxy containing a security credential with limited validity. The proxy represents a Distinguished Name (DN) that must be present in the grid-mapfileof the server machine in order for the server to accept the connection. This proxy is used to authenticate the client without using passwords. After the connection is established, the server front end starts the MPI-based back end. This back end runs under the local identity to which the DN is mapped. The back end is responsible for all subsequent operations, including the filtering operations. This ensures that only authorized clients can access the information from the original file.
6. Adaptive Visualization. We utilize the previously described techniques for data access and filter-ing to generate a level-of-detail representation of the remote data set in the visualization phase.
First, the meta data – i. e. information about the number of data samples per coordinate axis and the data volume extension in physical space – is retrieved (see sect. 5.2). With help of this information, and a selectable minimal resolution of the data, an octree structure is generated, which initially contains no data other than the parent-child relations and position and extensions of the tree nodes. The root node of the structure will store a coarse representation of the whole data volume. This is recursively refined by subnodes with higher spatial resolution until the resolution of the original data is reached.
Next, the data for the octree nodes is requested from the reader module, starting at the root node. The order in which nodes are refined is determined by the distance from a user-defined point-of-interest, which might be the camera position or an arbitrary point within the data volume. Subregions of the data sets closer to this point are requested with higher priority than those which are further away. The position and resolution parameters for each request are specified and sent to the remote machine as described in sect. 5.2. The reader runs in a separate thread, so the visualization routines are not blocked during the loading phase. Each time a data block has arrived, the visualization module is notified, and this new data is reflected in the next rendered frame of the visualization.
Besides hierarchical visualization modules for orthoslicing and the display of height fields, we imple-mented a 3D texture-based volume rendering module for octrees. The octree is traversed in a view-consistent (back-to-front) order, starting at the root node. A node is rendered, if two criteria are fulfilled:
• The data for this node is already loaded (otherwise, the traversal of the associated subtree is stopped). • The data for the subnodes is not loaded yet (otherwise, the node is skipped and the subnodes are
visited).
Once a node is selected, it is rendered utilizing the standard approach for volume rendering with 3D textures, as proposed in (e.g.) [24, 25]. The 3D texture is sampled on slices perpendicular to the viewing direction and blended in the frame buffer.
In order to take advantage of the multi-resolution structure of the data for fast rendering, the sample distance of the slices is set with respect to the resolution level of the actual node, as proposed in [26].
7. Results.
7.1. Implementation. The implementation of the remote data access infrastructure we have described is based on an experimental version of the GridFTP server provided by the Globus Group. This server is not part of the Globus software distribution as of yet. It supports the addition of compile-time plugins (written in C) for handling specific incarnations of the ERET/ESTO protocol commands. Although ERET and ESTO are specified in the GridFTP protocol version 1.0, there is currently no other implementation of this feature available other than the basic support for partial file access and striped data access. There are good prospects for this feature to be present in various future implementations of GridFTP servers. The plugin code will be available via the GridLab project software distribution, and will be published at http://www.gridlab.org/.
For benchmarking the software we used a dual Xeon 1.7GHz Server running RedHat Linux 8.0 as a data server. The machine was equipped with 1GB of RAM and a logical volume storage of 320 GByte (36.5 MByte/sec transfer rate). The measurements have a granularity of 1 second.
The visualization modules we described have been implemented in the Amira visualization environ-ment [27, 28], which is based on OpenGL and OpenInventor. The renderings have been performed on a dual Pentium IV system with 2.6 GHz, 1 GByte main memory and NVidia Quadro4 graphics. The system ran under RedHat Linux 8.0 with the standard NVidia video driver.
Fig. 6.1. The sequence depicts the volume rendering of a remote data set. First, a coarse resolution representation of the data is generated on-the-fly and transferred to the local visual-ization client. Next, subregions closer to the point-of-interest (in this case, the camera position) are requested and integrated at progressively higher resolutions.
7.2. Benchmark Results. In order to evaluate our approach, we performed a number of performance measurements for accessing, loading and displaying large remote HDF5 data sets. We compare the perfor-mance obtained using the GridFTP plugin (GridFTP HDF5) with a comparable remote access technique, that is HDF5 over GridFTP partial file access (GridFTP PFA). We also include measurements of local (local access) and Network File System (NFS access) times to see if we achieved our goal of having acceptable waiting times before the first visualization is created, considering the local and NFS times as acceptable.
The results of these tests are listed in table 7.2. The time needed to create the first image (t3) is
composed of the time needed to gather and transfer the meta data (t1) and the time needed to filter and
transfer the subsampled first timestep (t2). t4 gives the access time for a full resolution time step.
The tests have been performed on a Local Area Network (LAN) with normal network load (latency 1ms, measured 32.0 MBit/sec), and on a Wide Area Network connection (WAN) between Amsterdam and Berlin (latency 20ms, measured bandwith: 24.0 MBit/sec).
TheWAN measurements have been performed with various level settings, that is with different depth of the octree hierarchy created.
These measurements show that the goal of a fast initial visual representation of the data set was achieved: a small startup timet3can be achieved by using theGridFTP HDF5 technique combined with hierarchical
access (level ≥2). This time is of the same order of magnitude as for local visualization.
Specifying the hierarchy level provides the user with an interactive mechanism for tuning response times. The data access scheme could prove its adaptivity for different network connectivity. In principle, the user can reduce the time to obtain a first visual representation by choosing a larger hierarchy level. The tradeoff for shorter startup times is the total transfer time for a fully resolved data set (all octree levels)7. The results
Access Type Net Level Meta Data Root Block Startup Complete
t1 t2 t3=t1+t2 t4
local access - 2 7 sec 1 sec 8 sec 3 sec
NFS access LAN 2 8 sec 5 sec 13 sec 8 sec
GridFTP HDF5 LAN 2 11 sec 2 sec 13 sec 11 sec
GridFTP PFA LAN 2 165 sec 10 sec 175 sec 200 sec
GridFTP HDF5 WAN 3 14 sec 2 sec 16 sec 126 sec
GridFTP HDF5 WAN 2 14 sec 3 sec 17 sec 68 sec
GridFTP HDF5 WAN 1 14 sec 7 sec 21 sec 45 sec
GridFTP HDF5 WAN 0 14 sec 41 sec 55 sec 41 sec
GridFTP PFA WAN 3 430 sec 28 sec 458 sec 3760 sec
GridFTP PFA WAN 2 430 sec 53 sec 483 sec 960 sec
GridFTP PFA WAN 1 430 sec 110 sec 560 sec 477 sec
GridFTP PFA WAN 0 430 sec 220 sec 670 sec 220 sec
Table 7.1
The table lists performance measurements for the various access techniques we explored. The results have been obtained by timing the visualization process for a 32 GB HDF5 file, con-taining 500 timesteps, each timestep with the resolution of2563data points (double precision).
show that relation (t3 / t4) clearly for the WAN measurements with different level settings.
Also, the large overhead for the complicated meta data access was dramatically reduced in comparison to GridFTP partial file access. The remaining time difference relative to the NFS meta data access results from the application of the zero filter to all data sets, the time needed to write the meta data file, and the time to transfer it.
8. Conclusions. With the presented scheme for progressive remote data access and its use for hierar-chical rendering, we have successfully realized the functionality targeted in our motivating scenario (sect. 2). In particular, the techniques we have developed support the adaptation of remote data access to a wide range of I/O connections, and react flexibly to user and application demands. For example, our mechanisms support adjustment of the systems reaction time – the time until the first visual impression for the data set appears – by adapting data filter parameters, such as the chosen octree depth.
Our presented solution does not depend on server-side offline preprocessing of the complete data set. The access to the data sets meta data, when compared to naive remote access techniques, offers very high performance, as supported by the results of Table 1. Only a small local disk storage space is required for caching the associated metadata.
The extensibility of this approach is also notable. This approach supports both additional data formats other than HDF5, and access patterns other than hyperslab, through the provision of additional plugins. Simultaneously, it is important to acknowledge that this approach may make it increasingly difficult to maintain compatible configurations on all hosts of a Grid. The situation may improve with future GridFTP server implementations allowing dynamic linking and invocation of plugins. Thus implementation is one of the first few existing utilizations of the ERET capabilities provided by GridFTP. It is expected to see many more in the future.
Our work further demonstrates the usability of the data access scheme for hierarchical rendering tech-niques. The implemented algorithms (orthoslice, height field, volumetric rendering) show very good perfor-mance, and are also adaptive to user specification and connectivity characteristics.
The presented architecture enables us to realize visualization scenarios which would be impossible earlier, by reducing the total amount needed for obtaining a visual data impression by orders of magnitudes, if compared to naive approaches.
Future Work. The techniques we have implemented show strong potential for more semi-automatic adaptivity to the properties of both the data and the compute environment. In the course of the GridLab project, we plan to include automatic tuning of visualization and data transfer parameters that respond to
available network bandwidth (as measured by NWS [29]) and data set resolution. One possible scenario would be to allow the user to set explicit time requirements for interactive visualization, and then adapt access patterns and transfer data to these requirements. Also, we plan to optimize the data access patterns of our visualization algorithms to better exploit the partial data access facilities.
As another point, we plan to enhance the progressive rendering aspects of our visualization algorithms. The rendering of the data volumes subregions which do not change between two rendering passes could be reused rather than replicated if the view point remains constant or shows only minor variations.
Regarding the remote data access framework, we plan to enhance the available access patterns and filters according to the demands of our visualization environment. One example might include support for supersampling. Additionally, we wish to utilize parallel data transfer streams, and to further deploy support for accessing data sets distributed over multiple data files in potentially distributed locations.
A major topic in our work is the ability to map the data models present in the HDF5 data files to the data models required by our visualization system (Amira). Toward this, we have implemented a prototype system that support the creation of lightweight data model plugins, which define a mapping from general HDF5 structure trees to other data models (e.g., inclusive access methods). We plan to continue enhancements and improvements to this implementation in the future.
We are aware of the fact that our focus on HDF5 data access is a limitation for potential user communities. We currently work on the implementation of more generic, data format independent access patterns, as for example the so-called pitfalls [30].
Acknowledgments. It is a pleasure to thank many colleagues and collaborators who contributed to this work both directly and indirectly. At ZIB, that are namely Werner Benger and Tino Weinkauf, who contributed to the overall ideas of our approach. We wish to thank the Globus group, in particular Bill Allcock and John Bresnahan, for their substantial support with the GridFTP server plugin infrastructure and implementation – without the experimental server provided by them, our work would have been hardly possible. We also wish to thank John Shalf and Werner Benger for many insightful discussions about data handling. Finally, we wish to thank the members of the GridLab project who contributed to the Adaptive Component work package for useful discussions about (future) semi-automatic adaptivity schemes, and for their support during the benchmarking
The presented work was funded by the German Research Network (the DFN GriKSL project, grant TK-602-AN-200), and by the European Community (the EC GridLab project, grant IST-2001-32133).
REFERENCES
[1] D. Alpert, “Scalable MicroSupercomputer,”Microprocessor Report, vol. 03/17/03-01, March 2003.
[2] W. Benger, H.-C. Hege, A. Merzky, T. Radke, and E. Seidel, “Efficient Distributed File I/O for Visualization in Grid Environments,” Tech. Rep. SC-99-43, Zuse Institute Berlin, January 2000.
[3] H.-C. Hege and A. Merzky, “GriKSL - Immersive ¨Uberwachung und Steuerung von Simulationen auf entfernten Super-computern,”DFN-Mitteilungen, vol. 59, pp. 5–7, September 2002.
[4] “Introduction to HDF5,” National Center for Supercomputing Applications (NCSA). http://hdf.ncsa.uiuc.edu/HDF5/doc/H5.intro.html.
[5] W. Benger, I. Foster, J. Novotny, E. Seidel, J. Shalf, W. Smith, and P. Walker, “Numerical relativity in a distributed environment,” inProceedings of the Ninth SIAM Conference on Parallel Processing for Scientific Computing, 1999. [6] N. Ramakrishnan and A. Y. Grama, “Data Mining Applications in Bioinformatics,” inData Mining for Scientific and
Engineering Applications, pp. 125–140, Kluwer Academic Publishers, 2001.
[7] J. Rumble Jr., “Publication and Use of Large Data Sets,”Second Joint ICSU Press - UNESCO Expert Conference on Electronic Publishing in Science, 2001.
http://users.ox.ac.uk/ icsuinfo/rumbleppr.htm.
[8] G. Allen, W. Benger, T. Goodale, H.-C. Hege, G. Lanfermann, A. Merzky, T. Radke, E. Seidel, and J. Shalf, “The Cactus Code: A Problem Solving Environment for the Grid,” inProceedings of the Ninth IEEE International Symposium on High Performance Distributed Computing, pp. 253–260, 2000.
[9] H. Schumann and W. M¨uller,Visualisierung. Berlin, Heidelberg, New York: Springer, 2000. [10] “Network Programming Guide,”Sun Microsystems Inc., March 1990. Revision A.
[11] “Wide Area File Service and the AFS Experimental System,”Unix Review, vol. 7, March 1989.
[12] W. Allcock, J. Bester, J. Bresnahan, S. Meder, P. Plaszczak, and S. Tuecke, “Gridftp: Protocol extensions to ftp for the grid,” GWD-R (Recommendation), April 2002. Revised: Apr 2003, http://www-isd.fnal.gov/gridftp-wg/draft/GridFTPRev3.htm.
on Archival Storage Systems,” inThe Eighth Goddard Conference on Mass Storage Systems and Technologies/17th IEEE Symposium on Mass Storage Systems, College Park, Maryland, USA, March 2000.
[14] A. Norton and A. Rockwood, “Enabling View-Dependent Progressive Volume Visualization on the Grid,”IEEE Computer Graphics – Graphics Applications for Grid Computing, pp. 22–31, March/April 2003.
[15] L. A. Freitag and R. M. Loy, “Adaptive, multiresolution visualization of large data sets using a distributed memory octree,” inProceedings of SC99: High Performance Networking and Computing, (Portland, OR), ACM Press and IEEE Computer Society Press, November 1999.
[16] L. Linsen, J. Gray, V. Pascucci, M. A. Duchaineau, B. Hamann, and K. I. Joy, Hierarchical Large-scale Volume Repre-sentation with ’3rd-root-of-2’ Subdivision and Trivariate B-spline Wavelets. in G. Brunnett, B. Hamann, H. Mueller and L. Linsen (eds.)Geometric Modeling for Scientific Visualization, Springer Verlag, 2003.
[17] C. Nuber, R. W. Bruckschen, B. Hamann, and K. I. Joy, “Interactive visualization of very large datasets using an out-of-core point-based approach,” inProceedings of the High Performance Computing Symposium 2003 (HPC 2003)
(I. Banicescu, ed.), (San Diego, California), The Society for Computer Simulation International, March 30 - April 2, 2003 2003. Orlando, FL.
[18] “Top 500,” November 2002. http://www.top500.org/list/2002/11/.
[19] J. Ahrens, C. Law, W. Schroeder, K. Martin, and M. Papka, “A Parallel Approach for Efficient Visualizing Extremely Large, Time-Varying Datasets,” Tech. Rep. LAUR-00-1620, Loa Alamos National Laboratory (LANL), 2000. [20] “VisIt User’s Manual,” Tech. Rep. UCRL-MA-152039, Lawrence Livermoore National Laboratory, February 2003. [21] S. Olbrich, T. Weinkauf, A. Merzky, H. Knipp, H.-C. Hege, and H. Pralle, “L¨osungsanstze zur Visualisierung im High
Performance Computing und Networking Kontext,” inZukunft der Netze - Die Verletzbarkeit meistern.(J. von Knop and W. Haverkamp, eds.), vol. 10, (D¨usseldorf, Germany), pp. 269–279, May 2002. 16. DFN-Arbeitstagung ¨uber Kommunikationsnetze, GIEdition - Lecture Notes in Informatics (LNI).
[22] “HDF5 File Format Specification,” National Center for Supercomputing Applications (NCSA). http://hdf.ncsa.uiuc.edu/HDF5/doc/H5.format.html.
[23] I. T. Foster, C. Kesselman, G. Tsudik, and S. Tuecke, “A security architecture for computational grids,” in ACM Con-ference on Computer and Communications Security, pp. 83–92, 1998.
[24] T. Cullip and U. Neumann, “Accelerating volume reconstruction with 3D texture mapping hardware,” Tech. Rep. TR93-027, Department of Computer Science at the University of North Carolina, Chapel Hill, 1993.
[25] B. Cabral, N. Cam, and J. Foran, “Accelerated volume rendering and tomographic reconstruction using texture mapping hardware,” in1994 Symposium on Volume Visualization(A. Kaufman and W. Krueger, eds.), pp. 91–98, 1994. [26] M. Weiler, R. Westermann, C. Hansen, K. Zimmerman, and T. Ertl., “Level-of-detail volume rendering via 3D textures,”
inIEEE Volume Visualization and Graphics Symposium 2000, pp. 7–13, 1994.
[27] D. Stalling, M. Westerhoff, and H. Hege, “Amira - an object oriented system for visual data analysis,” inVisualization Handbook(C. R. Johnson and C. D. Hansen, eds.), Academic Press, to appear 2003. http://www.amiravis.com/. [28] Amira User’s Guide and Reference ManualandAmira Programmer’s Guide. Konrad-Zuse-Zentrum f¨ur
Informationstech-nik Berlin (ZIB) and Indeed - Visual Concepts GmbH, Berlin, 2001.http://www.amiravis.com/.
[29] R. Wolski, N. Spring, and J. Hayes, “The Network Weather Service: A Distributed Resource Performance Forecasting Service for Metacomputing,”Journal of Future Generation Computing Systems, vol. 15, pp. 757–768, October 1999. [30] F. Isaila and W. F. Tichy, “Mapping functions and data redistribution for parallel files,” inProceedings of IPDPS 2002 Workshop on Parallel and Distributed Scientific and Engineering Computing with Applications, April 2002. Fort Lauderdale.
![Fig. 3.1. Most visualization systems share the same underlying visualization pipeline [9].](https://thumb-us.123doks.com/thumbv2/123dok_us/1351981.2680880/4.918.143.777.112.230/fig-visualization-systems-share-underlying-visualization-pipeline.webp)