Developing Bus Tracking System that predicts the arrival times of public buses at Universiti Teknologi PETRONAS (UTP) bus stops.
By
Norhasiah Mohd Akhir (2264)
Dissertation submitted in partial fulfillment of
the requirements for the
Bachelor of Technology (Hons)
(Information System)
DECEMBER 2004
Universiti Teknology PETRONAS
Bandar Sri Iskandar 31750 Tronoh Perak Darul Ridzuan
CERTIFICATION OF APPROVAL
Developing a Bus Tracking System that predicts the arrival times of public buses at Universiti Teknologi PETRONAS (UTP) bus stops.
By
Norhasiah Mohd Akhir (2264)
Approved by,
jO.
A project dissertation submitted to the
Information System Programme Universiti Teknologi PETRONAS In partial fulfillment of the requirement for the
BACHELOR OF TECHNOLOGY (Hons) (INFORMATION SYSTEM)
(Michelle Beh Hooi Ching)
UNIVERSITI TEKNOLOGI PETRONAS
TRONOH, PERAK
December 2004
CERTIFICATION OF ORIGINALITY
This is to certify that I am responsible for the work submitted in this project, thatthe original work is my own except as specified in the references and acknowledgements, and that the original work contained herein have nit been undertaken or done by
unspecified sources or persons.
NORHASIAH MOHD AKHIR
ABSTRACT
This dissertation shows about the project details in developing a Bus Tracking System
(BTS) by predicting the time arrival of a bus using simulation data. The main elements
in this report consist of introduction, literature review, methodology and results and discussion. The project is developed by using research activities, findings analysis and
developing prototype. All the basic elements in the system such as Automatic Vehicle
Location (AVL) System, Global Positioning System (GPS) and the Short Messaging
Services (SMS) Server have been analyzed. Based on the research, these elements are
discussed further to relate the usage with the system. This project is developed based on the advancement of Information Technology (IT) system today that has enabled people to have an intelligent transport system which assists them in traveling. Travel Information System (TIS) has been used widely in certain countries such as Singapore and United States of America (Stephanie Yap, 2003). Basically, the system works by locating and tracking any transportation using GPS technology installed in that transport. By collecting all the data needed such as speed and location, an algorithm can be developed to predict when the transport will reach a certain checkpoint. The
combination usage of the algorithm, AVL, GPS and SMS server, the information
regarding the time arrival of the transport can easily being retrieve by users. In this
project, an algorithm will be developed to predict the amount of time needed for the
incoming public bus to arrive, based on the current location of the bus and the current
time. Public bus users, especially students in UTP will be able to know when the bus is
coming by using their cell phones. The usage will allow them to access the system that manipulates this algorithm. The scope of the project includes developing an algorithm, the research and analysis of GPS and the use of SMS. Basically, the methodology that has been chosen is the combination of waterfall and spiral methodology. The development of the BTS will hopefully help to increase bus ridership, improve
accuracy, timeliness and availability of public buses at UTP.
ACKNOWLEDGEMENT
Alhamdullilah, praise to Allah SWT as I manage to finish this Final Year Project successfully. This project has certainly brought inestimable and invaluable experiences which have never been encountered before. It had become the opportunity for me to enhance my skills in solving problems independently and it has brought chances for me to apply my knowledge and expanding my thought in order to complete this project.
My utmost gratitude and thank goes to my supervisor, Michelle Beh Hooi Ching for her guidance and incessant help given throughout completing this project. This gratitude
also goes to Mrs Vivien, FYP Coordinator and the FYP Committee for ensuring this
project becomes a successful one. I also want to express my gratitude to other lecturers that help me in completing this project; Miss Syakirah and Puan Shuhani, for their willingness in helping me towards my project completion. Without their kind
cooperation and help, my project would never completed this far and it would never be
a fruitful and enjoyable experience. All of these wonderful people had continuously
given their hand in making the harvesting of the vast experience and knowledge at its
maximum capacity.My best wishes and thanks are also reserved for all the lecturers and technicians
involved for their willingness to share their experience and knowledge. Also thanks to my beloved family and friends for their support and encouragement for me to wade through this period. Last but not least, to those who has helped me through thick and thin either directly or indirectly, I owe all of you a debt of gratitude beyond measure.
Thank you very much.
TABLE OF CONTENTS CERTIFICATION OF ORIGINALITY. .11 ABSTRACT Ui ACKNOWLEDGEMENT. .IV CHAPTER 1: INTRODUCTION 1 1.1 Background of Study 1 1.2 Problem Statement 2
1.3 Objectives and Scope of Study 3
CHAPTER 2: LITERATURE REVIEW, THEORY AND
ASSUMPTIONS 4
2.1 Literature Review 5
2.2 Theory and Assumptions 10
CHAPTER 3: METHODOLOGY 13
3.1 Waterfall Methodology and Spiral Methodology 13
3.2 Bus Tracking System Methodology 18
3.3 Tools and Other Documents 22
CHAPTER 4: RESULTS AND DISCUSSION 23
4.1 Questionnaires 23
4.2 Bus Tracking System 26
4.3 Algorithm to Predict Time Arrival 30
4.4 SMS Server to Relay Output to UTP Students 33
4.5 Conclusion and Discussions 36
CHAPTER 5: CONCLUSION AND RECOMMENDATIONS 37
5.1 Conclusion 37
5.2 Recommendations for Future Upgrading 38
REFERENCES 39
APPENDICES 42
Appendix 2.1 London Bus Countdown Sign and Los Angeles Metro Rapid Real-Time Arrival Sign 42 Appendix 3.1 Public Bus Users Survey Form 43
Appendix 3.2 Gantt Chart 46
Appendix 4.1 The Use of Public Buses by students at UTP
Bus Stops 47
Appendix 4.2 Statistic of Students who own private vehicle at
UTP based on year of study 48
Appendix 4.3 The Percentage of UTP Students going out
In a week 49
Appendix 4.4 Time Consume by students to wait for the
arrival of Public Buses 50
Appendix 4.5 The Percentage of students need and do not need a traveler information system in UTP 51
Appendix 4.6 List of Coding 52
LIST OF TABLES
Table 2.1 Some Examples of Real-Time Transit Information
System 7
Table 2.2 The Data that from AVL System in a Public Bus 12
LIST OF FIGURES
Figure 2.1 Ipoh-Lumut Expressway route and 13 Zones 11
Figure 3.1 Iterative Nature in Spiral Methodology 14
Figure 3.2 Steady Progression in Waterfall Methodology 15
Figure 3.3 New Methodology for Bus Tracking System Project 18
Figure 4.1 The Main Interface of Bus Tracking System 26 Figure 4.2 Simulation DataUsed in Bus Tracking System 28
Figure 4.3 Action Result From Clicking START TRACKING 29
Figure 4.4 The Final Output from the Algorithm 32
Figure 4.5 Rhein-Main-Area (Germany) System 34
Figure 4.6 The SMS Part of the System 35
ABBREVIATIONS AND NOMENCLATURES
BTS Bus Tracking System
GPS Global Positioning Satellites
DGPS Differential Global Positioning System
SMS Short Messaging Services
AVLS Automatic Vehicle Location System TIS Traveler Information System
FTA Federal Transit Administration
DMS Dynamic Message Sign PDA Personal Digital Assistant WAP Wireless Application Protocol
CHAPTER 1 INTRODUCTION
1.1 BACKGROUND OF STUDY
Public bus schedules are the most widely used throughout this world. It tells the users
when their buses are supposed to leave terminals and when it might arrive at important
stops. However, actual departure and arrival times can vary from the scheduled times for certain reasons that are unavoidable such as traffic jams, traffic lights, large numbers of people boarding and alighting a bus, natural reason (raining) and so forth. These will absolutely affect the timing of public buses when running on their routes. The use of
real-time transit information today can help public bus users utilize their time efficiently
by allowing them to do other activities while waiting for theirbus.
With the use of Automatic Vehicle Location Systems (AVLS) and Global Positioning
System (GPS), real-time transit information such as bus locations and speeds can be retrieved dynamically. This information can be used to predict when the bus will arrive at certain point in a route. This time arrival of bus can definitely attract public bus users to access the system and use the predicted information for the decision of trip-making.
This information can be disseminated through a Traveler Information Systems (TIS)
accessed by the users at homes, work places, terminal centers, wayside stops or on
board through a variety of media. This kind of system has been developed widely in
Minnesota (TRAVELINK); SMARTBUS in Atlanta, Georgia; NextBus Information System in San Francisco and SmarTravel@IBP in Singapore. (Steven and Mei Chen, 2002).
The development of a model or prototype that can predict vehicle arrival at certain stop
is a challenging task. In this project, an algorithm will be developed to predict public
bus time arrival at UTP bus stops for Perak Roadways bus, General Bus and Sri Perak
bus by using simulation data. For this purpose, the bus's current location and the current
time are used in the algorithm to predict the amount time needed for the bus to arrive at
the bus stops of UTP. From the algorithm, TIS will be developed to enable the public
bus users to access the information they want.
1.2 PROBLEM STATEMENT
This project is to solve some of the problems faced by UTP students who use the public buses that come either from Ipoh or Lumut. Basically, there are three (3) public buses
providing the services that are Perak Roadways, General Bus and Sri Perak. The
journey is started from the bus station in Ipoh until the bus station in Lumut. Basically, the three buses have different routes taken from Ipoh to Lumut, which means they have
exactly different time arrival at the bus stop of UTP. The bus will arrive at UTP bus
stop in some times that is unknown. This contributes to some problems for the public
bus users where they do not really sure when the buses will be coming. There are some
reasons that will make the buses to arrive late than usual time such as:
-1. Traffic congestion
2. Bad weather
3. Transportation problem (technical problem such as engine problem, running out
of gas or tires punctured)
4. Many passengers boarding and alighting the bus
For these reasons the bus will arrive late than usual and this consumes time especially for students. It is a pain when students need to stand around waiting for the bus to show up, especially when it's cold and raining and also under a hot sun. It is a great benefit if
the users of public buses know when the bus will arrive at the bus stops they want. From this, the users can make their own decision whether to take the bus or use other vehicles. An algorithm can be developed to manipulate the vehicle's data and
information such as current time and current location and come out with a new data that
is the prediction time arrival of the bus. Such information can easily being accessed by
user using their cell phones.
1.3 OBJECTIVES AND SCOPE OF STUDY
The study involved in developing this project will cover the following
objectives;-1. To conduct a research and analysis about the functionality of Global Positioning
System (GPS) that can help human in their daily life. The understanding about the GPS is important to be the baseline in developing a Travel Information System (TIS). GPS is one of the ways to sense location of a vehicle by using radio signaling. Otherthan that, electronic signaling can also be used.
2. To analyze and understand about TIS that has already been developed in other
countries. Although this type of information is still new, the effectiveness of the system is very effective in human's daily life.
3. To identify the method that can be used to create an algorithm which can predict the arrival of bus. The algorithm is the important part in the system where the
output of the algorithm is the estimated time for a vehicle to arrive at certain stops.
4. To build TIS that uses this algorithm to predict time arrival of public buses and also for SMS interactivity purposes. For this objective, SMS server is important to play the role in providing end-users (public bus users) the information they want. The use of SMS is very effective because it provides the information quicker than other method, such as websites, dynamic sign and so forth.
The scope of study includes the use of GPS with AVL System and the impacts it will bring to the people's daily life. Later, with the use of appropriate tools, algorithm canbe developed to predict the time arrival of the public buses. This project is narrowed down into the analysis of public buses that go through the Ipoh-Lumut Expressway and UTP
CHAPTER 2
LITERATURE REVIEW, THEORY AND ASSUMPTIONS
2.1 LITERATURE REVIEW
As we all know, public bus schedules tell the users when buses are supposed to leave
terminals and when they might arrive at several important stops. However, actual
departure and arrival times can vary from the scheduled times for certain reasons such
as traffic jams, traffic lights, and large numbers ofpeople boarding and alighting a bus.
These will absolutely affect the timing of buses when running on their routes. Besides
having access to schedules, public bus users like to be informed of the real situation of
public buses. The availability of real-time transit information today helps bus users
make efficient use of their time by allowing them to pursue other activities while
waiting for the bus they want. It has also been shown to help reduce anxiety by letting
them to know when the next bus arrive or depart.
According to Federal Transit Assessment (FTA) of United States (US) Real-time
Transit Information Assessment (FTA, 2002, p.4), real-time transit information systems
are key technology applications within the transit industry designed to provide better
customer service by disseminating timely and accurate information. Real-time transit
information systems provide the following types of information:
• Estimated arrival or departure time for any transit or vehicle
• Vehicle location
• General information on service area, fares, routes, and travel times • Service disruption/delay information
• Information on transfers and other local/regional transportation services
• Peripheral information, such as advertisements.
Riders use this information to make various decisions about modes of travel, travel
routes, and travel times. This information is provided to assist riders in making pre-trip
and en route trip decisions. Moreover, the provision of real-time transit information helps improve the visibility of transit agencies within their communities.
In conjunction to the real-time travel information system, the advantages of it can be used to predict when a public bus will arrive at certain stops base on the bus real-time transit information. Needless to say, there is much demand from public bus users who
want to know how far away the next bus is from their stop. In US and UK, accessing to
the real-time transit information is made through a variety of media including dynamic
message signs (DMS) [Appendix 2.1] at stops and stations, kiosks (at bus shelters,
office buildings, shopping centers, and other locations), Wireless Application Protocol
(WAP), cable television, personal digital assistants (PDAs), the Internet, and
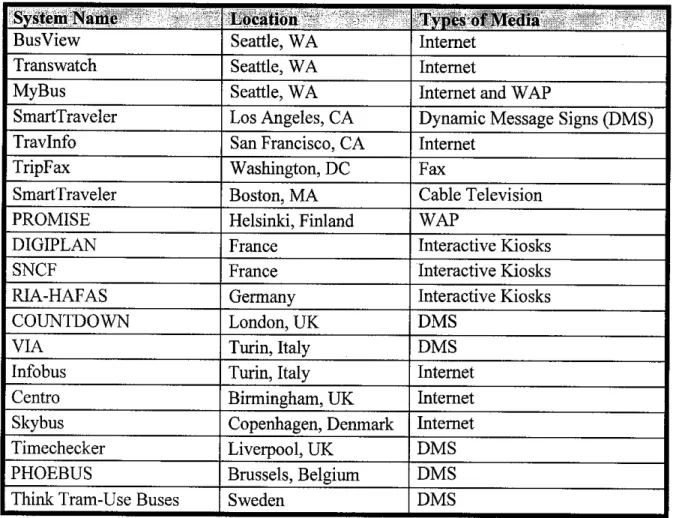
telephones. Table 2.1 lists some of the real-time transit information system and the
location of the system.System Name Location Types of Media
BusView Seattle, WA Internet
Transwatch Seattle, WA Internet
MyBus Seattle, WA Internet and WAP
SmartTraveler Los Angeles, CA Dynamic Message Signs (DMS)
Travlnfo San Francisco, CA Internet
TripFax Washington, DC Fax
SmartTraveler Boston, MA Cable Television
PROMISE Helsinki, Finland WAP
DIGIPLAN France Interactive Kiosks
SNCF France Interactive Kiosks
RIA-HAFAS Germany Interactive Kiosks
COUNTDOWN London, UK DMS
VIA Turin, Italy DMS
Infobus Turin, Italy Internet
Centro Birmingham, UK Internet
Skybus Copenhagen, Denmark Internet
Timechecker Liverpool, UK DMS
PHOEBUS Brussels, Belgium DMS
Think Tram-Use Buses Sweden DMS
Table 2.1: Some examples of Real-Time Transit Information System
Automatic Vehicle Location (AVL) systems usually have been used to provide real time transit information. Some transportation systems, for example bus, have AVL
systems installed. Steven and Mei Chen (2002) have done a research to prove that real time information such as vehicle location and speeds can be estimated dynamically with the application of AVL Systems. In their paper, they stated that such information can be
disseminated through Traveler Information System (TIS) and can be accessed by travelers at homes, work places, terminal centers, wayside stops or on board through variety of media. According to Lin and Bertini (February, 2003), AVL System not only useful for fleet management but also important for providing transit signal priority
systems, and scheduling the coordinated timed transfer among buses or between transit
and other transportation modes. One core component in many of these systems is the prediction of bus travel time between two given points. Today, there are approximately 60 million trucks and 140 million cars in the United States (Earthlink, 2004) have used
AVL System. Within the next few years, in-vehicle communications systems with wireless Internet connectivity will become standard equipment in cars, trucks and other
vehicles, creating a multi-billion dollar market for software solutions.
In a paper, DJ Dailey (2001) describes how a statistical model can be created to model
the motion of buses along their routes. His model assumes that the position data for the
buses are expressed in terms of a linear distance from the start of the route. This
approach works well with a sign-post-based AVL system, where the electronics in the
street sense, perhaps via radio tags on the vehicles, when the vehicles pass a certain
point. The computer that receives the AVL data can easily map a sign-postto a definite linear distance by looking up that information in a table of known distances.
Brendan Kidwell (2001) has described in his paper the use of GPS units in the vehicle
system with AVL System. GPS units in the vehicles receive a radio signal from GPS satellites in orbit around the earth and use physics and trigonometry to find their exact
three-dimensional position on the surface of the earth, which is expressed as latitude,
longitude and altitude. Finding the linear distance along a bus route from a bus known latitude and longitude is a complicated process that is prone to error, so Dailey's
algorithm would be difficult to implement on bus systems with this type of AVL
system.
The most common type of AVL that have been using nowadays is global positioning system (GPS)-based. Longley, Goodchild, Maguire and Rhind (2002) define GPS as a collection of 27 NAVSTAR satellites, orbiting the earth at a height of 12,500 miles, five monitoring stations, and individual receivers. The GPS was originallyfunded by the US Department of Defense, and for many years military users had access to only the most
accurately data. GPS is very useful nowadays to record ground control points for other data capture projects, for locating objects that move, and also direct capture of the locations of many types of objects. From Wikipedia Encyclopedia (2004) it is a satellite
navigation system used to determine one precise location and providing a highly accurate time reference almost anywhere on earth. Accordingly, FTA (FTS, 2002, p.4)
agree that GPS-based AVL system provides very accurate data on the location of transit vehicles. Through the calculation of reference data from at least four GPS satellites, a vehicle's location (longitude and latitude) can be calculated to within 10 to 20 feet. This accuracy can be improved by using differential GPS (DGPS), which uses a
reference station in addition to the GPS satellite data to determine location. In any case,
accuracy in vehicle location is critical in providing reliable real-time transit information. In fact, it is a key factor in the success of any such system.
Another element in the success of a real-time system is the accuracy of algorithms used
to predict bus arrival time (Wall and Dailey, 1999). Accurate prediction of arrival times
has not always been possible because of the number of variables involved (e.g., traffic flow and speed). However, in recent years, more sophisticated techniques and
algorithms have been developed and successfully tested, providing reasonably accurate
and reliable predictions.
Brendan Kidwell (2001) also presents in his paper that a computer algorithm for predicting the arrival times of public fixed-route buses at their stops, based on real-time observations of the vehicles' geographic positions can be developed by dividing each route into zones, and recording the time it takes to pass through each zone. Predictions are based on the most recent observation of a bus passing through each zone. The output
of the algorithm can be displayed publicly to users of TIS.
Although an accurate vehicle location and arrival time prediction are now possible, the effort to enable the use of real-time transit information still not spread widely across
countries in this world. In this literature review, the author manages to find some
possible reasons include:
• Costs of infrastructure investments • Institutional issues
• Liability and the loss of integrity associated with providing inaccurate or unreliable information.
2.2 THEORY AND ASSUMPTIONS
For Bus Tracking System (BTS), Ipoh-Lumut Expressway is the route that will be used
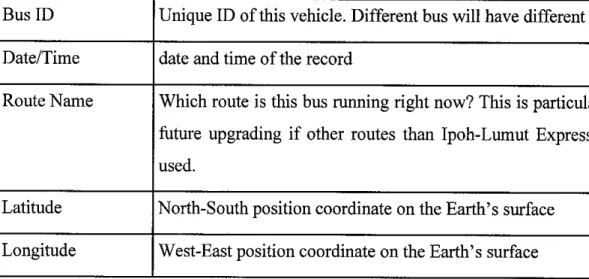
by all the public buses from Ipoh to Lumut. The distance of Ipoh-Lumut Expressway is 83 kilometers. There are three (3) public buses that that will trespassing UTP bus stops everyday, that are Perak Roadways, General Bus and Sri Perak bus. To identify the bus, each bus will be assigned a Bus ID to determine which ID belong to what bus. For algorithm purposes, Ipoh-Lumut Expressway is divided into 13 zones as in Figure 2.1.
UTP bus stops are in zone 5 as in the Figure 2.1. The 13 zones are as below:
-1 - Lahat -1 2 - Lahat 2 3 - Pusing 4 - Tronoh 1 5 - Tronoh 2 6 - Sri Iskandar 7 - Bota Kanan 1 8 - Bota Kanan 2 9-Bota Kanan 3 10 - Ayer Tawar 1 10
• 11- Ayer Tawar 2
• 12-Setiawan
• 13 -SriManjung
Figure 2.1 Ipoh-Lumut Expressway route and 13 zones.
All the zones in this route is determined based on distance that is approximately 6 kilometers and also the time that is usually taken for a bus to trespass each zone, approximately 8 minutes. Each border of the routes has their own latitude and longitude coordinate that is determined by Global Positioning System (GPS). This coordinate is fixed and will be used by a Geographical Information System (GIS) software to transform the coordinate of zones to zones number (1 until 13). In Bus Tracking
System, the assumption is that all the zones are already set up to their own numbers
without using a real GIS software.
The algorithm presented in this project makes the following assumptions and
theory:-• There is AVL System that used GPS-based in each public buses out on the road,
and at regular intervals of 60 seconds, the information in Table 2.2 is transmitted
to an operations center and relayed to the algorithm in real-time. In this project, the operation center is located at Jabatan Kerja Raya (JKR) Ipoh. The BTS is
controlled by a system administrator in JKR.
Bus ID Unique ID of this vehicle. Different bus will have different ID
Date/Time date and time of the record
Route Name Which route is this bus running right now? This is particularly f
future upgrading if other routes than Ipoh-Lumut Expressway
used.
Latitude North-South position coordinate on the Earth's surface
Longitude West-East position coordinate on the Earth's surface
Table 2.2: The data from AVL System in a public bus
All of the data in Table 2.2 will be transmitted to the operation center with the
use of Global Positioning System (GPS). GPS basically will find out the latitude and longitude for the bus. This longitude and latitude of the bus will determined at what zone the bus is currently in. The algorithm will calculate when this bus will arrive at certain stops / zones.
CHAPTER 3
METHODOLOGY
3.1 WATERFALL METHODOLOGY AND SPIRAL METHODOLOGY
In the earlier phase of this project, the author has decided to use waterfall methodology
as the main guidance. From the findings and analysis, a project involves people working
with a lot of tools to produce documents and code, with the guidance of goals and
strategies. For example:-1. Tools - compilers, debuggers, environments, change management, source control, project management, document processors and domain modeling tools. 2. Documents - requirements that define the problem of the project, the user
manuals, test plans, the scenarios, the design of architecture and implementation plans.
3. Coding - objects, data structures, algorithm, methods, modules, protocols and
interface definition
4. Strategies - materialized through the collection of the project architectures,
methods, diagrams, risk analysis, conventions and also from mission statement.
A project that consists all of the examples above need to be managed carefully and efficiently. One of the key ingredients that determine a good, successful project is to
choose the right methodology. For this project, the author has recognized two (2) most
well known methodologies that are waterfall methodology and spiral methodology. For this project the author decided to combine the best aspects from those two
methodologies to come out with her own methodologies. The author opted to adopt
the iterative nature from the spiral methodology and combine it with the steady
progression of the waterfall methodology and add some other projects' priorities.
Evaluate
Redact
Ret 55ft
Define
Design
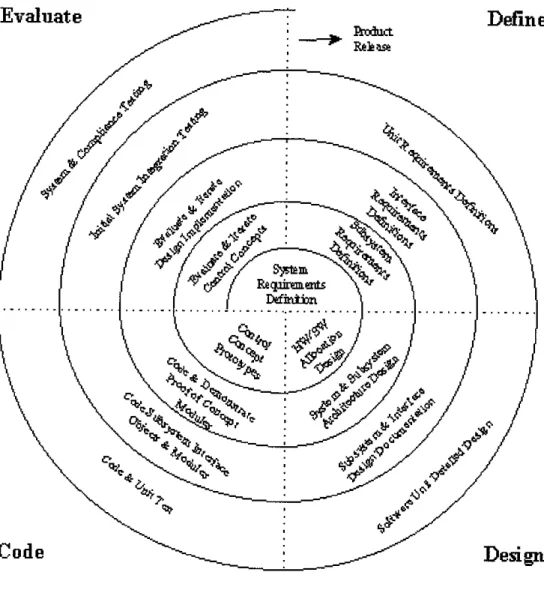
Figure 3.1: Iterative Nature in Spiral Methodology
From the Figure 3.1 above, it is clearly that the spiral methodology reflects the relationship of tasks with rapid prototyping, increased parallelism, and concurrency in design and builds activities. The spiral method can still be planned methodically, with
tasks and deliverables identified for each step in the spiral.
System Design Software System. Software System Design DetailedDesign System Requiremalib Review Ptelimmay Design Review
Code & UnitTest
Critical Design Review £tiegcttiai& Test Test Readiness Review
Fignre 3.2: Steady Progression in Waterfall Methodology
From the Figure 3.2 above, the orderly sequence of development steps in a project can
be done by using waterfall methodology. This helps to ensure the adequacy of
documentation and design reviews, hence ensure the quality, reliability, and
maintainability of the result product.
From the analyses that have been done, these two methodologies have four (4) general concepts that are analysis, design, implementation and testing. The four (4) concepts
are defined as follows:
-a) Analysis - A
The analysis phase deals with the requirements of the system, and how these
requirements will be accomplished. This phase defines the problem that the end
user are facing and need to be solved by the developer of the project. The
deliverable at the end of this phase is a requirement document. This requirement
document will consist the identification of software, hardware and system requirement. The requirement document tries to capture the requirements from
the end user prospective by defining goals and also, the interactions exist at a
level, removed from the implementation details. Basically, this phase is trying to
resolve the 'what' issues in a project.
b) Design-D
In the design phase, architecture of the system is established. This phase starts with the requirement document delivered by the requirement phase and maps the requirements into an architecture. The architecture defines the components, their interfaces and behaviors. The deliverable document from this phase is the design document of architecture. The design document describes a plan to implement
the requirements. This phase represents the 'how' phase. Details on computer
programming languages and environments, machines, packages, application architecture, distributed architecture layering, memory size, platform, algorithms, data structures, global type definitions, interfaces, and many other
system details are established in this phase.
c) Implementation -1
In the implementation phase, the developer will build the components of the
project that have been established in the design phase. Given the architecture document from the design phase and the requirement document from the
analysis phase, the developer should build exactly what has been requested though there is still room for flexibility. For example, a component may be
special cased for only this particular system, or the component may be made
more general to satisfy a reusability guideline across many systems forming a
product line. The requirement document or the architecture document should
give guidance. The implementation phase deals with issues of quality,
performance, baselines, libraries, and debugging. The end deliverable is the
product itself.
d) Testing-T
In many methodologies, the testing phase is a separate phase which is performed after the implementation is completed. There is merit in this approach because it is hard to see one's own mistakes and a fresh eye can discover obvious errors much faster than the person who has read and re-read the material many times. When doing testing on a system, the developer should consider the quality
aspects of the system.
For this project, the author came out with her own methodology that adopts some features in waterfall methodology and combines it with spiral methodology. These
features are based on the four (4) general concepts discussed earlier that are analysis,
design, implementation and testing.
3.2 BUS TRACKING SYSTEM METHODOLOGY
Problem and Solving
Identification
A
Prototype Development
Implementation and Quality
Assurance Product Delivery
0
>
c>
0
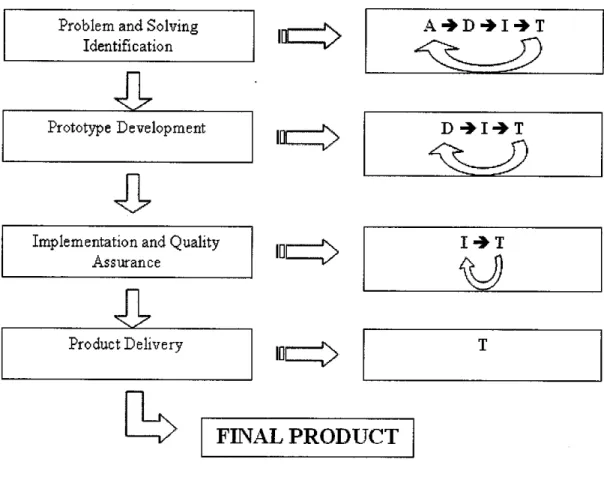
FINAL PRODUCTFigure 3.3: New Methodology for Bus Tracking System Project
From the new methodology as shown in Figure 3.3, the author separate the important aspects from the less important aspects and concentrate on solving the important aspects
first. The important and less important aspects are described as below:
-Important aspects
1. Define clearly, the algorithm that will be used to calculate the arrival time of public buses.
2. Convert the algorithm into coding (Visual Basic).
3. Use the algorithm to come out with the solution of the problem without any
error.
4. Enabled the last output of the algorithm (the time arrival) to be sent from the
system to the public bus users.
Less important aspects
1. The development of the user interface of the system
As the process continues, the details about the project are refined further until the
product is released. The iterative nature of the spiral methodology along with the steady
progression of the waterfall methodology is used together during the development of the
project. The general concepts discussed ealier (Analysis, Design, Implementation and Testing) are the main phases for each tasks to get the final product of the project. From Figure 3.3, each task needs to perform the four (4) general concepts but based on
priority. The main tasks to develop this project are:
-1. Problem and Solving Identification
2. Prototype Development
3. Implementation and Quality Assurance 4. Product Delivery
Defining the priority tasks function is important. The analysis tasks are a natural high priority. Later on in the process, testing and quality become a higher priority. This is where the change order control process becomes important. At the beginning of the process all four categories of analysis, design, implementation, and testing are available
for prioritizing and scheduling. At some point in the process, the analysis phase is
subjected to change order control. Having the analysis phase frozen focuses the attention on the remaining three categories of tasks. In a similar way, design and
implementation tasks are eventually frozen after some tasks already being done. At the
final stage only changes that effect quality of the final product are allowed.
In this methodology, the author classified the analysis, development, implementation and testing concepts into phases, while the tasks are the stages of the project. From her understanding and research, a phase is a natural grouping of similar activities. A stage is a natural temporal grouping of tasks within phases at particular times. Stages follow
each other in a monotonic ways. The phases in this project are similar as what have
been discussed ealier.
Problem and Solving Identification
In the first stage, the author worked simultaneously with all of the phases in the project. The analysis phase is conducted to generate requirements. The design phase takes these
requirements and feeds back complexity issues to the requirement document as well as
feeding critical implementation tasks to the implementation phase. The testing phase is to prepare and develop the testing environment. During implementation phase of the requirements, the author focused more to tackle on the critical and harder tasks. This is because she realized that doing the simple tasks first will usually end up with failing.
From her point of view, this stage is to convince herself that there are solution for the
problem of the project.
Prototype Development
In the second stage, the requirements and the requirement document are frozen and then placed under change order control. Changes in requirements are still allowed but
should be very rare and are very costly. In this stage, the requirement will only being allowed if the requirement change is absolutely necessary to the success of the product,
despite the potential delays in the product delivery or cost over runs. The main idea is to
force control on any new requirements. This forces the cycle to complete and enables product delivery. The architecture is still allowed to vary a little as technology pressures
deliver new options.
Implementation and Quality Assurance
In the third stage, the architecture is frozen and placed under change order control. This means that no more architectural changes are allowed unless they are absolutely necessary. Onthis stage, the author emphasized more on the implementation and quality assurance of the prototype before it is finalized into the final product. When enough of the system is built, the system is ready for a transition into the next stage of releasing a
high quality product.
Product Delivery
In the last stage, the implementation is frozen and the focus is primarily on quality. At the end of the stage, the final product is delivered. One of the goals of the last stage is to
make the product with a high quality. No known critical errors are allowed in the final product.
3.3 TOOLS AND OTHER DOCUMENTS
This new methodology is created to allow for phase interactions while at the same time
putting firm temporal deadlines at each of the stage. It also forces all four phases to
communicate up front and to work together. Besides methodology, the tools and documents that are used throughout this project also being identified. The list of the
tools and documents used are described as below:
-1. Tools
• Compilers and debuggers in Microsoft Visual Basic used in Windows
XP Professional environments.
• Sources come from World Wide Web documents and also from library.
• Using questionnaires [Appendix 3.1] to gather information for analyzing
purposes.
• Microsoft Project to build Gantt Chart [Appendix 3.2] and also other
Microsoft Office tools such as Word, PowerPoint and Excel as the
document processors.
• Microsoft Visio / System Architect domain modeling tools.
2. Documents
• Requirement document that defines the problem of the project. This document also identifies the hardware, software and system requirement.
• Gantt Chart and questionnaires for survey.
• The design of architecture (diagrams) and implementation plan.
3. Coding
• Objects, data structures and coding that will be used in Microsoft Visual
Basic.
• Algorithm that will be used to predict the arrival time of bus.
CHAPTER 4
RESULTS AND DISCUSSION
4.1 QUESTIONNAIRES
One of the research procedures in developing the project is by using the questionnaires [Appendix 3.1]. The questionnaires are mainly designed to focus on the first year until third year UTP students. From the author's point of view, public bus users at UTP mainly come from this group. Other than that, the questionnaires have also been distributed to fourth year and final year students. The main purpose of the questionnaires is to seek UTP students' response to the arrival time of the public buses which are Sri Perak, General Bus and Perak Roadways. It is also used to find out the difficulties students are facing while waiting for the bus at the UTP bus stops. This survey will be used to analyze the need of Bus Tracking System (BTS) that will predict
the arrival time of the next public bus.
Based on the questionnaires, some important results have been gathered. 1. The use of public buses by students at UTP bus stops [Appendix 4.1]
• Everytime going out - 45% • Always - 25%
• Sometimes-15%
• Never-15%
2. The amount of students who have their own private vehicle at UTP [Appendix 4.2]
Foundation
Year Yearl Year 2 Year 3 Year 4 Year 5
Yes 20 25 35 55 62 68
No 80 75 65 45 38 32
3. The percentage of UTP students going out in a week [Appendix 4.3]
• Never-32%
• 1-2 times-33% • 3-4 times-20%
• 5 times and more - 15%
4. The time consume by students to wait for the arrival of public buses [Appendix 4.4]
• Less than 10 minutes - 32% • Between 10 to 20 minutes - 29% • Between 20 to 30 minutes - 26% • More than 30 minutes - 13%
5. The percentage of students need and do not need a TIS in UTP [Appendix 4.5]
Time Waiting Problem (69%)
No Time Waiting Problem
(31%)
TIS Needed 79 49
No TiS Needed 21 51
Based on the result above, conclusion that can be obtained is that a Travel Information System (TIS) is vital for the use of UTP students. There are almost half
of the public bus users will use the public bus services to go anywhere (45%). This
is supported by other facts that students of UTP have a higher percentage in outing.
The time consumed by the students to wait for the arrival of bus is also higher. This
means that students of UTP need an 'assistant' or a system that can tell them when the next bus will coming. The majority of students agreed that the TIS is needed in
UTP environment regardless of having problems with the bus arrival time. This TIS
should have the ability to predict when the public buses will arrive at UTP bus
stops. This will help students to make efficient use of their time and avoid wasting
their time to wait for a bus to come.
As the result from the questionnaires, Bus Tracking System (BTS) has been developed as a new TIS for UTP students. This system works based on the theory and assumptions that have been discussed in the previous chapter. The BTS is discussed further in the next section.
4.2 BUS TRACKING SYSTEM (BTS)
Track Your Bus!
[Schedules
Time I Bus No I Zone
Route Map -UTP SMS Service
TraSk Your Bus N©w!
Ipdh-Luifiut Expressway
You are howaf zone: Fo"nes < x\
Your are-heading to; Destination
.Start Tracking ^~
TrackiY6ur\Biis-4-The tim&atediye indi^stesihow long itwill be before the ne^bus.witksi'rive at the zone/heading in that direction
Normal hours of operation:
6 ,00 AM f O400 PM iveFWDAY
=Ji|ais;page wjirautornaticalli! refresh every GO seconds.Figure 4.1 The Main Interface of Bus Tracking System
1. This main box will store the main three data that come from GPS.
2. Option list box that will be used by system administrator to input the current zone that there might be public bus users waiting. (See Figure 4.3 for details)
3. Option list box that will be used by system administrator to indicate the
current direction for the public bus users. (See Figure 4.3 for details)
4. This command button will be used by system administrator to allow the
system start tracking everyday at 6.00 p.m.
5. This command button is used to track the upcoming arrival of bus for the selected zone and direction for the both option list box
In Figure 4.1, the main interface indicates that the system that has not been started yet. The system is fully controlled a system administrator in Jabatan Kerja Raya Ipoh. To
enable the system start tracking public buses and predict the time arrival of the bus,
system administrator needs to click the START TRACKING button. This will allow the
system to start tracking public buses that are moving in Ipoh-Lumut Expressway route.
As what have been discussed in theory and assumption, the tracking is done with combination of Automatic Vehicle Location (AVL) System and Global Positioning
System (GPS). In this project, a set of simulation data (Figure 4.2) is used to test the
algorithm. The algorithm will be discussed further in the next section.
D tsstdata - Notepad WmjKil
Fjle Edit Format £tew Help
frime BusID Zone A
13 00:00 1 1 13 15:00 1 2 13 22:00 1 3 13 35:00 1 4 13 42:00 1 5 13 59:00 1 6 14 06:00 1 7 14 17:00 1 8 14 28:00 1 9 14 39:00 1 10 14 45:00 1 11 14 54:00 2 1 14 5 5:00 1 12 15 05:00 2 2 15 07:00 1 13 15 12:00 2 3 15 15:00 1 12 15 23:00 2 4 15 24:00 1 11 15 35:00 2 5 15 36:00 1 10 15 42:00 2 6 15 43:00 1 9 15 5 5:00 2 7 15 57:00 1 8 16 02:00 2 8 16 04:00 1 7 16 12:00 2 9 16 13:00 1 6 16 2 5:00 2 10 16 26:00 1 5 16 34:00 2 11 16 37:00 1 4 16 48:00 2 12 16 49:00 1 3 16 55:00 2 13 16 58:00 1 2 17 06:00 2 12 17 08:00 1 1 17 15:00 2 11 17 16:00 1 2 17 28:00 2 10 17 29:00 1 3 17 36:00 2 9 17 38:00 1 4 17 46:00 2 8 17 47:00 1 5 1 < LnljCol. ,:; Figure 4.2
Simulation Data Used in Bus Tracking System
The clicking at START TRACKING button will enable the system to download all the simulation data into the system, and hence make the prediction for each
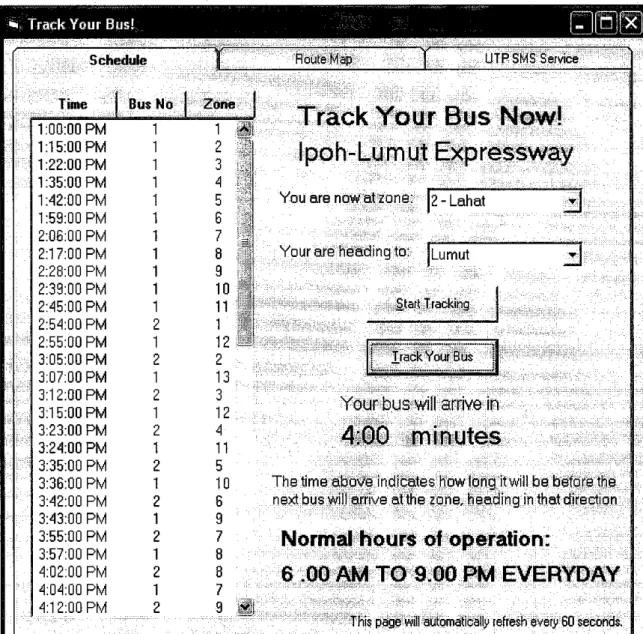
upcoming bus. The action result is shown as in Figure 4.3 below.
•*. Track Your Bus!
Schedule
Time Bus No Zone 1:00:00 PM 1:15:00 PM 1:22:00 PM 1:35:00 PM 1:42:00 PM 1:59:00 PM 2:06:00 PM 2:17:00 PM 2:28:00 PM 2:39:00 PM 2:45:00 PM 2:54:00 PM 2:55:00 PM 3:05:00 PM 3:07:00 PM 3:12:00 PM 3:15:00 PM 3:23:00 PM 3:24:00 PM 3:35:00 PM 3:36:00 PM 3:42:00 PM 3:43:00 PM 3:55:00 PM 3:57:00 PM 4:02:00 PM 4:04:00 PM 4:12:00 PM 1 1 2 3 4 5 6 7 8 9 10 11 1 12 2 13 3 12 4 11 5 10 6 9 7
•Routsfc UTP SMS Service
TrMck ^DflT Ejus
Ipoh-Lyjtijut E|p
YouarenoWateone: |2-Lahat
Your are heBding to:- ILumut
Start bracking
track Your Bus
Yotir bus will arrive irt
Thetimeappff indfcates ^bw tong it will be betb$3;tlje/ next buswill arrive.at"the zone,,heading in that direction..
Normal hours of operation:
6 001# T^9iio PM EVErWD&Y
•; THis page will automatically refresh every 60secontis.Figure 4.3 Action result from clicking START BUTTON
From the Figure 4.3 above, 2 different buses is used to show the moving of public buses in 13 zones of Ipoh-Lumut Expressway. The buses have Bus ID 1 and 2 to
differentiate both of them. For every 60 seconds (1 Minute), the system will interact with GPS to find out whether there are any new bus moving into new zones. Every
time there is a bus moving into new zones, the system will automatically update the data and make new prediction about the time arrival of the bus for each zone.
4.3 ALGORITHM TO PREDICT TIME ARRIVAL
The algorithm in Bus Tracking System works under several assumptions:
-• All the public buses that involve in this system use a fixed-route from Ipoh
to Lumut
• The algorithm works on real-time observations of the public buses'
geographic positions and conditions
• The algorithm works by dividing each route into zones and recording the
time it takes to pass through each zone
• Predictions are based on the most recent observation of a bus passing
through each zone.
In this project, the algorithm is divided into two parts
:-a) To set up new data for each bus base on their ID
Current Zone Time Arrival
If Previous Zone = 0 Then
Previous Zone = Current Zone 'new record for new bus
Elself Previous Zone o Current Zone Then 'the bus already have record in the system
If Previous Time Then End Time = Time Arrival
Duration = Time Arrival - Previous Time
If (Current Zone - Previous Zone) <= -1 Then 'the bus is heading to Ipoh
Elself (Current Zone ~ Previous Zone) >= 1 Then 'the bus is heading to Lumut
End If
If Previous Zone - 13 Then
'the bus is heading to Ipoh
End If
If Previous Zone = 1 Then
'the bus is heading to Lumut
End If
If (Duration < 45 minutes) And (Duration> 0) Then ZoneTime(Current Zone, Current Direction) = Duration
'record the duration the bus take in the zone for the
direction
End If
End If
Previous Zone = Current Zone Start Time = Time Arrival
'this is if the data for bus is already in the system record, but bus is still not moving from the previous zone
End If
b) To start predict time arrival for each bus
Current Direction Current Zone
Target Zone
*the predict start by adding on half of the time for the first zone (the one the bus is in)
If Not ((Target Zone = Current ZoneThen
If ZoneTime(Current Zone, Current Direction) = 0 Then 'cannot predict for this target zone yet because there still no history record for time arrival
New Duration = ZoneTime(Current Zone, CurrentDirection) / 2
End If
1add on the time of each intervening zone
Do Until (Target Zone = Current Zone) And
New Duration = New Duration + ZoneTime(Current zone,
Current Direction) Loop
' add on half of the time of the last zone (target zone)
New Duration = New Duration + ZoneTime(Current zone, Current Direction)
' if we have a prediction for this bus, add to collection
If New Duration Then
PredictionRecord Add New Duration
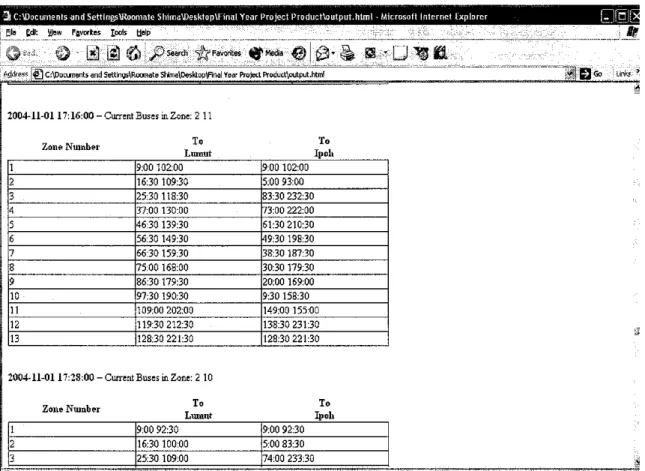
The algorithm that builds this system is the base line to the next process of the project that is to develop the coding in Visual Basic. Basically the output of the algorithm will be viewed in HTML format by the system administrator as shown in Figure 4.4.
3 C:\Documents aridSettlngsMtoomate Sliima\Desk1op\[ irial Year ProjectPrQducrAaulput.html - Microsoft Internet Explorer
01b £dt Iflsw FgvorKes lools Uolp
• u
Adtr« Wijc \Docunents andSettmgrtRoccnate Shima\Deslitop\Rnal Year Projett ProductVsitput html
2004-11-0117:16:00-Current Buses in Zone: 211
Zone Number To Lmnut To Ipoli 1 9:00 102:00 9:00 102:00 2 16:30 109:30 5:00 93:00 3 25:30 118:30 83:30 232:30 4 37:00 130:00 73:00 222:00 5 46:30 139:30 61:30 210:30 6 56:30 149:30 49:30 198:30 7 66:30 159:30 38:30 187:30 8 75:00 168:00 30:30 179:30 9 86:30 179:30 20:00 169:00 10 97:30 190:30 9:30 158:30 11 109:00 202:00 149:00 155:00 12 119:30 212:30 138:30 231:30 13 128:30 221:30 128:30 221:30
2004-11-0117:28:00-Current Buses in Zone: 2 10
Zone Number To Lmnut To Ipoh 1 9:00 92:30 9:00 92:30 2 16:30 100:00 5:00 83:30 3 25:30 109:00 74:00 233:30 »1B<
Figure 4.4 The Final Output From The Algorithm
The final output as shown in Figure 4.4 is based on the simulation data used in
previous section. Since there are 2 public buses that are moving from Ipoh to
Lumut, each direction to Ipoh and to Lumut has its own prediction. In the final output, system administrator also can view the current time, current date and current zone for both of the bus. The time stated in this final output is in minutes. The
current duration for each bus also can be viewed in the main interface of the system
(See Figure 4.3)
4.4 THE SMS SERVER TO RELAY FINAL OUTPUT TO UTP STUDENTS
Throughout the development of the project, some issues have been identified and
need to be analyzed further. One of the new issues is that the time arrival of abus
needs to be displayed through cell phones. There are alot of arguments or ways to
enable the cell phones to access such information. Maclean and Dailey (2000) have
addressed the data aspect of aWAP system that discussed about the King County
Metro system, which delivers content to Internet-enabled mobile devices such as
cell phones.
The information provided includes the arrival and departure
information at time points along the route. The mechanism for downloading data to
cell phones involves the user logging on to the system using the Internet and
downloading the data from the appropriate Web page to the device.
However, due to user interface restrictions, a mobile device cannot yet be used to
surf the Web in the same way as a desktop computer. Thus, a wireless markup
language (WML) has been introduced as the new language for WAP-delivered
content. The WML standard ensures that content developers can expect aminimum
level of functionality on any conforming mobile device. The advantage of this
approach is that it allows for the development ofstandards for these devices, which
in turn result in efficiency, economies of scale, and national interoperability.
According to Maclean and Dailey (2000), a major problem to overcome is the
delivery of necessary bus departure information to a device with the following
physical restrictions:• A display area supporting 12 fixed characters per row of text and up to four rows. One row may be reserved for function key labels.
• Support for ASCII text
• Horizontal and vertical scrolling.
• Choice selection via arrow or numeric keys.
For Bus Tracking System, the system cannot utilize WAP-enabled mobile
telephones or internet application as the previous examples. This is because due to
some limitations regarding the SMS server requirements and also the mobile-radio providers. The final output of the algorithm and predictions currently can only be viewed in the system itself by system administrator only. However, the way on how the data would appear in cell phones has been identified as shown in Figure 4.6 below. The function could be enhanced more for future upgrading.
* Track Your Bus!
Schedule Route Map UTP SMS Service
Make sure OZEKI SMS Server is running arid GSM
modem is active.
OZEKI SMS for Windows
SQi '^«nd *fiij Jtwrthre
taagvaoe w
Destination-from UTP Duration of Time Arrival
Bus to Ipoh 13 minutes to arrive
Bus to Lumut 15 minutes to arrive
Sfvfe Service"-is running.
: Stop SMS Service
Run SMS Service
Figure 4.6 The SMS part of the system
4.5 CONCLUSION AND DISCUSSION
For this system, there are several functions need to be focused on for future upgrading and maintenance.
• Security features for the system, since system administrator could log into the system without any password requirement. This means that anybody in
the operation center can log into the system
• The final output / data regarding the time arrival for bus should be available to public bus users that are UTP students. Currently it can be viewed in HTML format.
The predictions made by an algorithm are more accurate than a published schedule because they are based on the location of the bus, and how long it took to cross the distance between the user and the bus on the last run of the route. The algorithm will
be tested and proven valid by feeding it a few hours' worth of historical data and
then testing its predictions against later data which was not given to the algorithm.
The ideas of predicting the arrival bus for public transportation have been developed since six years ago. This practical approach has been used and manipulated by a lot
of travelers and public buses, especially in US, Singapore and China. It has been proved as a successful way to help them reduce amount the time needed to go to
other places. Indeed, it saves much important jobs they do in their daily life. In Malaysia, the use of GPS devices in transportation is still new and hopefully in the
future, more functions can be added to improve the lifestyle of the Malaysia's
citizen.
CHAPTER 5
CONCLUSION AND RECOMMENDATION
5.1 CONCLUSION
At the end of this project, the objectives that have been discussed earlier are
achieved. Based on the research and analysis about the functionality of Global
Positioning System (GPS), it has been proved that it can help human in their daily
life. The understanding about the GPS is important to be the baseline in developing a Travel Information System (TIS). Other than that, this project is also managed to
compare among TIS that has already been developed in other countries. Although
this type of information is still new, the effectiveness of the system is proved to be very effective in human's daily life.
Other than that, one of the objectives of the project is also to identify the method that can be used to create an algorithm which can predict the arrival of bus. The algorithm is the most important part in the system where the output of the algorithm is the estimated time for a vehicle to arrive at certain stop. This project is also built to enable the interaction with SMS. For this objective, SMS server is important to play the role in providing end-users the information they want. The use of SMS is very effective because it provides the information quicker than other method, such
as websites, dynamic sign and so forth. However, for this project, the author only
manage to output the data in the system itself. The data can then be output as SMS text for future upgrading.
5.2 RECOMMENDATIONS FOR FUTURE UPGRADING
Although the author has already managed to develop a Traveler Information System (TIS) by conducting an algorithm that predicts the time arrival of bus, this system can be expanded by integrating it with the real usage of GPS receiver and AVL System. Currently, this system can only work with simulation data. In addition, the usage of the TIS can also be further enhanced by enabling the prediction of time
arrival through dynamic signs and websites.
Other than that, the same algorithm also can work out with other routes in anywhere. Since, prediction time arrival of public buses is proved to be important in human daily life, in the future, the Bus Tracking System also can be implemented in other areas. Some changes can be done to the system, especially regarding the
amount of zone, the destination and also the distance.
As what have been stated in results and discussion section, security also one of the
important elements in a system. For Bus Tracking System, the security is important to avoid hackers, viruses etc that can penetrate into the system and destroy the original data. For example, the use of passwords to enter the system is vital to ensure that only authorized persons is enabled to view and controlled the system.
In the future, the SMS function that is not working in the current system can be
carry on. The SMS is important since it is the way for public bus users to get the latest data regarding the time arrival of bus. The use of GSM modem with combination of SMS server need to be considered and analyzed more.
REFERENCES
Automatic Vehicle LocationSystem Explained. Retrieved August 2, 2004 from http://www.vehiclelocationsystem.com/
Brendan Kidwell. (10 August 2001). Predicting Transit Vehicle Arrival Times.
Retrieved on July 15,2004.
rhttp://www.glump,net/content/bus predict/predictingtransitvehicle arrivals.htm]
D. J. Dailey, S. D. Maclean, F. W. Cathey & S. R. Wall. (January, 2001). Transit Vehicle Arrival Prediction: An Algorithm and a Large Scale Implementation.
Transportation Research Board, 80th Annual Meeting. Location: Washington, D. C.
EarthlinkResearch and Development about Automatic Vehicle Location (A VL) System. Retrieved August 2, 2004. from http://www.research.earthlink.net/avl/
Federal Transit Administration of United States. (2002). White paper on literature review ofreal-time transit information systems. (FTA Real-Time Transit Information
Assessment No. DTFT60-99-D-41022/OrderNo. 00007).
[http://www.itsdocs.fhwa.dot.gOv//JPODOCS/REPTS_TE/13845.html]
James R.Chapman. (1997). Software Development Methodology. Retrieved August 14, 2004. from http://www.hyperthot.corn/pm_sdm.htm
Maclean, S. D. and D. J. Dailey. (2000) "TTze use of wireless Internet service to access real-time transit information, Wireless Internet access to real time transit information, "
Retrieved August 14,2004. from www.its.washington.edu/its rjubs.html.
Max Hui, Ip Kung-Sau, DoraPao & Pat Desloge. (2001). Academic Grammar For
Students of the arts and social sciences. Retrieved August 14, 2004. from
http://ec.hku.hk/acadgrammar/
Paul A.Longley, Micheal F.Goodchild, David J.Maguire & David W.Rhind. (2002). GIS Data Collection. In John Wiley & Sons (Eds.), Geographic Information Systems
and Science (p.211). Location: West Sussex, England.
Ronald LeRoi Burback. (1997). The Software Engineering Methodology. Retrieved
August 14, 2004. from http://www-db.stanford.edu/~burback/water sluice/sluice
6.25.97/ws/nodel .html
Stephanie Yap (February 14, 2003). Stratech unveils bus tracking info system. July 20,
2004. Business Times.
Steven I-Jy Chien & Mei Chen. (February 1, 2002). Use ofneural network / Dynamic
learning algorithms to predict bus travel times under congestion conditions. July 20,
2004. [hmp://www.transportation.njit.edu/NCTIP/research/ResRep.asp?status=Ongoinj
&projectNo=102&grantNumber-992530]
Wei-Hua Lin & Robert L.Bertini. (February, 2003). Modelling schedule recovery
processes in Transit Operationsfor Bus Arrival Time Prediction. July 20, 2004.[http://web.pdx.edu/~bertini/JATLin_Bertini.pdfl
Wikipedia Encyclopedia. (2004). Global Positioning System. In Wikipedia, A Free
Encyclopedia. [http://en.wikipedia.org/wiki/Global_Positioning_System]
William Hickox. (2001). Real Time Passenger Information: Is ItPossible? Is It
Reliable? Is It Valuable?. Bus and Paratransit Conference, 2001.
Z.Wail & D.J Dailey. (January 10, 1999). An algorithmforpredicting the arrival time
ofmass transit vehicles using automatic vehicle location data. July 18, 2004. Location:Transportation Board Meeting, Washington D.C.
APPENDIX 2.1
London Bus COUNTDOWN Sign
Los Angeles Metro Rapid Real-Time Arrival Sign
APPENDIX 3.1
BUS TRACKING SYSTEM
Public Bus Users Survey Form
This survey is conducted to seek user's response (students of UTP) to the arrival time of public buses (Sri Perak, General Bus and Perak Roadways). It is also to find out the difficulties students are facing while waiting for the bus at the UTP bus stops. This survey will be used to analyze the need of a Traveler Information System (TIS) that will predict the arrival time of the next public bus by using the latest IT technologies. Please kindly circle / tick the option that you want.
USER'S INFORMATION
Course : CV / ME / CHE / EE / IT / IS Year : Foundation Year / 1 / 2 / 3 / 4 / 5 Gender : F / M
Hometown : Perak / Other State
SURVEY QUESTIONS
1. Do you have your own transport?
o Yes
o No
2. How often you travel (to Ipoh, Batu Gajah, Taman Maju or other places) in a week?
o Never
o 1-2 times o 3-4 times
o 5 times and more
3. How often do you use public bus at UTP? o Everytime I go out
o Always
o Sometimes
o Never
4. Do you encounter any problem regarding the arrival time of public bus? o Yes
o No
5. Usually, how much time is needed for you to wait for the public bus to reach
UTP bus stop?
o Less than 10 minutes o Between 10 to 20 minutes o Between 20 to 30 minutes o More than 30 minutes
6. Is the public bus will arrive at bus stops UTP same time everyday?
o Yes
o No
o Sometime
7. Is it important to have a Traveler Information System (TIS) that will predict the
arrival time of the next public bus at UTP bus stop? o Yes
o No
Please state any recommendation on how to improve the arrival time of bus (if
any):
THANK YOU FOR YOUR COOPERATION.
10 11 12 "13" 14 15 16 17 18 19 20 21 22 23 24 25 26 27 28 29 30 31 32 33 34 1.3 List objectives and scope of study 1.4 Preliminary research in the internet 1.5 Plan the project 1.6 Gantt Chart and Preliminary Report completed 2 Requirement Analysis and Definition 2.1 Analyze the preliminary research 2.2 Refine research in the internet 2.3 Conduct questionaires and survey 2.4 Establish literature review and theory 2.5 Choose methodology 2.6 Identify software, hardware and system requirements 3 System Design and Construction 3.1 Determine design specification 2.7 Progress Report completed 3.2 Design application architecture 3.3 Design system database (if applicable) 3.4 Determine the application prog rams, interfaces and programming 3.5 Construct and test system component 4 Implementation and Unit Testing 4.1 Test individual unit system and overall system 4.2 Final Draft completed 4.3 Make any modification (if applicable) 5 Integration and System Testing 5.1 Test overall system as final approval 5.2 Deliver production system into operation 5.3 Prepare manuals,load files and databases (if applicable) 6 Operation and Maintenance 6.1 Deliver whole system into community 6.2 Final Dissertation completed 6.3 Deliver ongoing system support 6.4 Gather users feedback Project: Bus Tracking System Date: 30 July 2004
Task Split Progress
Milestone Summary Project
Summary External Tasks External Milestone ^ Deadline -Q
APPENDIX 4.1
The Use Of Public Buses By Students At UTP Bus Stops 47 • Everytime II Always • Sometimes • Never
CO fi> o ^» CO c a. o. %
\
\
\
•?^
«-^
«-4.
c> Percentage (%) -j-roco-P^cno-vioocD ooooooooooT
*
.^i*?"*
:
•vi, * 1.4!S^j';--»'•••
i-a^v
•
O © to sr 5>" a o ^» CO c A! CD!
CO 3. i-+ < C fi) Q-ST"*<
<D 3" O CD > c HAPPENDIX 4.3
The Percentage of UTP Students Going Out In a Week
33% 49 32% • Never • 1-2 Times • 3-4 Times
APENDIX 4.4
Time Consume By Students To Wait For The Arrival
of Public Buses 13% 26% 29% 32% 50
• Less Than 10 Minutes H Between 10 to 20 Minutes a Between 20 to 30 Minutes D More Than 30 Minutes
APPENDIX 4.5
The Percentage of Students Need And Do Not
Need A Traveler Information System in UTP
Time Waiting Problem (69%) No Time Waiting Problem (31%) 51 TIS Needed No TIS Needed
APPENDIX 4.6
LIST OF CODING
Private todaysDate As Date
Private Sub cmdBus_Click()
Dim BusNo As String
Dim TimeArrive As Date
Dim ZoneNow As Integer
Open App.Path & "\test data.txt" For Input As #1
Do Until E0F(1)
Input #1, TimeArrive, BusNo, ZoneNow
IstBus.Addltem Str(TimeArrive) & " " & BusNo & "
" & Str(ZoneNow)
Loop
Close
'start other coding Dim inFile As Object
Dim outFile As Object
Dim fs As Object
Dim curFolder As Object
Dim route As cRouteModel Dim curTime As Date
Dim busID As String, eventTime As Date, zone As Integer
Dim inLine As String, busZones(l To 2) As Integer ' assume there are two buses
in input file
Set fs = CreateObject("Scripting.FileSystemObject")
Set curFolder = fs.GetFolder(App.Path) ' the folder where this program runs
Set inFile = curFolder.Files("testdata.txt").OpenAsTextStream
Set outFile = curFolder.CreateTextFile("output.html", Overwrite:=True)
' delete saved route data from previous run, for demonstration purpose
On Error Resume Next
curFolder.Files("route_Ipoh-Lumut Expressway.dat").Delete
On Error GoTo 0
1 set up route model object
Set route = New cRouteModel
route.Setup 13, "Ipoh-Lumut Expressway" ' assumes there are 13 zones in input
file
' initialize global Date variable that's added to the times given in the input
file
todaysDate = Date ' today's date ' toss first line of input
inFile.ReadLine ' setup HTML output outFile.Write _ "<html>" + vbCrLf + _ "<head>" + vbCrLf + 52
"<style> table { border-collapse: collapse; } td { border: Ipx solid
black; }</style>" + vbCrLf +
"</head>" + vbCrLf + "<body>" + vbCrLf
' loop through each line of input data
curTime = 0
Do Until inFile.AtEndOfStream
inLine = inFile.ReadLine
If Trim(inLine) = "" Then Exit Do ' exit if we encounter a blank line
parseLine inLine, busID, eventTime, zone ' parse out values from input
route.NewData busID, eventTime, zone ' send new data
busZones(CInt(busID)) = zone ' track where buses are
' if time changed on this line, write out status
If eventTime > curTime Then curTime = eventTime
writeStatus outFile, route, curTime, busZones
End If Loop outFile.writeLine "</body></html>" inFile.Close outFile.Close End Sub
Private Sub cmdTrack_Click()
Dim pred As Date
Dim route As cRouteModel
Dim tZone As Integer
Dim tDirection As rm_DIRECTION
If cboDest.Text = "Lumut" Then
tDirection = rm_INCREASING
Elself cboDest.Text = "Ipoh" Then
tDirection = rm_DECREASING
End If
tZone = Val(cboZones.Text)
If tDirection = rm_INCREASING Then
Select Case tZone
Case 1 IblTime.Caption = "2:00" Case 2 IblTime.Caption = "4:00" Case 3 IblTime.Caption - "6:30" Case 4 IblTime.Caption = "8:30" Case 5 IblTime.Caption = "10:00" Case 6 IblTime.Caption - "16:00" Case 7 IblTime.Caption = "26:00" Case 8 53
IblTime.Caption = "10:00" Case 9 IblTime.Caption = "10:00" Case 10 IblTime.Caption = "19:00" Case 11 IblTime.Caption = "26:00" Case 12 IblTime.Caption = "17:00" Case 13 IblTime.Caption = "10:00" E