An objectoriented energy benchmark for
the evaluation of the office building stock
Article
Accepted Version Creative Commons: AttributionNoncommercialNo Derivative Works 4.0Li, X., Yao, R., Li, Q., Ding, Y. and Li, B. (2018) An object
oriented energy benchmark for the evaluation of the office
building stock. Utilities Policy, 51. pp. 111. ISSN 09571787 doi:
https://doi.org/10.1016/j.jup.2018.01.008 Available at
http://centaur.reading.ac.uk/76827/
It is advisable to refer to the publisher’s version if you intend to cite from the work. See Guidance on citing . Published version at: http://dx.doi.org/10.1016/j.jup.2018.01.008 To link to this article DOI: http://dx.doi.org/10.1016/j.jup.2018.01.008 Publisher: Elsevier All outputs in CentAUR are protected by Intellectual Property Rights law, including copyright law. Copyright and IPR is retained by the creators or other copyright holders. Terms and conditions for use of this material are defined in the End User Agreement .www.reading.ac.uk/centaur
CentAUR
Central Archive at the University of Reading
An object-oriented energy benchmark for the
1
evaluation of the office building stock
2
Xinyi Li 1,2 , Runming Yao1,2*, Qin Li3, Yong Ding1, Baizhan Li1* 3
1, Joint International Laboratory of Green Buildings and Built Environments, Ministry 4
of Education, Chongqing University, Chongqing, 400045, China; 5
2, The School of the Built Environment, University of Reading, Whiteknights, Reading, 6
Whiteknights PO Box 219, RG6 6AW, UK; 7
3, Country Garden Group 8
Corresponding Author: Runming Yao, 9
Email: [email protected] ; [email protected]; 10
Postal Address: The School of the Built Environment, University of Reading, 11
Whiteknights, Reading, RG6 6UD, UK 12
Baizhan Li 13
Email: [email protected] 14
Postal address: The Faculty of Urban Construction and Environmental Engineering, 15
Campus B, Chongqing University, Chongqing, China, 400045 16
Abstract:
17
Energy benchmarking is useful for understanding and enhancing building 18
performance. The aim of this research is to develop an object-oriented energy 19
benchmarking method for the evaluation of energy performance in buildings. 20
Statistical analysis of the four-year monitored energy consumption data for office 21
buildings was conducted. The results show that the energy use intensity follows the 22
lognormal distribution with the Shapiro–Wilk normality test. Based on the lognormal 23
distribution, the energy rating system for office buildings has been established. An 24
object-oriented energy use intensity quota determination model has been developed. 25
This research provides practical tools that enable decision-makers to evaluate a 26
building’s energy performance and determine the energy benchmark. 27
Keywords:
28
Energy consumption; energy conservation; building energy benchmark; office 29
building; quota; carbon emissions. 30
Nomenclature
Symbols
A building gross floor area [m2]
d natural logarithm of the building EUI [kWh/m2]
D building EUI [kWh/m2]
E EXPF(x)
hourly electricity consumption [kWh] expectation function of lognormal distribution
GD gross building EUI [kWh/m2] CDF(x)
r
cumulative distribution function of the lognormal distribution the planned stock gross floor area increase rate [%]
S
SA UEXPF(x) PSA
building energy saving percentage compared to baseline year energy consumption [%]
stock gross floor area in baseline year (gross floor area for office buildings) [m2] updated expectation function of the lognormal distribution
planned stock gross floor area in the future [m2] v target building EUI [kWh/m2]
Φ cumulative distribution function of the standard normal distribution
mean value of the natural logarithm of EUI [kWh/m2]
standard deviation value of the natural logarithm of EUI [kWh/m2]
Abbreviations and acronyms Subscripts
CDD cooling degree day t tth hour of the year EUI energy use intensity
HDD heating degree day
HSCW hot summer and cold winter HVAC
GFA CPBECMP
heating, ventilation and air conditioning
gross floor area
Chongqing public building energy consumption monitoring platform 31
1. Introduction
32
China is one of the largest energy consumers in the world. In 2014, China generated 33
24% of the world’s electricity while consuming 21.2% of the world’s total final 34
consumption and emitting 28.2% of the world’s CO2 emissions from fuel combustion 35
(IEA, 2016). The total energy consumption of construction and operation in the 36
Chinese building sector accounts for 36% of the total energy consumption in China 37
(THUBERC, 2016). Building energy consumption associated carbon emission has 38
drawn major concern nationally and internationally. China has a distinctive building 39
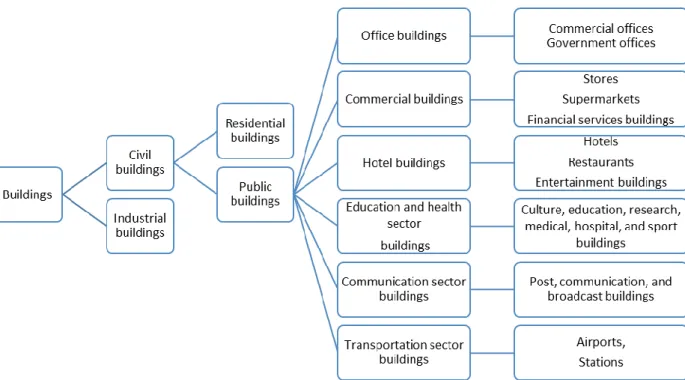
classification system with buildings classified into two major groups: civil and 40
industrial. Civil buildings are divided into residential buildings and public buildings. 41
The public buildings are further classified into office, commercial and hotel buildings 42
along with buildings in major sectors such as education, health, communication and 43
transportation (see Figure 1). 44
45
Figure 1: Chinese building classification(Yao et al., 2016b) 46
A nationwide large-scale investigation into energy efficiency of buildings carried out 47
over ten years ago recognized that government offices and large-scale public 48
buildings were to be the key focus of China’s energy efficiency reform (Liang et al., 49
2007). Public buildings are more energy intensive compared to residential buildings. 50
Especially, the energy use intensity (EUI) of large-scale public buildings (those with 51
more than 20,000m2 floor area) is 10 to 20 times higher than that of urban residential 52
buildings (MOHURD, 2014). According to the study by Tsinghua University Building 53
Energy Research Center (THUBERC, 2016), in 2014 energy consumed within public 54
buildings accounted for more than 27% of total energy consumption in buildings. 55
China has set an ambitious target of reducing carbon dioxide emissions by 60% to 56
65% per unit of GDP based on the 2005 baseline by 2030 (Department of Climate 57
Change, 2015). The public building sector, with its enormous potential for energy 58
saving and emission reduction, has been targeted for energy conservation in order to 59
achieve the national goal (MOHURD, 2017). Legislation had recommended 60
compulsory compliance with building standards and codes for the new buildings (Yao 61
et al., 2005). However, this posed great challenges for the existing buildings, 95% of 62
which were "highly-energy-consuming" (Xu et al., 2009). Therefore, building 63
retrofitting strategies, including improvement of building envelope performance; 64
application of renewable technologies; improvement of the efficiency of energy 65
systems; and intelligent operation and energy management, were to be considered by 66
central and local authorities to achieve the carbon-reduction targets while maintaining 67
a comfortable and sustainable built environment. In practice, two questions remain: 68
What is the distribution of energy performance in the current building stock? How can 69
the decision-makers evaluate and rank the energy performance of buildings within the 70
stock to identify, prioritize, and target buildings for retrofitting? Energy benchmark is 71
a useful measure for understanding and enhancing building performance. 72
The aim of this research is to develop an object-oriented energy benchmarking 73
method which could be used for the evaluation of energy performance in the building 74
stock and for deciding on actions for improvement. Using this new method, local 75
authorities will be able to set up realistic and scientifically-sound energy benchmarks 76
to reduce carbon emissions from buildings and minimize their environmental impact. 77
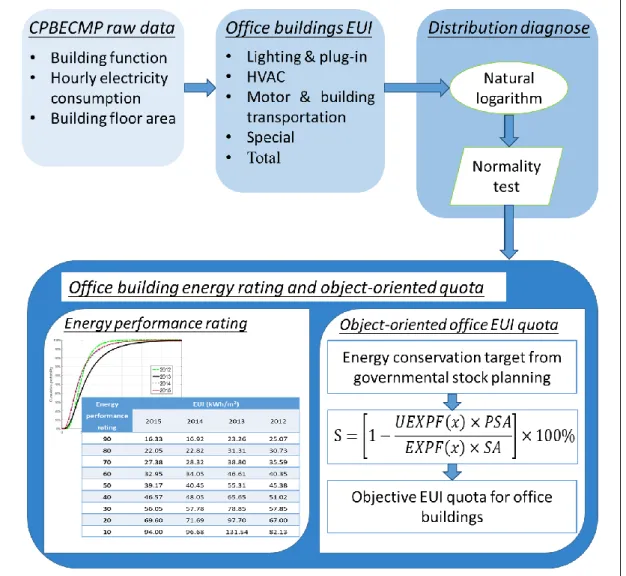
The framework of the paper is presented in Figure 2. 78
Figure 2 Framework of this paper 79
2. Literature review
80
The establishment of realistic benchmarks and quota mechanisms requires two main 81
steps: the collection of energy consumption data and building energy benchmark 82
setting. 83
2.1Building energy performance data
84
To set a reasonable building energy benchmark for a group of buildings sharing the 85
same function, a detailed analysis of building energy performance is needed. No 86
matter what methodology is used, adequate, valid, and reliable data are essential. The 87
data sources for building energy consumption are twofold: actual performance data 88
collected by surveying or monitoring and simulation data generated from computer 89
models. The computer simulation software can be used to calculate building energy 90
consumption (Boyano et al., 2013; Gao et al., 2014; Pomponi et al., 2015; Xu et al., 91
2013; Yao et al., 2016a), but a performance gap exists between predicted or simulated 92
energy use and actual energy use (Burman et al., 2014; Burman et al., 2012; de Wilde, 93
2014; Menezes et al., 2012; Salehi et al., 2015; Wilde and Jones, 2014). Onsite 94
measured data is favored for the evaluation of the actual energy performance of 95
buildings. 96
First conducted in 1979, the Energy Information Administration (EIA) in the United 97
States continuously carries out national surveys and collects information including 98
energy-related building characteristics and energy usage data for commercial 99
buildings, the Commercial Buildings Energy Consumption Survey (CBECS) (EIA, 100
2015). A similar survey, the Survey of Commercial and Institutional Energy Use 101
(SCIEU), is carried out in Canada. This survey collects data on types and quantities of 102
energy (such as electricity and natural gas) consumed by business and institutional 103
buildings in Canada (Natural Resources Canada, 2016). The first SCIEU was 104
conducted in 2010 as a combination of two previous energy-use surveys: the 105
Commercial and Institutional Consumption of Energy Survey, started in 2001 (Natural 106
Resources Canada, 2010), and the Commercial and Institutional Building Energy Use 107
Survey, started in 2003 (Natural Resources Canada, 2008). In the United Kingdom, 108
the Department of Energy and Climate Change (DECC) set up the Building Energy 109
Efficiency Survey (BEES) and the National Energy Efficiency Data-Framework 110
(NEED) for the collection of building energy consumption data and energy efficiency 111
analysis (DECC, 2013a, b). In Singapore, after Part IIIB—Environmental 112
Sustainability Measures for Existing Buildings was introduced to the Building Control 113
Act in December 2012, building owners are required to submit their building 114
information and energy consumption data annually to the Building and Construction 115
Authority (BCA) via the Building Energy Submission System (BESS) (BCA, 2017). 116
All of these surveys established databases including actual building energy 117
consumption data for building performance evaluation and energy consumption 118
benchmarking. The establishment of a comprehensive building energy consumption 119
database collected from actual buildings is the most reliable method of obtaining a full 120
picture of the whole building stock. Moreover, it provides a robust reference for 121
property owners and decision-makers to determine building energy benchmarks. 122
Data on the energy consumption of buildings in China are lacking due to the absence 123
of a monitoring mechanism in the national statistical system (Ding et al., 2009). An 124
urgent need exists to collect these data for statistical analysis (Yang et al., 2007). 125
The Ministry of Housing and Urban-Rural Development (MOHURD) started a 126
scheme of data collection for the large-scale energy consumption of public buildings 127
in 2007 to build up a national data system. The system collects both basic building 128
information (including name, year of completion, function, and floor area) and energy 129
consumption information (CABR, 2011; Ding et al., 2009). A total of 33 provinces 130
or municipalities have set up online public building energy consumption monitoring 131
platforms that provide yearly monitored building energy consumption reports to 132
MOHURD (MOHURD, 2015b). 133
2.2Building energy benchmarks and quotas
134
According to the definition of the U.S. Department of Energy (DOE), building energy 135
use benchmarking serves as a mechanism to measure the energy performance of a 136
single building over time, relative to other similar buildings, or to modeled 137
simulations of a reference building built to a specific standard (DOE, 2016). The 138
establishment of building energy use benchmarks and quotas can be an effective way 139
to reduce energy use. Many countries in the world have their own systems and targets 140
for achieving energy efficiency and reducing carbon emissions. 141
Based on the American commercial and residential building energy consumption 142
survey data, ASHRAE Standard 100 (ASHRAE, 2015) provides building energy 143
targets for 48 commercial and five residential building types, the energy target was set 144
as the lower quartile value of energy use by each building type. Moreover, ASHRAE’s 145
Building Energy Quotient project applied the Standard 100 methodology to determine 146
the building energy rating (ASHRAE, 2016). The other popular building energy 147
benchmark in the United States and Canada is the Energy Star rating, which allocates 148
a score from 1-100 to indicate building energy performance against their counterparts. 149
A building having achieved a score of 50 is ranked as an average level of energy 150
performance, while 75 or higher signifies top performance and is eligible for Energy 151
Star certification (ENERGY STAR, 2016a). In the United Kingdom, the publication of 152
Energy Consumption Guide 19-Energy Use in Offices sets the benchmark for typical 153
and good practice office buildings based on the median and lower quartile values of 154
the collected mid-1990s data (Best Practice Programme, 2000). CIBSE TM46 (CIBSE, 155
2008) provides an updated operational building energy benchmark for Display Energy 156
Certificates; these annual electricity and fossil-fuel benchmarks for whole buildings 157
are available for 29 building categories. The CIBSE Guide F provides a detailed 158
end-use benchmark for buildings with different building functions(CIBSE, 2012). In 159
the EU, due to the implementation of the European Directive on Energy Performance 160
of Buildings (EPBD) 2002/91/EC and the recast version 2010/31/EU, EU countries 161
are required to receive building energy performance certification(BPIE, 2014). EU 162
member states are required to ensure that energy performance certificates issued for 1) 163
buildings or building units that are constructed, sold or rented out to a new tenant; and 164
2) buildings where a total useful floor area over 250 m2 is occupied by a public 165
authority and frequently visited by the public(EU, 2010). The national building 166
benchmarking is based on the situation of an individual country’s own national energy 167
consumption. Germany updated the Energy Saving Ordinance (EnEV) to include 168
building energy certificates based on EPBD(BBSR, 2013). In Australia, the National 169
Australian Built Environment Rating System (NABERS) has been used for rating- 170
energy efficiency, water usage, waste management, and indoor environment quality of 171
buildings. The building types it covers include offices, shopping centers, hotels, data 172
centers, and homes. This star rating can have three different scopes: base building, 173
tenancy, and whole building. While three stars represent average performance, six 174
stars represent market-leading performance(NABERS, 2017). New Zealand generated 175
a New Zealand energy efficiency rating system for office buildings, called 176
NABERSNZ, which follows the same approach as NABERS but adapted for New 177
Zealand situations(NABERSNZ, 2017). In Singapore, the Building and Construction 178
Authority data are based on that collected from Building Energy Submission System 179
(BESS). It provides an annual building energy benchmarking report containing 180
national building energy benchmarks for seven commercial building categories for 181
four different functions. The four quartile values are used for benchmarking(BCA, 182
2016). 183
In China, during the design process for public buildings, designers can set up a 184
reference building which matches all the requirements indicated in the Design 185
Standard for Energy Efficiency of Public Buildings(MOHURD, 2015a). The 186
calculated building energy consumption of the reference building can be used as an 187
energy benchmark for the permitted maximum energy consumption. There is no fixed 188
standard benchmark building to be considered in the design process(MOHURD, 189
2015a), which could cause confusion for building designers aiming to meet energy 190
efficiency targets. 191
Studying building energy benchmarking has attracted many researchers in recent 192
decades. Based on 30 randomly selected supermarkets in Hong Kong, Chung et al. 193
(2006) provided a percentile table (from 10 to 90 percentiles) for benchmarking these 194
buildings using an empirical cumulative distribution of the normalized EUI. Zhao et 195
al. (2012) studied building energy quota determination methods for public buildings 196
in China and compared the pros and cons of different central tendency measures 197
including arithmetic mean, geometric mean, median, and mode. As a result, a new 198
statistical index, the ‘comprehensive application of mode and percentage rank,' has 199
been claimed as the best index for energy consumption quotas. But there is no 200
convincing solid evidence of the premium quality of this new index compared to other 201
indices. Xin et al. (2012) established energy consumption quotas for four-start and 202
five-star luxury hotel buildings in China’s Hainan province using statistical methods. 203
Here, the mean index of total energy consumption, the mean of EUIs, the quadratic 204
average of EUIs, the median of EUIs, the 60th percentile of EUIs, the 75th percentile of 205
EUIs, and the mode of EUIs are all considered. Consequently, a building EUI range 206
quota using the maximum and minimum values of all above-mentioned indices was 207
recommended for application during the initial quota implementation stage with the 208
mode of the EUIs to be the final quota after a further implementation of the quota 209
system. Ma et al. (2017) studied the building energy consumption of government 210
offices, general offices, and school and hospital buildings in northern China. The 211
selected energy performance benchmarks were the average, lower quartile value, 212
median value, and upper quartile value. In the first Chinese Building Energy 213
Consumption Standard(MOHURD, 2016), the energy benchmark system suggested 214
the mean and lower quartile values as the constraint and recommended indicators. 215
As pointed out by Yang et al. (2016), the building energy benchmark or quota derived 216
from the statistical indices like the mean and quartile values does not consider the 217
outcome of the actual energy saving results that the benchmark can achieve for the 218
entire stock. Meanwhile, Yang et al. developed a methodology to determine the 219
building energy consumption quota for each individual building using their own 220
historic energy consumption data. However, this kind of tailored individual building 221
benchmark is not suitable for application to a large-scale group of buildings as it 222
needs historic energy consumption data for each individual building to produce the 223
individual benchmark calculation. There is thus a need to develop a practical toolthat 224
can be easily applied on a large scale for decision-makers to use in the determination 225
of a savings-targeted building energy benchmark based on the monitored data for 226
energy consumption from representative buildings. The tool is expected to be used by 227
decision-makers of local authorities on each building’s energy conservation measures 228
to meet the carbon-reduction target based on the overall stock situation. An 229
understanding of the distribution of energy performance in the current building stock 230
can reveal the achievable energy conservation target. 231
3. Methodology
232
In the 13th Five-Year-Plan period (from 2016 to 2020), the Chongqing municipality 233
aims to retrofit 3.5x10⁶ m2 of existing buildings (Chongqing Municipal Commission 234
of Urban-Rural Development, 2016). This study takes the Chongqing office building 235
sector as a case study for the development of a large-scale building energy 236
performance evaluation method and benchmarking model because Chongqing 237
municipality holds one of the central government’s 33 energy monitoring platforms. 238
Chongqing's public-building energy-consumption monitoring platform (CPBECMP) 239
was established in 2012 by the Chongqing Municipal Commission of Urban-Rural 240
Development to collect real-time energy consumption data (electricity consumption 241
mainly)(Li et al., 2016). The information covers categories of energy consumption 242
and building information including the name of the building, its location, number of 243
floors, function, gross floor area (GFA), air-conditioned floor area, heated floor area, 244
type of HVAC system, and the number of occupiers. Electricity is the main energy 245
source in Chinese public buildings(Cheng et al., 2013), providing 93.4% of the energy 246
used in government office buildings and large-scale public buildings, followed by 247
5.3% natural gas and 1.1% artificial gas in the Hot Summer and Cold Winter (HSCW) 248
zone in which Chongqing is located (Liu et al., 2013). 249
For this study, hourly electricity consumption data from 2012 to 2015 were collected 250
from the CPBECMP database, which allowed further analysis of the energy 251
performance of Chongqing office buildings. Building energy usage intensity 252
distribution was identified and statistically tested using the Shapiro–Wilk test. Finally, 253
a Chongqing office building energy consumption benchmark and object-oriented 254
quota model were developed. 255
3.1.The building EUI calculation
256
On the CPBECMP, the energy consumption has been divided into four sub-systems: 257
the lighting and plug-in system, the HVAC system, the motors and building 258
transportation system and special systems. The motors and building transportation 259
system refers to all equipment such as the elevators and water supply pumps but 260
excluding fans and pumps in the HVAC system. The special systems section is for 261
uncommon or accessibility functions, such as a data center, laundry room, kitchen, 262
and swimming pool. The building EUI is calculated considering the ‘per-unit floor 263
area’ to enable a fair comparison between different buildings as it has been proved to 264
be the most suitable index to represent the energy consumption level(Xin et al., 2012). 265
A building’s total EUI, as well as the EUI for each sub-system, can be calculated 266
using Equation 1: 267
* 268
Based on the fact that all studied buildings are located in the same city, the weather 269
conditions do not vary from one building to another in terms of calculating annual 270
EUIs for the same year. So no weather correction factor is required. The annual 271
building EUIs are calculated and analyzed in section 4.2 to show the existing levels of 272
energy consumption in office buildings. 273
The natural logarithm of the EUI for an office building has been calculated using 274
Equation 2, 275 d=lnD (2) 276 3.2.Shapiro–Wilk test 277
The Shapiro–Wilk test is a test of normality in frequentist statistics, according to the 278
study of Ghasemi and Zahediasl (2012), and is a powerful method to check the normal 279
distribution of the natural logarithm of office total EUI. The null and alternative 280
hypotheses for the Shapiro–Wilk test are as follows: 281
The null hypothesis H0: the natural logarithm of EUI is normally distributed; 282
The alternative hypothesis Ha: the natural logarithm of EUI is not normally 283
distributed. 284
The most commonly used significance level (α=0.05) is adoptedin these tests, which 285
indicates that the level of confidence for the Shapiro–Wilk test results is 95%. If the 286
p-value, an index to assess statistical significance(Wasserstein and Lazar, 2016), is 287
greater than the significance level α, the null hypothesis cannot be rejected, so it is 288
reasonable to believe that the natural logarithm of EUI (d) is normally distributed. 289
In this study, the natural logarithm of each annual EUI has been analyzed using the 290
Shapiro–Wilk test. The revealed distribution characteristics provide a deeper 291
understanding of the actual operational energy consumption in office buildings in 292
Chongqing. 293
4. The Chongqing public building energy consumption monitoring platform
294
4.1.General information on the platform
295
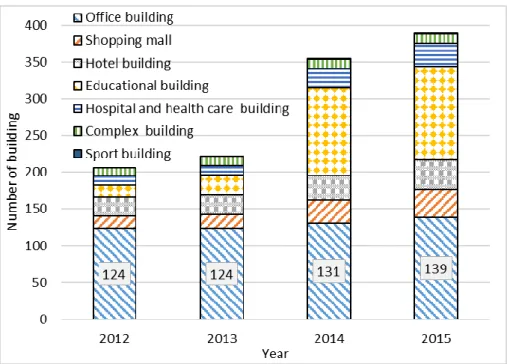
The CPBECMP has seven building categories based on the building function: office 296
building, shopping mall, hotel building, educational building, hospital and health-care 297
building, complex building, and sports building. After its establishment in 2012, the 298
CPBECMP had been operating continuously with more public buildings enrolled in 299
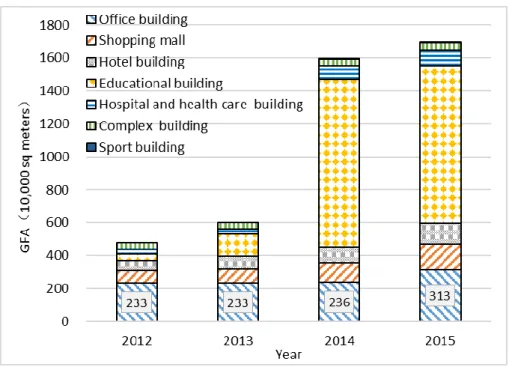
the energy monitoring every year. The number of buildings and the gross floor area 300
(GFA) of each building category are presented in Figure 3 and Figure 4. The total 301
number of monitored buildings was 206 with a GFA of 4.79x10⁶ m2 in 2012. In 2015, 302
the number of monitored buildings increased to 389 with a GFA of 16.93x10⁶ m2. 303
304
Figure 3: The number of buildings in CPBECMP 305
306
Figure 4: The GFA of buildings in CPBECMP 307
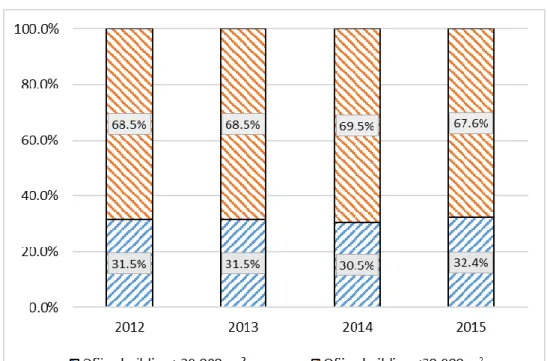
Figure 5 shows the floor area distribution of office buildings. We can see that office 308
buildings with a GFA less than 20,000 m2 account for more than 65% of those in 309
CPBECMP, while the percentage for the office buildings larger than 20,000m2 310
(large-scale office buildings) is about 30% of the total number. 311
312
Figure 5: The GFA distribution of office buildings in CPBECMP 313
4.2.The building energy consumption data
314
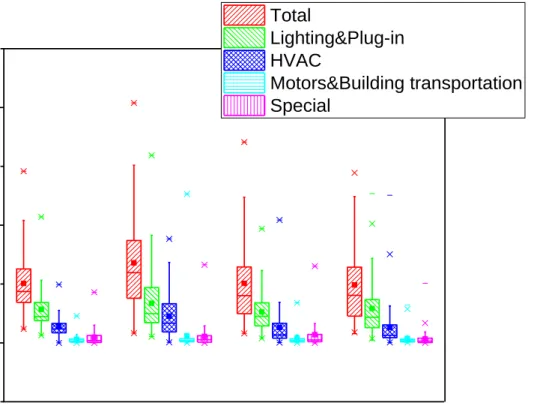
As described in Section 3.1, there are four sub-systems for the energy consumption 315
data provided by the CPBECMP. The box graph of building EUI in total and for 316
different sub-systems is shown in Figure 6. The mean values of the annual total EUI 317
in the Chongqing office building stock are greater than the median value, which 318
indicates the positive skewness of the total building EUI. Moreover, the total energy 319
consumption densities are non-negative, which indicates that they may be lognormal 320
distributed (Limpert et al., 2001). The normality tests for the natural logarithm of 321
building annual EUI are statistically processed and their results are illustrated in 322
section 5.1. 323
2012 2013 2014 2015 0 100 200 Year
kWh/m
2 Total Lighting&Plug-in HVAC Motors&Building transportation Special 324Figure 6: The annual EUIs of office buildings in different years 325
The lower quartile, median, and mean values for office building energy consumption 326
are shown in Table 1. The average percentage of total energy consumption for the 327
lighting and plug-in system is 49.5% to 59.3% for the four studied years, followed by 328
the HVAC system, which used over 25% of the total energy consumption. 329
Year
Energy
consumption sector
EUI (kWh/m2) The average
percentage of total energy consumption (%) Lower quartile value Median Mean 2012 Total 34.38 43.67 50.47 100.00%
Lighting & plug-in 18.89 22.43 28.52 56.50%
Motor & building transportation
0.64 1.45 3.03 6.00%
Special 0.4 1.99 4.84 9.60%
2013 Total 37.91 59.66 67.96 100.00%
Lighting & plug-in 17.24 24.75 33.63 49.50%
HVAC 9.36 16.8 22.74 33.50%
Motors & building transportation
1.05 1.87 6.06 8.90%
Special 0.56 2.69 5.52 8.10%
2014 Total 24.83 40.17 50.53 100.00%
Lighting & plug-in 14.41 22.58 26.32 52.10%
HVAC 4.03 6.73 13.07 25.90%
Motor & building transportation
0.89 1.84 4.21 8.30%
Special 1.02 2.51 6.93 13.70%
2015 Total 22.75 40.4 49.24 100.00%
Lighting & plug-in 12.92 21.73 29.2 59.30%
HVAC 4.4 6.57 12.96 26.30%
Motors & building transportation
0.88 1.74 3.73 7.60%
Special 0.35 1.44 3.35 6.80%
Table 1: The statistical information about annual EUI of office buildings in different 330
years 331
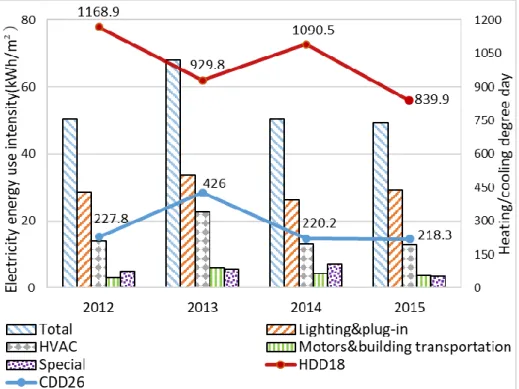
Based on the measured climate parameters from the China Meteorological Data 332
Service Center from 2012 to 2015(CMDC, 2017), the heating degree day (HDD) and 333
cooling degree day (CDD) of Chongqing are calculated based on 18ºC and 26ºC 334
respectively. The average EUIs of every sub-system, along with the HDD and CDD of 335
that year, are shown in Figure 7. From the figure, we can see that, on one hand, years 336
2012, 2014 and 2015 have quite comparable energy consumption in total EUI as well 337
as for every sub-system with similar CDDs regardless of the gap between their HDDs. 338
This indicates that office building energy consumption is not sensitive to HDD 339
variation. On the other hand, 2013 had a relatively higher total EUI. Apart from 340
higher lighting and plug-in EUI, HVAC EUI is higher due to the higher CDD in 2013. 341
The higher EUI of the lighting and plug-in contributes more internal heat gains which 342
further increase the cooling load. 343
344
Figure 7: Office building average EUIs and heating and cooling degree days in 345
different years 346
As indicated in Table 1, the median electricity EUIs of office buildings in Chongqing 347
range between 40.17 and 59.66kWh/m2. According to Liu et al. (2013), electricity 348
usage in office buildings accounts for 93.4% of total energy consumption. Adopting 349
this percentage, the building gross energy consumption will be its electricity 350
consumption divided by 0.934, as shown in Equation 3. Thus, the median gross EUI 351
for office buildings in Chongqing are between 43.01 and 63.88kWh/m2. 352
GD=D/0.934 (3) 353
Compared with the EUI benchmarks in other countries and regions of the world 354
(shown in 355
Countries Office building energy
benchmark (site energy)
Note
Canada
(ENERGY STAR, 2016b)
252.8 kWh/m2 (0.91GJ/m2)
National median total energy use intensity.
Hong Kong (EMSD, 2016)
279.2 kWh/m2 (1005 MJ/m2) Government Office.
Total energy use intensity (for reference only, not
representative energy
consumption levels). 132.2 kWh/m2
(476 MJ/m2)
Private Office with central air-conditioning.
43.1 kWh/m2 (155 MJ/m2)
Private Office without central air-conditioning.
(BCA, 2016) (GFA≥15,000m2) energy use intensity. 192.0 kWh/m2 (GFA <15,000m2) USA (ENERGY STAR, 2016c) 212.3 kWh/m2 (67.3kBtu/ft2)
National median total energy use intensity.
UK
(CIBSE, 2008)
95.0 kWh/m2
(weather adjustment
considered in benchmark, but not valid for office electricity consumption)
National median electricity energy use intensity.
Table 2), the EUI in Chongqing offices is much lower. The only exception is private 356
offices without central air-conditioning in Hong Kong, which have a slightly lower 357
EUI. But EMSD Hong Kong states clearly that the index given is not a representative 358
value and can only be used for reference. A majority of the benchmark data shown are 359
given by national median values, without taking into account climate variations. To 360
solve this problem, ASHRAE used a simulated representative building to extrapolate 361
the median EUI to different climate zones across the whole US by applying climate 362
zone ratios. The lower quartile value of energy use was derived and used as the 363
building energy consumption target (ASHRAE, 2015). According to the ASHRAE 364
climate zone classification, Chongqing is located in climate zone 3A, which is defined 365
as ‘warm humid’ (ASHRAE, 2013). The building energy consumption targets for US 366
office buildings in climate zone 3A are 163.93kWh/m2 (52kBtu/ft2) for government 367
offices, 132.40kWh/m2 (42kBtu/ft2) for professional offices, and 151.32kWh/m2 368
(48kBtu/ft2) for mixed-use offices (ASHRAE, 2015). This reveals that the median 369
gross EUI in Chongqing office buildings is even lower than the American energy 370
consumption target for office buildings. This is mainly because China has a wider 371
temperature range of indoor thermal comfort according to the Chinese building 372
thermal design standard compared to the developed countries (Li et al., 2014; Zhou et 373
al., 2017). A nationwide field study from Li et al. (2014) revealed that the indoor 374
temperature for public and residential buildings in south China where Chongqing 375
located varies between 5ºC to 35ºC. 376
Countries Office building energy
benchmark (site energy)
Note
Canada
(ENERGY STAR, 2016b)
252.8 kWh/m2 (0.91GJ/m2)
National median total energy use intensity.
Hong Kong (EMSD, 2016)
279.2 kWh/m2 (1005 MJ/m2) Government Office.
Total energy use intensity (for reference only, not
representative energy
consumption levels). 132.2 kWh/m2
(476 MJ/m2)
Private Office with central air-conditioning.
43.1 kWh/m2 (155 MJ/m2)
Private Office without central air-conditioning.
(BCA, 2016) (GFA≥15,000m2) energy use intensity. 192.0 kWh/m2 (GFA <15,000m2) USA (ENERGY STAR, 2016c) 212.3 kWh/m2 (67.3kBtu/ft2)
National median total energy use intensity.
UK
(CIBSE, 2008)
95.0 kWh/m2
(weather adjustment
considered in benchmark, but not valid for office electricity consumption)
National median electricity energy use intensity.
Table 2: Energy use intensity benchmarks in other countries or regions in the world 377
In the Chinese recommended Standard for Energy Consumption of Buildings GB/T 378
51161-2016 (MOHURD, 2016), the office-building energy-consumption benchmark 379
has been established for the Hot Summer and Cold Winter (HSCW) zone where 380
Chongqing is located. The benchmark includes two indices: a constraint indicator and 381
a recommended indicator. For building energy performance, their annual EUI should 382
not exceed the constraint indicator but attempt to achieve the recommended indicator. 383
The building type of office buildings has been further divided into the sub-stock Type 384
A and Type B based on the possibility of using natural ventilation to maintain a 385
comfortable indoor thermal environment. Buildings with no access to natural 386
ventilation and totally depending on mechanical ventilation as well as HVAC systems 387
for indoor temperature control are regarded as Type B, otherwise Type A. 388
The requirements in this standard for office buildings are listed in 389
Standard for Energy Consumption of Buildings GB/T 51161-2016 CPBECMP office building Building function Building type Constraint indicator kWh/m2 Recommended indicator kWh/m2 Year Mean gross EUI Government office buildings. Type A 70 55 2012 54.04 Type B 90 65 2013 72.76 General office buildings. Type A 85 70 2014 54.10 Type B 110 80 2015 52.72
Table 3; the constraint indicators as the mean values for Type A and B government 390
office buildings are 70 and 90kWh/m2 and 85 and 110kWh/m2 for general office 391
buildings, respectively. The mean gross EUI of office buildings in Chongqing is from 392
52.72 to 72.76kWh/m2. We conclude that the overall energy performance of office 393
buildings in Chongqing satisfies the Standard GB/T 51161-2016. The gross EUI of 394
72.76 kWh/m2 in 2013 is higher than that required in the Standard, but the CDD of 395
426 in 2013 was much higher than the reference CDD of 241(Chongqing Minicipal 396
Commission of Urnam-Rural Development, 2010). 397
Standard for Energy Consumption of Buildings GB/T 51161-2016 CPBECMP office building Building Building Constraint indicator Recommended indicator Year Mean gross
function type kWh/m2 kWh/m2 EUI Government office buildings. Type A 70 55 2012 54.04 Type B 90 65 2013 72.76 General office buildings. Type A 85 70 2014 54.10 Type B 110 80 2015 52.72
Table 3: The office-building energy-consumption benchmark indicators from GB/T 398
51161-2016 and the CPBECMP office building performance 399
5. Building energy performance distribution and rating
400
5.1.Normality test results
401
The Shapiro–Wilk test was applied to the natural logarithm of the total EUI of office 402
buildings for the four studied years using SPSS, and the results are presented in 403 Year p-value Mean value Standard deviation 2012 0.612 3.815 0.463 2013 0.393 4.013 0.676 2014 0.704 3.700 0.680 2015 0.521 3.668 0.683
Table 4. The annual total EUIs of Chongqing office buildings all passed the test 404
(p>0.05), which indicates that the normal distribution hypothesis can be accepted. 405 Year p-value Mean value Standard deviation
2012 0.612 3.815 0.463
2013 0.393 4.013 0.676
2014 0.704 3.700 0.680
2015 0.521 3.668 0.683
Table 4: Results of the of the Shapiro–Wilk tests 406
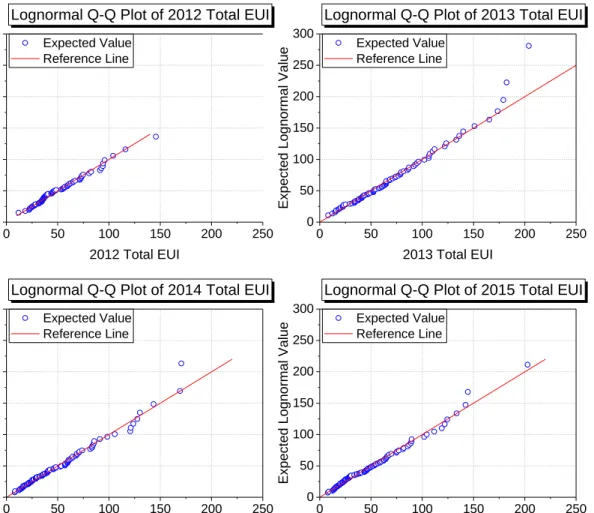
To further assess if the total EUI follows the lognormal distribution, the 407
quantile-quantile (q-q) graphical plot technique is used and plotted in Figure 8. A 408
45-degree reference line is also plotted as y=x. The X-Axis represents the observed 409
value of total EUI while the Y-axis represents the expected lognormal distribution 410
values at the same quantiles as x. From the findings, we can see that all the data points 411
fall approximately along the reference line for year 2012, 2014 and 2015, which 412
confirms that the office building EUI has the same distribution as the lognormal 413
distribution. For the year 2013, even though only one data point which is a bit far 414
away from the reference line, the vast majority of the data points are very close to 415
reference line. Therefore, 2013 total EUI data is lognormal distributed as well. 416
0 50 100 150 200 250 0 50 100 150 200 250 300
Lognormal Q-Q Plot of 2012 Total EUI
Expec te d Lo gn or ma l Value 2012 Total EUI Expected Value Reference Line 0 50 100 150 200 250 0 50 100 150 200 250 300
Lognormal Q-Q Plot of 2013 Total EUI
Expec te d Lo gn or ma l Value 2013 Total EUI Expected Value Reference Line 0 50 100 150 200 250 0 50 100 150 200 250 300
Lognormal Q-Q Plot of 2014 Total EUI
Expec te d Lo gn or ma l Value 2014 Total EUI Expected Value Reference Line 0 50 100 150 200 250 0 50 100 150 200 250 300
Lognormal Q-Q Plot of 2015 Total EUI
Expec te d Lo gn or ma l Value 2015 Total EUI Expected Value Reference Line 417
Figure 8: Lognormal Q-Q plots for office total EUI from 2012 to 2015 418
As the natural logarithm of the building EUIs has passed the normality test, the 419
building EUIs are proved to follow the lognormal distribution. The probability density 420
function and cumulative distribution function for lognormal distribution are shown in 421
Equations 4 and 5. 422
423
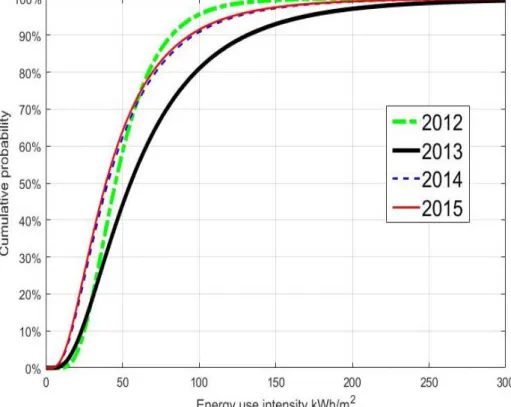
Knowing the lognormal distribution of the EUIs for office buildings for the four study 425
years, their cumulative probability curves for annual EUIs were drawn and presented 426
in Error! Reference source not found. using Equation 5 for the lognormal 427
distribution cumulative probability function. The cumulative distribution function 428
provides a way to calculate the exact EUI values at different cumulative probability 429
levels that are relatively independent of the EUIs of office building samples. 430
Furthermore, it is used to generate a building energy performance rating based on 431
monitored data for Chongqing office buildings in section 5.2. 432
Figure 9: The cumulative probability of annual EUI for office buildings in the four 433
years 434
5.2.Building energy-performance rating
435
The lower quartile value, median, and mean for the whole building as well as 436
sub-systems is shown in Table 1 and can act as benchmarking indices for the 437
evaluation of building energy performance and the performance of individual 438
sub-systems in office buildings in Chongqing. Moreover, based on the cumulative 439
probability function of the annual EUI for office buildings, the building 440
energy-performance rating uses a 1-100 scale established by the cumulative probability 441
level. Table 5 shows the rating scale for office buildings for different years. An energy 442
consumption rating of 90 indicates that, from an energy consumption standpoint, the 443
building performs better than 90% of buildings of the same type, while a rating of 10 444
indicates the building performs better than only 10% of office buildings in the stock. 445
The energy rating can be used as an indicator to diagnose the energy consumption of 446
an individual office building relative to the whole stock. Based on the average carbon 447
dioxide emission factor of 0.5257kgCO2/kWh for China's central region power grid 448
where the electricity supply for whole Chongqing city came from the reference 449
(NCSC, 2014), the carbon dioxide emission intensities corresponding to different 450
building energy performance rankings are presented in Table 5. 451
Energy performance
rating
EUI (kWh/m2) CO2 emission (kgCO2/m2)
2015 2014 2013 2012 2015 2014 2013 2012 90 16.33 16.92 23.26 25.07 8.58 8.89 12.23 13.18 80 22.05 22.82 31.31 30.73 11.59 12.00 16.46 16.15 70 27.38 28.32 38.80 35.59 14.39 14.89 20.40 18.71 60 32.95 34.05 46.61 40.35 17.32 17.90 24.50 21.21 50 39.17 40.45 55.31 45.38 20.59 21.26 29.08 23.86 40 46.57 48.05 65.65 51.02 24.48 25.26 34.51 26.82
30 56.05 57.78 78.85 57.85 29.47 30.37 41.45 30.41 20 69.60 71.69 97.70 67.00 36.59 37.69 51.36 35.22 10 94.00 96.68 131.54 82.13 49.42 50.82 69.15 43.18 Table 5: The annual EUI rating of office buildings and the corresponding CO2
452
emissions 453
6. The object-oriented EUI quota determination model
454
6.1 The model 455
According to the State Council of the People's Republic of China, for buildings 456
occupied by public authorities, EUI in 2020 should be 10% less than in 2015(SCC, 457
2016). As noted by Yang et al. (2016), applying a uniform EUI reduction rate was not 458
equitable to all the buildings, as the high-performance buildings were already 459
consuming less energy. It was therefore more difficult for such energy efficient 460
buildings to meet the targets, as they had little potential for further energy saving. A 461
reasonable energy reduction target should be set at the stock level as a total reduction 462
target. 463
Based on the lognormal distribution of total annual EUI, the expectation function of 464
lognormal distribution for calculating the mean EUI value of lognormal distribution is 465
shown on Equation 6. 466
467
If considering setting a mandatory objective maximum EUI (v) for all office buildings, 468
those with higher EUIs will be required to reduce to, or below, the EUI target. 469
Assuming all buildings with a lower total EUI are not changing their energy 470
consumption while all those with a higher total EUI are reducing to the target EUI 471
value, the updated mean EUI value of the building stock can then be calculated from 472
Equation 7. 473
474
With the aforementioned calculation formula for the mean EUI value of the base year 475
and the updated mean EUI value after the mandatory maximum target EUI being 476
applied, the stock total energy consumption can be calculated by multiplying the stock 477
mean EUI by the stock GFA. The energy-saving percentage by applying the target 478
EUI is measured by the energy consumption reduction divided by the stock energy 479
consumption for the base year, as shown in Equation 8. The stock GFA variation can 480
be modified by using the planned stock GFA increase rate r, with r = PSA / SA. This 481
planned stock GFA increase rate should come from the city-level office for stock 482
development planning. 483
485
The target EUI which meets the savings target of the energy consumption of the office 486
building stock can be calculated using Equation 8, which can be called the EUI quota 487
determination model. This model can be used to calculate the objective EUI value and 488
is helpful to local authority decision-makers in deciding the building energy quota 489
under a specific energy saving target issued by the government. It means that if the 490
EUI of an office building exceeds the objective EUI value, actions should be taken to 491
reduce energy consumption. With improved operational energy for the 492
poorly-performing buildings, the preset stock energy conservation target can be 493
achieved automatically. 494
A Matlab program had been coded for the object-oriented EUI quota determination 495
model based on Equation 8. To work out the office building EUI quota under a stock 496
energy-saving percentage goal, the required input information includes the mean 497
value, the standard deviation value of the natural logarithm of office building EUI, 498
and the planned increase in stock GFA. The mean and standard deviation values can 499 be found in 500 Year p-value Mean value Standard deviation 2012 0.612 3.815 0.463 2013 0.393 4.013 0.676 2014 0.704 3.700 0.680
2015 0.521 3.668 0.683
Table 4, while the energy-saving goal and the planned stock GFA increase rate should 501
be determined by the government and policy makers according to the general plan for 502
Chongqing. This model is an easy-to-use, object-oriented, building energy 503
benchmarking tool for local authority to evaluate office building performance. In 504
order to make the objective EUI quota achievable for the high energy consumption 505
buildings, building retrofitting strategies could be planned, including the improvement 506
of building envelope performance; the application of renewable technologies; the 507
improvement of the efficiency of energy systems; and intelligent operations and 508
energy management. Government subsidies should be considered for those high EUI 509
buildings with building retrofitting for the improvement of energy performance based 510
on the benchmarking provided. 511
6.2 Example of applying the model 512
According to THUBERC (2017), office building had already accounting for the 513
biggest portion in public building stock in China, the total floor area for office 514
building should be controlled for no further increase. So the planned office stock GFA 515
increase rate r is assumed to be 1, which indicated a constant office stock GFA. The 516
year 2015 was selected as the baseline year for building energy saving percentage 517
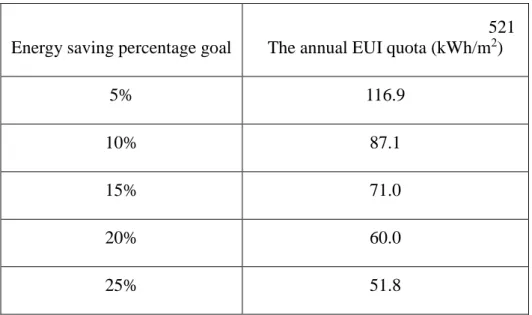
definition. TTable 6 lists some EUI quotas calculated using Equation 8 under different 518
stock energy-saving goals. 519
Table 6 the annual EUI quotas under different energy-saving percentage goal 520
521
As the building energy consumption quota being determined by the object-oriented 522
model, the energy performance of office buildings can be evaluated based on the 523
quota. Assuming the energy-saving goal for year 2017 is 10% reduction compared to 524
year 2015, the office EUI quota is 87.1 kWh/m2. If an office building operating total 525
EUI is over 87.1 kWh/m2 in 2015, retrofitting actions should be taken to improve 526
building energy efficiency. 527
Office building retrofit measures found in the literature(Dong et al., 2014; Guo et al., 528
2008; Liu et al., 2009; Yao et al., 2016b) including; 529
Improving building envelope insulation (roof, external wall, window, etc.) and 530
airtightness; 531
Improving the efficiency of indoor lighting systems and office utilization 532
equipment; 533
Improving HVAC facilities and system efficiency (boiler, chillier, air-condition 534
Energy saving percentage goal The annual EUI quota (kWh/m2)
5% 116.9
10% 87.1
15% 71.0
20% 60.0
unit, fan efficiency); 535
Improving building control systems (HVAC system control optimization, external 536
shading control, maximum daylight usage control, etc.); 537
Appling advanced energy-saving technologies (hybrid ventilation, night 538
ventilation, heat recovery); 539
Improving the building management services and raising users’ energy saving 540
conscious. 541
Office buildings having the same EUI value may have different intensity of energy 542
consumption due to its own energy consumption characteristics. There are no uniform 543
retrofit measures, so each building identified and being proposed to the retrofitting 544
plan should go through energy consumption diagnose and retrofit measure analysis 545
(including reliability analysis, operability analysis and economic analysis), to find the 546
optimum retrofit measure bundle. The Technical code for the retrofitting of public 547
building energy efficiency JGJ176-2009 (MOHURD, 2009) can be referenced to 548
guide the selection of energy conservation retrofit measure. 549
7. Conclusions
550
This paper presents the actual operational energy consumption data of office buildings 551
collected from the Chongqing public-building energy-consumption monitoring 552
platform (CPBECMP) between 2012 and 2015. An understanding of the energy 553
consumption profiles in office buildings in Chongqing was obtained. Statistical 554
analysis using Shapiro–Wilk normality tests was applied to identify the EUI 555
distributions, which is essential to the development of the office energy-performance 556
benchmark rating and object-oriented EUI quota determination model. In this study, 557
commonly-used, statistically-based indices for building energy consumption 558
benchmarking, including lower quartile value, median, and mean, and percentile 559
tables (from 10 to 90 percentiles) of building EUI have been presented for the office 560
building stock in Chongqing. The object-oriented EUI quota determination model has 561
also been developed. The building benchmark and object-oriented quota model are 562
practical tools for local authorities to evaluate building energy consumption and make 563
decisions on building energy retrofit. The method of establishing energy benchmarks 564
can be applied to any other building stock once the monitored energy consumption 565
data are available. 566
The key conclusions drawn from our study are as follows: 567
The median gross EUI for office building in Chongqing are from 43.01 to 568
63.88kWh/m2, which are much lower than that for developed countries. This is 569
mainly because China has a wider temperature range of indoor thermal 570
comfort according to the Chinese building thermal design standard compared 571
to the developed countries. This situation affects the electricity used for 572
heating and cooling; 573
The annual EUIs of office buildings follow lognormal distribution; therefore, 574
the energy-performance rating can be generated based on the cumulative 575
distribution function of lognormal distribution. The annual EUI rating can 576
identify the high energy consumption buildings; 577
The object-oriented EUI quota determination model can perform projected 578
energy-saving target analysis that will be useful to the local authorities, 579
including utility service providers, to determine which building need to go 580
through energy conservation retrofit process to meet the stock 581
carbon-reduction target. Government subsidies, as well as policies involving 582
economic and administrative penalties, should be carefully considered and 583
operated to activate the object-oriented EUI quota in building management; 584
The application of the annual EUI rating and object-oriented EUI quota can 585
contribute greatly to carbon reduction and sustainable built-environment 586
development by proving scientifically sound benchmarks to evaluate 587
Chongqing office-building operational performance. 588
This research focused on the office buildings in Chongqing, but the statistical 589
analysis and object-oriented EUI quota determination model construction 590
process can be easily adapted to different building stocks in other cities based 591
on the collected energy consumption data. 592
We recommend the Energy Certificate Display mechanism for office buildings 593
in China as well as open access to the database of public buildings. 594
This study also suggests ideas for future research into the roles of thermal 595
management and energy efficiency in the built environment and their effect on electric 596
utilities and capacity needs, particularly in regions with hot summers and cold winters. 597
Improving building performance could help relieve heating and cooling electricity 598
peak loads. Further studies could focus on how electricity utilities are adapting to the 599
impact of the diversity of thermal comfort demand on electricity consumption in 600 China. 601 602 Acknowledgement 603
This work was supported by the Natural Science Foundation of China [grant numbers 604
NSFC 51561135002]; the UK Engineering and Physical Sciences Research Council 605
[grant number EPSRC EP/N009797/1]; and the China Scholarship Council [grant 606 number 201506050035]. 607 608 References 609
ASHRAE, 2013. ANSI/ASHRAE Standard 169-2013, Climatic Data for Building 610
Design Standards. ASHRAE, Atlanta. 611
ASHRAE, 2015. Standard 100-2015, Energy Efficiency in Existing Buildings. 612
ASHRAE, Atlanta. 613
ASHRAE. Building energy quotient: In Operation Assessment. 2016;
614
http://buildingenergyquotient.org/inoperation.html (Accessed 2016.07.23) 615
BBSR. Energy Saving Ordinance (EnEV). 2013;
616
http://www.bbsr-energieeinsparung.de/EnEVPortal/EN/EnEV/enev_node.html 617
(Accessed 2017.5.14) 618
BCA, 2016. BCA Building Energy Benchmarking Report 2016. Building and 619
Construction Authority, Singapore. 620
BCA. Existing Building Legislation. 2017;
621
https://www.bca.gov.sg/EnvSusLegislation/Existing_Building_Legislation.html 622
(Accessed 2017.04.27) 623
Best Practice Programme, 2000. Energy Consumption Guide 19. Energy Use in 624
Office. 625
Boyano, A., Hernandez, P., Wolf, O., 2013. Energy demands and potential savings in 626
European office buildings: Case studies based on EnergyPlus simulations. Energy and 627
Buildings 65, 19-28. 628
BPIE, 2014. Energy performance certificates across the EU. 629
Burman, E., Mumovic, D., Kimpian, J., 2014. Towards measurement and verification 630
of energy performance under the framework of the European directive for energy 631
performance of buildings. Energy 77, 153-163. 632
Burman, E., Rigamonti, D., Kimpain, J., Mumovic, D., 2012. Performance gap and 633
thermal modelling: a comparison of simulation results and actual energy performance 634
for an academy in north west England, First Building Simulation and Optimization 635
Conference, Loughborough, UK. 636
CABR, 2011. The Development of building energy performance benchmarking tools 637
in China. China Academy of Building Research. 638
Cheng, Y., Huang, L., Yue, Z.-R., Sheng, J.-X., 2013. Study on Energy-Efficient 639
Retrofit of Public Buildings in Ningbo City, 2013 Fourth International Conference on 640
Digital Manufacturing and Automation, pp. 1268-1271. 641
Chongqing Minicipal Commission of Urnam-Rural Development, 2010. Design 642
standard for energy efficiency 50% of residential building DBJ50-102-2010. 643
Chung, W., Hui, Y.V., Lam, Y.M., 2006. Benchmarking the energy efficiency of 644
commercial buildings. Applied Energy 83, 1-14. 645
CIBSE, 2008. TM46 Energy benchmarks. The Chartered Institution of Building 646
Services Engineers. 647
CIBSE, 2012. CIBSE Guide F: Energy efficiency in buildings. The Chartered 648
Institution of Building Services Engineering. 649
CMDC, 2017. China Ground International Exchange Station Climate Data Daily 650
Datasets (V3.0), in: Center, C.M.D.S. (Ed.), 3.0 ed. 651
de Wilde, P., 2014. The gap between predicted and measured energy performance of 652
buildings: A framework for investigation. Automation in Construction 41, 40-49. 653
DECC. Building Energy Efficiency Survey (BEES). 2013a;
654
https://www.gov.uk/government/collections/non-domestic-buildings-energy-use-proje 655
ct (Accessed 2016.07.20) 656
DECC. National Energy Efficiency Data-Framework (NEED). 2013b;
657
https://www.gov.uk/government/collections/national-energy-efficiency-data-need-fra 658
mework (Accessed 2016.07.20) 659
Department of Climate Change, 2015. Enhanced actions of climate change: China's 660
intended nationally determined contributions. National Development & Reform 661
Commission of China. 662
Ding, H., Liu, H., Wang, L., 2009. Preliminary analysis of the energy statistics in civil 663
buildings. HV&AC 39, 1-3. 664
DOE. Building energy use benchmark. 2016;
665
http://energy.gov/eere/slsc/building-energy-use-benchmarking (Accessed 2016.07.18) 666
Dong, M., He, D., Liao, X., 2014. Energy efficiency reformation measures and actual 667
performance of an existing office bui lding in Chongqing. Heating Ventilating & Air 668
Conditioning, 65-69. 669
EIA. Commercial building energy consumption survey(CBECS). 2015;
670
http://www.eia.gov/consumption/commercial/about.cfm (Accessed 2015.12.25) 671
EMSD. Commercial - Energy Utilization Index. 2016;
672
http://ecib.emsd.gov.hk/en/indicator_cmc.htm (Accessed 2016.10.16) 673
ENERGY STAR. Benchmark energy use: Learn about benchmarking. 2016a; 674
https://www.energystar.gov/buildings/about-us/how-can-we-help-you/benchmark-ener 675
gy-use/benchmarking (Accessed 2016.07.18) 676
ENERGY STAR. Canadian Energy Use Intensity by Property Type. 2016b; 677
https://portfoliomanager.energystar.gov/pdf/reference/Canadian%20National%20Med 678
ian%20Table.pdf (Accessed 2016.07.18) 679
ENERGY STAR. U.S. Energy Use Intensity by Property Type 2016c; 680
https://portfoliomanager.energystar.gov/pdf/reference/US%20National%20Median%2 681
0Table.pdf (Accessed 2016.07.18) 682
EU, 2010. Directive 2010/31/EU of the European Parliament and of the Council of 19 683
May 2010 on the energy performance of buildings (recast). Official Journal of the 684
European Union, 13-35. 685
Gao, Y., Xu, J., Yang, S., Tang, X., Zhou, Q., Ge, J., Xu, T., Levinson, R., 2014. Cool 686
roofs in China: Policy review, building simulations, and proof-of-concept experiments. 687
Energy Policy 74, 190-214. 688
Ghasemi, A., Zahediasl, S., 2012. Normality Tests for Statistical Analysis: A Guide for 689
Non-Statisticians. International Journal of Endocrinology and Metabolism 10, 690
486-489. 691
Guo, H., Zheng, J., Sun, J., 2008. Research on Energy Efficiency of Office Buildings 692
in Chongqing. Building Energy Efficiency 36, 5-8. 693
IEA, 2016. Key world energy statistics. 694
Li, B., Yao, R., Wang, Q., Pan, Y., 2014. An introduction to the Chinese Evaluation 695
Standard for the indoor thermal environment. Energy and Buildings 82, 27-36. 696
Li, X., Li, Q., Li, B., Yao, R., 2016. An Investigation on Energy Consumption of 697
Public Buildings in Chongqing, China, in: Heiselberg, P.K. (Ed.), CLIMA 2016 - 698
proceedings of the 12th REHVA World Congress, Aalborg: Aalborg University, 699
Department of Civil Engineering. 700
Liang, J., Li, B., Wu, Y., Yao, R., 2007. An investigation of the existing situation and 701
trends in building energy efficiency management in China. Energy and Buildings 39, 702
1098-1106. 703
Limpert, E., Stahel, W.A., Abbt, M., 2001. Log-normal Distributions across the 704
Sciences: Keys and Clues. BioScience 51, 341-352. 705
Liu, H., Ding, H., Zeng, D., 2013. Civil building energy statistical data analysis report 706
2012. Construction Science and Technology 18, 34-37,39. 707
Liu, L., Zhou, J., Li, Z.-m., 2009. Energy Consumption Features for Public Office 708
Buildings in Yuzhong District of Chongqing. Construction Energy Conservation 37, 709
71-73. 710
Ma, H.T., Du, N., Yu, S.J., Lu, W.Q., Zhang, Z.Y., Deng, N., Li, C., 2017. Analysis of 711
typical public building energy consumption in northern China. Energy and Buildings 712
136, 139-150. 713
Menezes, A.C., Cripps, A., Bouchlaghem, D., Buswell, R., 2012. Predicted vs. actual 714
energy performance of non-domestic buildings: Using post-occupancy evaluation data 715
to reduce the performance gap. Applied Energy 97, 355-364. 716
MOHURD, 2009. Technical code for the retrofitting of public building on energy 717
efficiency JGJ176-2009. 718
MOHURD, 2014. Report of Chinese Building Energy Efficiency
719
Development-Existing Building Retrofit. 2014. China Architecture & Building Press, 720
Beijing. 721
MOHURD, 2015a. Design standard for energy efficiency of public buildings 722
GB50189-2015. Ministry of Housing and Urban-Rural Development, People's 723
Republic of China. 724
MOHURD, 2015b. Statistical Report System for Energy Consumption of Civil 725
Buildings. 726
MOHURD, 2016. Standard for Energy Consumption of Buildings GB/T 51161-2016. 727
Ministry of Housing and Urban-Rural Development. 728
MOHURD. Building Energy Conservation and Green Building Development 13th 729 Five-Year Plan. 2017; 730 http://www.mohurd.gov.cn/wjfb/201703/t20170314_230978.html (Accessed 731 2017.3.23) 732
NABERS. NABERS National Australian Built Environment Rating System. 2017; 733
https://nabers.gov.au/public/WebPages/ContentStandard.aspx?module=0&template=3 734
&include=homeIntro.htm (Accessed 2017.5.13) 735
NABERSNZ. About NABERSNZ. 2017;