*Corresponding author.
E-mail addresses: [email protected] (A. Ghodrati) © 2013 Growing Science Ltd. All rights reserved.
doi: 10.5267/j.msl.2013.06.022
Contents lists available at GrowingScience
Management Science Letters
homepage: www.GrowingScience.com/msl
ATM cash management using genetic algorithm
Ahmadreza Ghodratia*, Hassan Abyakb and Abdorreza Sharifihosseinic
aDepartment of Civil Engineering, Arak University, Arak, Iran
bDepartment of Accounting, Kashan branch, Islamic Azad University, Kashan, Iran cDepartment of Management, Electronic branch, Islamic Azad University, Tehran, Iran C H R O N I C L E A B S T R A C T
Article history:
Received January 18, 2013 Received in revised format 8 June 2013
Accepted 10 June 2013 Available online June 15 2013
Automatic teller machine (ATM) is one of the most popular banking facilities to do daily financial transactions. People use ATM services to pay bills, transfer funds and withdraw cash. Therefore, we can treat ATM as a tradition inventory problem and use simulation technique to analysis the amount of cash required on different occasions such as regular days, holidays, etc. The proposed model of this paper uses genetic algorithm to determine the replenishment cash strategy for each ATM. The survey uses all transactions accomplished during the fiscal years of 2011-2012 on one of Iranian banks named Ayande. The study categorizes various ATM based on the average daily transactions into three groups of low, medium and high levels. The preliminary results of our survey indicate that it is possible to do setup different strategies to manage cash in various banks, optimally.
© 2013 Growing Science Ltd. All rights reserved. Keywords: Banking industry Cash management ATM Inventory management 1. Introduction
For years, automatic teller machine (ATM), as a computerized telecommunications device, has helped banking industry perform financial transactions without the need for a cashier, human clerk or bank teller. Bank customers are able to do their regular transactions such as bill payment, transfer funds and cash request without worrying about banks’ working days, business hours, etc. (ATMmarketplace.com, 2010) One of the primary concerns with ATM management is to determine the efficient level of cash inventory in each machine and there are different techniques offered to handle this problem. Adendorff (2000) presented a scientifically-based decision-making procedure to determine the amount of cash to be held at a cash point of a retail bank at any time without compromising customer service levels or incurring undue expenditure. Armenise et al. (2010) presented an application of genetic algorithms (GA) as metaheuristics for searching and generating optimal upload strategies, able at the same time to minimize the daily amount of stocked money and to assure cash dispensing service.
Detecting the optimal cash deployment strategy for a network of ATMs is associated with the analysis of logistics expenditures, inventory policies as well as of the routing of replenishment vehicles. The optimal cash deployment strategy concentrates on the reduction of cash based expenditures to guarantee that ATMs would not run out of cash. Kurdel and Sebestyénová (2012) the vehicle routing problem is analyzed by GA. They considered the periodic vehicle routing problem (Savelsbergh & Sol, 1998; Toth & Vigo, 1987; Song & Zipkin, 1993) as a problem of generating a group of different routes for each day of a planning horizon such that the constraints involved are satisfied and the global expenditures are minimized. Their model could specify cases with requirements of two replenishments of some of the customers (ATMs) daily while other customers may require only one replenishing in two days.
There also other forecasting techniques, which could be used for predicting cash inventory of ATMs. Simutis et al. (2008), for instance, developed two various techniques to forecast the daily cash demand for ATM. The first method was based on flexible artificial neural network (ANN) and they tried to improve the generalization properties of ANN based on special adaptive regularization term. The second forecasting technique employed the support vector regression (SPR) method and compared the results with simulation techniques.
Simutis et al. (2007), in other work, used ANN to forecast a daily cash demand for every ATM in the network and on the optimization procedure to forecast the optimal cash load for every ATM. They explained that cost of cash, cost of cash uploading and cost of daily services could play essential role on cash management and considered them in their model and used simulation technique to analyze the results. They stated that in case of higher cost of cash (interest rate) and lower cost for money uploading, the optimization procedure could decrease the ATMs maintenance expenditure around 15-20 %.
Snellman and Viren (2009) performed an investigation to find out how the market structure in banking could influence the choice of the means of payment and the demand for cash was analyzed from this point of view. The work was based on a simple spatial transactions model in which banks’ optimization problem was investigated. They reported that monopoly banks had an incentive to restrict the number of ATMs to a minimum.
According to Teddy and Ng (2011), predicting cash demands at ATMs is challenging, due to the heteroskedastic nature of such time series and traditional global learning computational intelligence (CI) models, with their generalized learning behaviors, could not capture the complex dynamics and time-varying characteristics of such real-life time series data efficiently. They proposed to implement a local learning technique of the pseudo self-evolving cerebellar model articulation controller (PSECMAC) associative memory network to generate accurate predictions of ATM cash demands. As a computational model of the human cerebellum, the model could incorporate local learning to model the complex dynamics of heteroskedastic time series, effectively. They evaluated the predicting performance of their PSECMAC model against the performances of current established CI and regression models using the NN5 competition dataset of 111 empirical daily ATM cash withdrawal series. Vasumathi and Dhanavanthan (2010) used simulated method to reduce idle time of servers and waiting time of customers for any bank having ATM facility. Finally, Wagner (2007) determined the optimal cash deployment strategy-modeling a network of automated teller machines.
2. The proposed model
The proposed model of this paper uses genetic algorithm to determine the replenishment cash strategy for each ATM. The survey uses all transactions accomplished during the fiscal years of 2011-2012 on one of Iranian banks named Ayande. The study categorizes various ATM based on the average daily transactions into three groups of low, medium and high levels and data processing procedures are as follows:
To describe the data, skewedness and kurtosis coefficients, mean, median and standard deviation have been used. In addition, to optimize the results, we used the Genetic simulation algorithm. In this simulation algorithm, fitness function is minimization of cash inventory ATM. Then we used descriptive statistical procedures for result analysis. The proposed study uses a method originally developed by Armenise et al. (2010) for GA implementation as well as simulation procedure.
2.1. The first stage
In this stage, we use simulation algorithm for definition strategy cash management associated with each ATM based on its place situation and type of performance day. Each rule or cash strategy management is structured as a conjunction of given conditions, entailing are charge level. For example, a possible rule is stated as Eq. (1) as follows,
IF P1(aq,t)= c1,h AND ... AND pn(aq,t)= cn,kTHEN RECHARGE lm, (1)
In Eq. (1), the condition specifies when the ATM aq at time t meets conditions P1(aq,t)= c1,h,
p2(aq,t)= c2,k and pn(aq,t)= cn,k, then aq is recharged of cash lm. Each condition represents one possible
value predicate p can assume when applied to a specific ATM and date. Examples are “Summer
holiday”, “Workday”, “Day before a festivity”, “Low amount of money in ATM”, etc., while examples of recharge levels are “Upload at maximum”, “Upload your ATM of x euros”, etc. Formally, we explain Eq. (2) as follows,
Pi: AT M × D → Ci, (2)
where ATM is the set of possible ATMs, D the set of dates, and Ci is the set of possible outcomes of
Pi. Therefore, given a set of predicates, rule specifications belong to the space given by Eq. (3).
R ≡ C1 × C2 × ... × Cn × L, (3)
where L is the set of possible recharge levels and A rule set is specified by K ⊆ R. We aim to find the
subset of K that when applied to a single ATM or to group of them, minimizes the daily average
exceeding stock (S) within the time interval t0 ...T , that is w.r.t. ATM aq is defined as Eq. (4),
q, 0 q ∑ … L aq, τ D aq, τ (4)
where date t ∈ t0..T , s0(aq) is the initial stock, l(aq,τ ) ∈ L is the recharge applied at date τ if any,
d(aq,τ) is cash withdrawn at date τ. In particular, the level of recharge l is determined by applying the
rule set specified by K. If no rule can be applied to aq at time τ, then l(aq,τ)=0 and no recharge is
applied. Stock S should never exceed the maximum load capacity of ATM aq. In order to prevent this
case, the quantity l(aq,τ) is trimmed so that maximum capacity is never exceeded. In addition, S
should never go below 0, as this case entail out of-service of aq. We model this latter case by
considering a contingency rule. This rule, states that if cash run out, a given extra refill (e.g. 50% of maximum load) is provided so that ATM can continue operations. Therefore the daily balance in Eq.(4) becomes Eq. (5) as follows,
, , (5)
Assuming f extra recharges lc at date τ. Given a subset A ⊆ ATM the overall average daily stock
w.r.t. a rule set K is defined as Eq. (6) as follows,
SK (t)=∑ ∈ S aq, t (6)
Since we are interested to minimize the stock along the whole period of interest, the goal is to minimize S(T), and problem can be stated as Eq. (7) as follows,
K = arg min SK (T)
K⊆R
Based on Eq. (7), we can define our summarized genetic algorithm as follows, 1) Generate a population of random specification
2) Repeat
3) Evaluate fitness of each specification 4) Select specification for reproduction 5) Cross specification selected
6) Mutate some specification 7) Until max gen generations
In the second stage of simulation, we use strategy cash management for each ATM category. All of the Bank ATMs are divided into three categories based on their daily cash withdraw transactions. We use medium cash withdraw parameter of each ATM for categorization. Then we use simulation algorithm mentioned on the first stage. However, in this stage of simulation each strategy cash management defined for each of the ATM category. The optimization process performed for each ATM on each run of simulation on the first stage. However, optimization process is accomplished one time for all of ATMs.
3. The results
As we said before, we selected all of bank’s ATMs transactions as statistical population. These transactions are associated with ATM performance historical data over the period 2011-2012. These transactions were about customers’ cash withdrawal. In this section, we describe our variable with statistical parameters. Then we explain genetic optimization results. At the end of this section, we investigated balance point between capital (holding) and replenishment costs.
3.1. Description Results
In this survey, there were approximately 200 ATMS and some of the newest ones did not perform any transaction leaving us to have 164 active ATMs. These ATMs were accomplished on various cities in Iran. Nearly 40% of these ATMs belonged to the Amanda Bank Branches ATM .Other ATMs were out of Branches on the big stores or other places. Our basic variable was ATMs cash withdraw transaction for each day. The distribution of this variable is summarised as Table 1.
Table 1
Daily cash withdraw ATMs distribution
Row
Category Frequency Fraction Cumulative
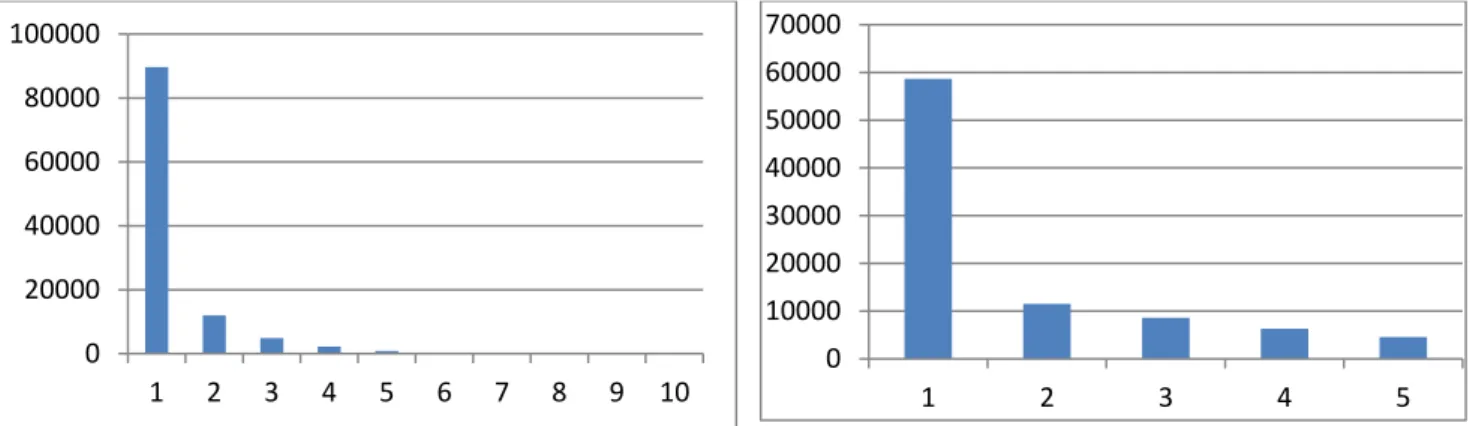
1 0-22.27 89679 0.81 0.81 2 22.27-44.53 11979 0.11 0.92 3 44.53-66.80 4864 0.04 0.97 4 66.80-89.07 2206 0.02 0.99 5 89.07-111.33 844 0.01 1.00 6 111.33-133.60 309 0.00 1.00 7 133.60-155.87 114 0.00 1.00 8 155.87-178.14 37 0.00 1.00 9 178.14-200.4 10 0.00 1.00 10 200.4-222.67 0.002 1.00 ---- total 110044 1.00 ----
Based on Table 1 cash withdraw (million monitory unit) divided by ten categories. In this table cash withdrawals were categorized based on the day-ATM number, relative portion and cumulative relative frequency. Based on this Table 1, 81% of cash withdrawals were between zero and 23 million monitory unit. The distribution of cash withdrawals are described in Fig. 1 as follows,
Fig. 1. Daily cash withdraw ATMs distribution Fig. 2. ATMs Daily Cash Withdraw Distribution
If we divide the first category cash ATMs withdrawal into sub categorizes, the new categories are summarized in Table 2 as follows,
Table 2
ATMs Daily Cash Withdraw Distribution Row Category Frequency Fraction Cumulative 1 0-4.45 58685 0.65 0.65 2 4.45-8.91 11518 0.13 0.78 3 8.91-13.36 8617 0.10 0.88 4 13.36-17.81 6298 0.07 0.95 5 17.81-22.27 4561 0.05 1.00 ----total 89679 1.00 ----
Based on Table 2 cash withdrawals, million monetary units, of the Table 1 first category are divided into five sub categories and they are demonstrated in Fig. 2. Based on the results of Table 1 and Table 2, half of the ATM cash withdrawals are placed in the first category. Therefore, cash withdraw is not normal. We calculated statistical parameters for daily cash withdrawal and they are summarized in Table 3 as follows.
Table 3
ATMs Daily Cash Withdraw Parameters
ATM
Minimum Maximum Mean S.D Skewedness Kurtosis Upper
2 4 102360 29009 17938 0.756 0.583 82823 3 110 151631 46954 28566 0.669 0.062 132651 4 80 77362 22108 15480 0.955 0.283 68547 5 30 57901 18232 13752 0.786 -0.266 59488 ….. …. ….. ….. …… …… ….. …… 1006 165206 2452 2853 1.782 3.518 11010
Based on the results of Table 3, we have decided to eliminate 158 rows of information.
3.2. Simulation Results
We used genetic algorithm for two optimization stages based on three different categories such as working hours or normal day, weekend and holiday. The optimal result summarized on Table 4.
Table 4
The Optimal Simulation Results for Each ATM
ATM a b S0c max Mean(Si) Empty maxP Empty D
2 20 20 5 29 113 43 0.13 0.00 77 3 15 60 30 47 167 74 0.17 0.05 102 4 15 10 10 22 85 38 0.17 0.13 99 … …. …. …. …. ….. ….. …… ….. …. 1006 5 5 5 2 18 17 0.01 0.74 3 0 20000 40000 60000 80000 100000 1 2 3 4 5 6 7 8 9 10 0 10000 20000 30000 40000 50000 60000 70000 1 2 3 4 5
We have decided to eliminate some of the unnecessary rows of Table 4, which belonged to other banks. The cash workday strategies for each ATM are categorized is Table 5 as follows,
Table 5
The Optimal Simulation Results for Each ATM
Row
Cash Strategy ATM No. Portion Cum. Portion
1 0-20 145 0.88 0.88 2 20-40 14 0.09 0.97 3 40-60 4 0.02 0.99 4 60-80 0 0.990 5 80-100 1 0.01 1 Total 164 ----1
Based on the results of Table 5, cash strategies (million-monetary unit) are divided into five categories and their frequencies have been determined. We describe this cash strategies distribution in
Fig. 3 as follows.
Fig. 3. ATMs Daily Cash Strategies Distribution
At this stage, the strategy cash management was calculated for each of these three categories. Then, these strategies have been related to three different ATM categories (ATMs with low medium and high daily cash withdraw). The optimal results are summarized in Table 6 as follows,
Table 6
The Optimal Simulation Results for Each ATM
ATM a b S0c max Mean(Si) Empty maxP Empty D
2 0 0 45 75 150 115 0.01 0.22 1 3 0 0 45 75 150 52 0.29 0.00 28 4 0 0 45 75 150 130 0.01 0.37 1 5 0 25 0 50 100 44 0.08 0.02 8 …. … … … … …. …. …. …. 1 1006 5 0 0 25 50 25 1.00 0.00 1 145 14 4 0 1 0 20 40 60 80 100 120 140 160 1 2 3 4 5
Based on the results of Table 6, three strategies cash management were 5, 25 and 45.We eliminated 159 rows of this table that were related to other ATMs.
3.3. Sensitivity Analysis
In this section, we present some of the necessary computations associated with sensitivity analysis of the results. The sensitivity analysis has been accomplished based on changes related to simulation days number, influential empty day coefficient and others parameters. Our result showed that, optimum influential empty day coefficient was 3 and the recent historical data provide better results than all of the historical data.
3.4. Cost Analysis
We used the Genetic Optimization Algorithm based on the daily ATMs cash withdraw and mean of cash daily inventory for each ATM .Then we used cost and benefit analysis for the final of cash management strategy making . For this analysis, we calculated the break-even point for cash strategy. At this point two costs of cash
charge and interest rate for cash inventory are equals. Based on this analysis cash strategies cash management were reformed. Then the optimum cash strategy for the branch’s ATM was daily and for other ATM was 3 days.
4. Conclusion
The ATMs were using increasingly on Iran. One of the most important problems for ATMs Bank managers is daily cash charge for each ATM. We have evaluated the optimum cash strategy for one of newly established Iranian banks called “Ayandeh Bank of Iran”. We gathered historical data about the all of this bank ATMs. The proposed study of this paper has implemented genetic simulation algorithm for optimization. This algorithm was used in two stages. During the first stage, we have determined cash strategy for each ATM based on workday, holiday and weekend. During the second stage, we have divided all of the ATMs to three category based on their daily cash withdraw. Since the daily cash withdraw distribution was not normal, we categorized all of ATMs based on the daily medium cash withdraw. Then, we have calculated strategy cash management for each category with Genetic Algorithm. Then we have used sensitivity analysis for simulation results. This analysis was accomplished based on different influential coefficients. On the final analysis, we have calculated the break-even point based on the cost analysis. Based on this analysis we opposed to the banks managers that they select one and three days a time for their ATMs cash charges.
References
Adendorff, S. A. (2000). A decision support model for the cash replenishment process in South African retail banking. Ph.D. Thesis, University of Pretoria, Department of Industrial Engineering. Armenise, R., Birtolo, C., Sangianantoni, E., & Troiano, L. (2010). A generative solution for ATM
cash management. In Soft Computing and Pattern Recognition (SoCPaR), 2010 International
Conference of (pp. 349-356). IEEE.
ATMmarketplace.com (2010). ATM software trends and analysis, NetWorld Alliance, Tech. Rep. Kurdel, P., & Sebestyénová, J. (2012). Modeling and optimization of ATM cash replenishment.
Proceeding of conference in Latest Trends in Information Technology, Vienna, 322-327.
Savelsbergh, M., & Sol, M. (1998). DRIVE: Dynamic routing of independent vehicles. Operations
Research, 46(4), 474-490.
Simutis, R., Dilijonas, D., Bastina, L., Friman, J., & Drobinov, P. (2007). Optimization of cash management for ATM network. Information technology and control, 36(1A), 117-121.
Simutis, R., Dilijonas, D., & Bastina, L. (2008). Cash demand forecasting for ATM using neural networks and support vector regression algorithms. In 20th EURO Mini Conference, Vilnius (pp. 416-421).
Snellman, H., & Viren, M. (2009). ATM networks and cash usage. Applied Financial
Economics, 19(10), 841-851.
Song, J. S., & Zipkin, P. (1993). Inventory control in a fluctuating demand environment. Operations
Research, 41(2), 351-370.
Teddy, S. D., & Ng, S. K. (2011). Forecasting ATM cash demands using a local learning model of cerebellar associative memory network. International Journal of Forecasting, 27(3), 760-776. Toth, P., & Vigo, D. (Eds.). (1987). The vehicle routing problem (Vol. 9). Society for Industrial and
Applied Mathematics.
Vasumathi, A., & Dhanavanthan, P. (2010). Application of simulation technique in queuing model for ATM facility. International Journal of Applied Engineering Research, Dindigul, 1(3), 469-482.
Wagner, M. (2007). The optimal cash deployment strategy-modeling a network of automated teller machines. Swedish School of Economics and Business Administration, Master of Science Thesis.