Annual Report
2015
on the Farm Credit System by the
FARM CREDIT ADMINISTRATION
Farm Credit Administration
5
Overview and mission 5
The Board 5
Farm Credit System—Role, Structure, and Safety and Soundness
9
FCS role 9
FCS structure 9
The safety and soundness of the FCS 11
FCS Banks and Associations
12
Financial condition 12
Borrowers served 20
System funding for other lenders 22
Farm debt and market shares 24
Serving Young, Beginning, and Small Farmers and Ranchers
26
Characteristics of YBS producers 26
FCS lending to YBS borrowers 26
YBS programs 32
Regulatory Policy and Approvals
35
Regulatory activity in 2015 35
Corporate activity in 2015 37
Funding activity in 2015 39
Maintaining a Dependable Source of Credit for Farmers and Ranchers
41
Conducting a risk-based examination and oversight program 41
Identifying and responding to potential threats to safety and soundness 41
Measuring the system’s safety and soundness 42
Providing differential supervision and enforcement 44
Protecting borrower rights 44
Condition of Farmer Mac
45
Capital 46
Program activity 47
Asset quality 48
Earnings 48
Challenges Facing the Agricultural Economy and the Farm Credit System
50
The farm economy 50
The general economy 56
Farm Credit System portfolio 61
Appendix
62
Farm Credit Administration offices 63
Agency officials 65
Glossary 70
Acronyms and abbreviations 73
Additional information 74
Photo credits: Bachrach (Board member photos) and Mattox Photography (agency official photos). All other photos taken by Linda Toki, Kevin Kramp, or selected from commercial stock. Layout and design by Linda Toki.
Statement of the Board Chairman and CEO
June 2016 Dear Reader,
On behalf of the board and the staff of the Farm Credit Administration, I present the 2015 Annual Report on the Farm Credit System. I am pleased to report that the System’s overall condition and performance remain sound. Its net income was $4.69 billion in 2015, down slightly from $4.72 billion in 2014, and its capital position is strong. Overall, the quality of System loans remains high. As of December 31, 2015, 0.69 percent of the System’s gross loans outstanding were nonperforming. This was a slight improvement over the prior year, when nonperforming loans accounted for 0.80 percent at year-end.
However, credit quality is expected to decline in 2016 because large supplies of corn and soybeans are pushing prices down for farmers. The decline in commodity prices in turn is pushing prices down for farmland, which serves as collateral for many System loans.
Another factor that may affect the System’s asset quality is the high U.S. dollar, which makes it hard for U.S. prod-ucts to compete with the prodprod-ucts of other agricultural exporters. In addition, slower growth in the economies of some of our biggest trading partners, such as China, may further reduce export sales.
We expect that the System will withstand these challenges in 2016 for several reasons. First, the underwriting standards of System institutions were prudent during the recent rapid increase in farmland values. Also, until 2014, farmers had several years of record farm income, and many used these gains to pay down debt.
The System’s strong capital levels also safeguard the System from credit quality declines. As of December 31, 2015, the System’s total capital had increased to $48.8 billion, up from $45.7 billion a year earlier.
Because the System obtains its loan funds from the securities it sells to the debt capital markets, investor demand for System securities is also key to the System’s ability to withstand these challenges. In 2015, Systemwide debt increased by 8.0 percent, and we expect investor demand for System securities to remain strong in 2016. The Farm Credit Insurance Fund, which held just over $4 billion at year-end 2015, further strengthens the financial position of the System by protecting investors in Systemwide debt, thus strengthening investor confidence in the System. This report also contains our annual report on the System’s service to young, beginning, and small (YBS) farmers and ranchers. In 2015, the number of new loans made and the dollar volume of new loans made rose for each YBS category. The number and dollar volume of loans outstanding also rose in every category. The growth in outstand-ing loan volume for beginnoutstand-ing and small farmers exceeded the growth in the System’s overall farm lendoutstand-ing, while the growth in outstanding loan volume for young farmers lagged slightly behind the growth in the System’s over-all farm lending.
As the arm’s-length regulator of the System, we examine System institutions for their safety and soundness and their compliance with laws and regulations, providing heightened oversight of institutions with higher risk. In addition to the areas normally considered, our examiners are currently emphasizing internal controls and operations risk, and they are monitoring the growth in credit risk.
I am pleased to report that, after publishing a proposed capital rule in September 2014, the agency issued a final rule in early 2016 that made extensive revisions to the agency’s capital regulations. The rule modernizes our capi-tal requirements while ensuring that System institutions continue to hold enough regulatory capicapi-tal to fulfill their mission. It ensures that the System’s capital requirements are appropriate for the System’s cooperative structure and comparable to the Basel III framework and the standardized approach that the federal banking regulatory agencies have adopted.
The final capital rule represents the agency’s largest, most significant rulemaking in many years. It helps ensure the continued safety and soundness of the Farm Credit System. The rule will also make it easier to compare the System’s capital adequacy and financial condition with that of a joint-stock bank. This ease of comparison should make Sys-tem debt securities more attractive to informed investors.
This document also includes a report on the Federal Agricultural Mortgage Corporation, or Farmer Mac. On Decem-ber 31, 2015, Farmer Mac’s portfolio of program business reached $15.9 billion, and its tier 1 capital was approxi-mately $560 million, the highest levels achieved in both measures in the corporation’s history. The credit quality of program assets also remained near historically high levels. Farmer Mac is well positioned to withstand the widely anticipated decline in credit quality throughout the agricultural sector in 2016.
For 100 years the System has provided a dependable and affordable source of credit to our nation’s farmers and ranchers. The Farm Credit System played an important role in giving the United States one of the strongest farm economies in the world. We at the Farm Credit Administration will work hard to ensure that the System will be there to serve our farmers and ranchers for the next 100 years.
Sincerely,
The Farm Credit Administration ensures
a safe, sound, and dependable source
of credit and related services
for all creditworthy and eligible persons
in agriculture and rural America.
Farm Credit Administration
Overview and mission
The Farm Credit Administration is an independent agency in the execu-tive branch of the U.S. government. We are responsible for regulating and supervising the Farm Credit System (its banks, associations, and related entities) and the Federal Agricultural Mortgage Corporation (Farmer Mac). The System is a nationwide network of borrower-owned financial institu-tions that provide credit to farmers, ranchers, residents of rural commu-nities, agricultural and rural utility cooperatives, and other eligible bor-rowers.
FCA derives its powers and authori-ties from the Farm Credit Act of 1971, as amended (12 U.S.C. 2001 – 2279cc). The U.S. Senate Committee on Agriculture, Nutrition, and For-estry and the U.S. House of Repre-sentatives Committee on Agriculture oversee FCA and the FCS.
FCA is responsible for ensuring that the System remains a dependable source of credit for agriculture and rural America. We do this in two specific ways:
• We ensure that System institu-tions, including Farmer Mac, operate safely and soundly and comply with applicable laws and regulations. Our examinations and oversight strategies focus on an institution’s financial
condi-tion and any material existing or potential risk, as well as on the ability of its board of direc-tors and management to direct its operations. We examine each institution’s compliance with laws and regulations to serve eli-gible borrowers, including young, beginning, and small farmers and ranchers. If a System institution violates a law or regulation or operates in an unsafe or unsound manner, we use our supervisory and enforcement authorities to bring about appropriate correc-tive action.
• We issue policies and regulations governing how System institu-tions conduct their business and interact with borrowers. These policies and regulations focus on protecting System safety and soundness; implementing the Farm Credit Act; providing minimum requirements for lend-ing, related services, investments, capital, and mission; and ensur-ing adequate financial disclosure and governance. We also approve corporate charter changes, System debt issuances, and other finan-cial and operational matters. Our headquarters and one field office are in McLean, Virginia. We also have field offices in Bloomington, Minnesota; Dallas, Texas; Denver, Colorado; and Sacramento, Califor-nia.
FCA does not receive a federal appropriation. We maintain a revolv-ing fund financed primarily by assessments from the institutions we regulate. Other sources of income for the revolving fund are interest earned on investments with the U.S. Treasury and reimbursements for ser-vices we provide to federal agencies and others.
The Board
FCA policy, regulatory agenda, and supervisory and examination activi-ties are established by a full-time, three-person Board whose members are appointed by the President of the United States with the advice and consent of the Senate. Board members serve a six-year term and may remain on the Board until a successor is appointed. The President designates one member as Chair-man of the Board, who serves in that capacity until the end of his or her own term. The Chairman also serves as our Chief Executive Officer. FCA Board members also serve as the Board of Directors for the Farm Credit System Insurance Corporation.
Kenneth A. Spearman
Board Chairman and CEO
Kenneth A. Spearman is Chairman of the Board and CEO of the Farm Credit Administration. Mr. Spearman was appointed to the FCA Board by President Barack Obama on October 13, 2009. He was designated Chair-man and CEO by President Obama on March 13, 2015.
Since his appointment to the FCA Board in 2009, Mr. Spearman served as Chairman of the Board of Direc-tors of the Farm Credit System Insur-ance Corporation, which is respon-sible for ensuring the timely payment of principal and interest on obliga-tions issued on behalf of Farm Credit System banks. He will continue to serve concurrently as a member of the FCSIC Board of Directors.
Mr. Spearman brings to his posi-tion on the FCA Board many years of experience in finance, agriculture, and agricultural cooperatives. He spent 28 years in the citrus industry. From 1980 to 1991, he was control-ler of Citrus Central, a $100 million cooperative in Orlando, Florida, where he was responsible for finan-cial management and reporting and the supervision of staff accountants. He later served as director of internal audit for Florida’s Natural Growers, where he designed and implemented the annual plan for reviewing and appraising the soundness, adequacy, and application of accounting, finan-cial, and other operating internal controls.
From January 2006 until his appoint-ment to the FCA Board, Mr. Spear-man served as an independently appointed outside director on the AgFirst Farm Credit Bank board in Columbia, South Carolina. During his tenure, he served on the board com-pensation committee and the board governance committee.
Before entering agriculture in central Florida, Mr. Spearman served with the U.S. Army and is a Vietnam vet-eran. He later was employed by the public accounting firm Arthur Ander-sen & Co. and was involved with the development of a public accounting firm in Chicago, Illinois. He served as chairman of the board of trustees for the Lake Wales Medical Center.
He is a member of the Institute of Internal Auditors, as well as the National Society of Accountants for Cooperatives, where he served a term as national president.
He obtained his master’s degree in business administration from Gover-nors State University in University Park, Illinois, and his B.S. in account-ing from Indiana University. He also attended Harvard Kennedy School Executive Education, where he com-pleted a program with a concentra-tion in Government Agency Strategic Planning.
Mr. Spearman and his wife, Maria, of Winter Haven, Florida, have three children — twin daughters, Michelle Springs and Rochelle Puccia, and a son, Dr. Kenneth Spearman.
Dallas P. Tonsager
Board Member
Dallas P. Tonsager was appointed to the FCA Board by President Barack Obama on March 13, 2015, for a term that expires May 21, 2020.
Mr. Tonsager also serves as Chair-man of the Board of Directors of the Farm Credit System Insurance Corporation, which is responsible for ensuring the timely payment of principal and interest on obligations issued on behalf of FCS banks. Mr. Tonsager served as Under Secretary for Rural Development at the U.S. Department of Agriculture (USDA) from 2009 to 2013. In this position, he expanded broadband communication in rural America and implemented other key elements of the Recovery Act for rural America.
He dramatically expanded USDA’s water and wastewater programs, expanded funding for first- and sec-ond-generation biofuels, and funded hospitals and other public facilities in rural America.
In addition, Mr. Tonsager worked with the Farm Credit System and others to set up new venture capital investment funds. From 2010 to 2013, he was a member of the Commodity Credit Corporation Board of Direc-tors.
From 2004 to 2009, Mr. Tonsager served as a member of the FCA Board as well as a member of the FCSIC Board of Directors.
From 2002 to 2004, he was the execu-tive director of the South Dakota Value-Added Agriculture Develop-ment Center. In this position, he coordinated initiatives to better serve producers interested in developing value-added agricultural projects. Services provided by the center include project facilitation, feasibility studies, business planning, market assessment, technical assistance, and education.
In 1993, he was selected by Presi-dent William J. Clinton to serve as USDA’s state director for rural devel-opment in South Dakota. Mr. Ton-sager oversaw a diversified portfolio of housing, business, and infrastruc-ture loans in South Dakota. His term ended in February 2001.
A longtime member of the South Dakota Farmers Union, Mr. Tonsager served two terms as president of the organization, from 1988 to 1993. During that same period, he was a board member of Green Thumb Inc., a nationwide job training program for senior citizens. In addition, he served on the Board of National Farmers Union Insurance from 1989 to 1993, and he was a member of the Advisory Board of the Commodity Futures Trading Commission from 1990 to 1993.
Mr. Tonsager grew up on a dairy farm near Oldham, South Dakota. For many years, he and his older brother owned Plainview Farm in Oldham, a family farm on which they raised corn, soybeans, wheat, and hay. Mr. Tonsager is a gradu-ate of South Dakota Stgradu-ate University, where he earned a Bachelor of Sci-ence in agriculture in 1976.
Jeffery S. Hall
Board Member
Jeffery S. Hall was appointed to the FCA Board by President Barack Obama on March 17, 2015. Succeed-ing Leland A. Strom, Mr. Hall will serve a term that expires on October 13, 2018.
Mr. Hall was president of The Capstone Group, an association management and consulting firm
that he cofounded in 2009. He was the State Executive Director for the U.S. Department of Agriculture’s Farm Service Agency in Kentucky from 2001 to 2009. In that role, he had responsibility for farm program and farm loan program delivery and compliance.
From 1994 to 2001, Mr. Hall served as Assistant to the Dean of the University of Kentucky, College of Agriculture, advising the Dean on state and federal legislative activities and managing a statewide economic development initiative called AgPro-ject 2000.
Mr. Hall also served as a senior staff member in the office of U.S. Sena-tor Mitch McConnell from 1988 until 1994. During that time, he was the Legislative Assistant for Agriculture, accountable for internal and external issue management.
Before joining Senator McConnell’s staff, Mr. Hall served on the staff of the Kentucky Farm Bureau Fed-eration. Over his 30-year career in agriculture, he has held leadership
positions in the following nonprofits: the Kentucky Agricultural Council, the Agribusiness Industry Network, the Louisville Agricultural Club, the Kentucky Agricultural Water Quality Authority, and the Governor’s Com-mission on Family Farms.
Mr. Hall was raised on a family farm in southern Indiana, which has been in his family for nearly 200 years. He is currently a partner in the farm with his mother and sister. Mr. Hall received a B.S. from Purdue Univer-sity.
Farm Credit System—Role, Structure,
and Safety and Soundness
FCS role
The Farm Credit System (FCS or Sys-tem) is a network of borrower-owned cooperative financial institutions and service organizations serving all 50 states and the Commonwealth of Puerto Rico. Created by Congress in 1916 to provide American agriculture with a dependable source of credit, the FCS is the nation’s oldest govern-ment-sponsored enterprise.1
FCS institutions provide credit and financially related services to farm-ers, ranchfarm-ers, producers or harvesters of aquatic products, and agricultural and aquatic cooperatives. They also make credit available for agricultural processing and marketing activities, rural housing, certain farm-related businesses, rural utilities, and foreign and domestic entities in connection with international agricultural trade. The System raises funds for its busi-ness activities by selling securities in the national and international money markets; its Systemwide debt funding is subject to FCA approval. The U.S. government does not guarantee the securities issued by the System. According to the Farm Credit Act of 1971, as amended, Congress estab-lished the System to improve the income and well-being of American farmers and ranchers. The System is to provide a permanent, reliable source of credit and related services to agriculture and aquatic
produc-ers, farmer-owned cooperatives, and farm-related businesses in rural America.
Congress formed the FCS as a sys-tem of farmer-owned cooperatives to ensure that farmer- and rancher-borrowers participate in the man-agement, control, and ownership of their institutions. The participation of member-borrowers helps keep the institutions focused on serving their members’ needs.
The System helps to meet a broad public need by preserving liquidity and competition in rural credit mar-kets in both good and bad economic times. The accomplishment of this public goal benefits all eligible bor-rowers, including young, beginning, and small farmers, as well as rural homeowners.
FCS structure
The lending institutions
As of January 1, 2016, the System was composed of 78 banks and asso-ciations. The following 4 banks pro-vide loans to 72 Agricultural Credit Association (ACA) parent organiza-tions and 2 stand-alone Federal Land Credit Associations (FLCAs)2:
• CoBank, ACB • AgriBank, FCB
• AgFirst Farm Credit Bank • Farm Credit Bank of Texas
An ACA can make agricultural pro-duction and intermediate-term loans and real estate mortgage loans; an FLCA can make only long-term real estate loans. Under the Farm Credit Act of 1971, as amended, the FLCA is exempt from state and federal income taxes.
CoBank, one of the four Farm Credit banks, is an Agricultural Credit Bank (ACB), which has a nationwide charter to make loans to agricultural and aquatic cooperatives and rural utilities, as well as to other persons or organizations that have transac-tions with, or are owned by, these cooperatives. The ACB finances U.S. agricultural exports and imports and provides international banking services for farmer-owned coopera-tives. In addition to making loans to cooperatives, the ACB provides loan funds to 23 ACAs and 1 FLCA. Each ACA contains two subsidiar-ies, a Production Credit Association (PCA), which can make only agricul-tural production loans and interme-diate-term loans, and an FLCA.3 The parent-subsidiary structure, with an ACA as parent and its wholly owned PCA and FLCA as subsidiaries, accounted for over 97 percent of all direct-lender associations as of Janu-ary 1, 2016.
The ACA and its two subsidiaries operate with a common board of directors and staff, and each of the three entities is responsible for the debts of the others. For most
regula-1. The Federal Land Banks were created in 1916, when the System was originally established. Other major parts of the FCS were created in 1923 and 1933.
2. An FLCA is a Federal Land Bank Association that has received a transfer of direct long-term real estate lending authority under section 7.6 of the Farm Credit Act.
3. Although legally separated, the ACA, the PCA, and the FLCA operate an integrated lending business, with loans made through the subsidiaries possessing the appropriate authority. The ACA, the PCA, and the FLCA are jointly and severally liable on the full amount of the indebtedness to the bank under the bank’s General Financing Agreement. In addition, the three associations agree to guarantee each other’s debts and obligations, pledge their respective assets as security for the guarantee, and share each other’s capital.
tory and examination purposes, FCA treats the ACA and its subsidiaries as a single entity; however, when appropriate, we may choose to treat the parent and subsidiaries as sepa-rate entities.
The ACA’s parent-subsidiary struc-ture enables the ACA to preserve the tax-exempt status of the FLCA. This structure offers several other benefits as well. It allows the ACA to build and use capital more efficiently, and it enables members to hold stock in only the ACA but to borrow either from the ACA or from one or both of its subsidiaries. This gives the ACA and its subsidiaries greater flex-ibility in serving their borrowers, and it allows credit and related services to be delivered to borrowers more efficiently.
Further, the structure allows an association to provide a broader range of specialized services to its member-borrowers. It enables one-stop borrowing, allowing borrowers to obtain agricultural production and intermediate-term loans and real estate mortgage loans from the same institution.
Special-purpose entity and
service corporations
In addition to the banks and lending associations, the System also
con-tains a special-purpose entity known as the Federal Farm Credit Banks Funding Corporation. Established under the Farm Credit Act, the Fund-ing Corporation issues and markets debt securities on behalf of the Farm Credit banks to raise loan funds. It also issues quarterly and annual information statements for investors. The System also contains the follow-ing five service corporations. These corporations exist under the author-ity of section 4.25 of the Farm Credit Act4:
• AgVantis, Inc., provides technol-ogy-related and other support services to the associations affili-ated with CoBank, ACB. AgVan-tis is owned by the bank and 14 of its affiliated associations. • Farm Credit Leasing Services
Corporation provides equipment leasing services to eligible bor-rowers, including agricultural producers, cooperatives, and rural utilities. It is wholly owned by CoBank, ACB.
• Farm Credit Financial Partners, Inc., provides support services to four associations affiliated with CoBank; one association affiliated with AgriBank, FCB; and the Leasing Corporation. It is owned
by four associations to which the corporation provides services. • The FCS Building Association
acquires, manages, and maintains facilities to house FCA head-quarters and field office staff. The FCS Building Association is owned by the FCS banks, but the FCA Board oversees the Building Association’s activities.
• Farm Credit Foundations pro-vides human resource services to its employer-owners. These services include payroll process-ing, benefits administration, centralized vendor management, workforce management and operations, corporate tax and financial reporting services, and retirement workshops. Employer-owners consist of 39 Farm Credit associations, 1 service corpora-tion (AgVantis, Inc.), and 1 Farm Credit Bank (AgriBank, FCB).
Farmer Mac
The Federal Agricultural Mortgage Corporation (Farmer Mac), which is also recognized by law as an FCS institution, provides a secondary market arrangement for agricultural real estate loans, government-guaran-teed portions of certain loans, rural housing mortgage loans, and eligible rural utility cooperative loans. The
purpose of Farmer Mac’s activities is to provide greater liquidity and lend-ing capacity to all agricultural and rural lenders, including insurance companies, credit unions, commercial banks, and FCS lending institutions. The Farm Credit Act established Farmer Mac as a federally chartered instrumentality and an institution of the FCS. However, it has no liabil-ity for the debt of any other System institution, and the other System institutions have no liability for Farmer Mac debt.
Farmer Mac is owned by its investors — it is not a member-owned coop-erative. Investors in voting stock may include commercial banks, insurance companies, other financial organi-zations, and FCS institutions. Any investor may own nonvoting stock. FCA regulates and examines Farmer Mac through its Office of Secondary Market Oversight, whose director reports to the FCA Board on matters of policy.
Although Farmer Mac is an FCS institution under the Farm Credit Act, we discuss Farmer Mac sepa-rately from the other entities of the FCS. Therefore, throughout this report, unless Farmer Mac is explic-itly mentioned, the Farm Credit
System refers only to the banks and associations of the System. For more information about Farmer Mac, see “Condition of Farmer Mac” on page 45.
The safety and soundness
of the FCS
FCA regulates the FCS — its lending institutions, the Funding Corpora-tion, the service corporations, and Farmer Mac. Our regulatory activi-ties and examinations support the System’s mission by ensuring that FCS institutions operate in a safe and sound manner, without undue risk to taxpayers, investors in System securi-ties, or borrower-stockholders. For an overview of our agency, see page 5 or visit our website at www.fca.gov. The Farm Credit System Insurance Corporation (FCSIC) also helps pro-tect the safety and soundness of the Farm Credit System. It was estab-lished by the Agricultural Credit Act of 1987 in the wake of the agricul-tural credit crisis of the 1980s, when the FCS, like most lenders heavily concentrated in agriculture, expe-rienced severe financial difficulties. The purpose of FCSIC is to protect investors in Systemwide debt securi-ties by ensuring the timely payment of principal and interest on insured
notes, bonds, and other obligations issued on behalf of FCS banks. FCSIC ensures timely payment by maintaining the Farm Credit Insur-ance Fund, a reserve that represents the equity of FCSIC. The balance in the Insurance Fund at December 31, 2015, was $4.0 billion. For more information about FCSIC, go to www.fcsic.gov. Also see FCSIC’s 2015 annual report.
Investors in Systemwide debt securi-ties are further protected by the Farm Credit Act’s joint and several liability provision, which applies to all FCS banks. The banks are jointly and severally liable for the principal and interest on all Systemwide debt secu-rities. Therefore, if a bank is unable to pay the principal or interest on a Systemwide debt security and if the Farm Credit Insurance Fund has been exhausted, then FCA must call all nondefaulting banks to satisfy the security.
FCS Banks and Associations
Financial condition
The overall condition and perfor-mance of the FCS5 was strong in 2015, and the System remains funda-mentally safe and sound. For 2015, the System reported solid earnings, strong capital levels, and favorable portfolio credit quality. Tables 1 and 2 provide a breakdown of the Sys-tem’s major financial indicators. While the overall FCS remained financially sound, a small number of individual System institutions exhib-ited weaknesses. As the System’s regulator, we addressed these weak-nesses by increasing our supervi-sion of these institutions. For more information on measures we took to address these weaknesses, see “Maintaining a Dependable Source of Credit for Farmers and Ranchers” on pages 41 to 44 of this report. For more information on the condition of the System, see the 2015 Annual Information Statement of the Farm Credit System on the website of the Federal Farm Credit Banks Funding Corporation at www.farmcreditfund-ing.com.
Agricultural producers faced a more difficult operating environment in 2015. The U.S. Department of Agri-culture estimates that both crop and livestock receipts were down in 2015. As a result, USDA expects that net farm income has dropped sig-nificantly for the second consecutive year.
Crop producers continued to see considerable pressure on profitability in 2015. Margins were low to nega-tive as a result of two factors: weak grain prices, which have declined because of large U.S. and global crop supplies, and high input costs, which have been slow to adjust downwards. Financial stress is expected to inten-sify for the crop sector if commodity prices remain low for an extended period of time.
Low grain prices are also putting downward pressure on farmland values, especially in the Midwest. Rising interest rates in response to a strengthening of the U.S. economy would put additional pressure on farmland values.
For livestock producers, lower crop prices translated into lower feed costs, but profitability fell as product prices weakened. Expanding produc-tion, particularly in the hog, dairy, and broiler sectors, was responsible for the decline in product prices. In 2015, fears of slowing global economic growth in major foreign markets, particularly China, and a strengthening of the U.S. dollar hurt export demand for agricultural products. U.S. agricultural exports are again projected to fall in 2016 because of the strong dollar, stiff competition from other major export-ing nations, and reduced demand from slowing economies around the world.
For a detailed discussion of potential risks facing the System in 2016 and beyond, see “Challenges Facing the Agricultural Economy and the Farm Credit System” on pages 50 to 61.
5. Throughout this chapter, when referring to the Farm Credit System, we mean only the banks and direct-lending associations of the System, excluding Farmer Mac. The analyses in this section are based on data that System institutions provided to FCA or to the Federal Farm Credit Banks Funding
As of December 31
Dollars in thousands
At and for the 12 months ended 31-Dec-15 31-Dec-14 31-Dec-13 31-Dec-12 31-Dec-11
FCS Banks1
Total assets 267,533,786 249,370,568 230,427,442 219,043,177 205,087,928 Gross loan volume 208,766,996 192,083,080 179,260,572 173,227,170 158,420,741 Nonaccrual loans 231,520 227,872 275,228 365,478 384,795 Cash and marketable investments 57,123,019 55,472,944 49,241,806 43,618,788 44,047,407 Net income 1,945,693 2,042,527 2,057,199 2,011,314 1,860,347 Nonperforming loans/total loans2 0.13% 0.15% 0.18% 0.23% 0.27%
Capital/assets3 6.28% 6.41% 6.58% 6.51% 6.49%
Unallocated retained earnings/assets 3.45% 3.42% 3.39% 3.23% 3.25% Return on assets 0.74% 0.84% 0.91% 0.94% 0.92% Return on equity 11.47% 12.76% 13.31% 13.86% 13.68%
Net Interest margin4 0.98% 1.05% 1.15% 1.25% 1.28%
Operating expense ratio5 0.33% 0.33% 0.32% 0.31% 0.31%
Efficiency ratio6 25.30% 24.20% 22.20% 20.00% 20.14%
Payout ratio7 59.44% 58.19% 54.61% 47.79% 53.76%
FCS Associations
Total assets 180,005,335 167,312,405 157,085,461 148,778,120 136,717,742 Gross loan volume 169,995,422 157,543,635 146,873,767 138,314,966 126,187,799 Nonaccrual loans 1,095,207 1,146,358 1,465,651 1,932,706 2,353,352 Net Income 3,126,729 3,383,894 3,304,680 2,989,912 3,007,154 Nonperforming loans/gross loans2 0.80% 0.92% 1.17% 1.59% 2.03%
Capital/assets3 18.68% 18.78% 18.48% 17.80% 17.84%
Unallocated retained earnings/assets 17.33% 17.40% 17.24% 16.65% 16.78% Return on assets 1.84% 2.07% 2.14% 2.06% 2.24% Return on equity 9.57% 10.69% 11.34% 11.23% 12.42%
Net interest margin4 2.68% 2.75% 2.80% 2.83% 2.94%
Operating expense ratio5 1.50% 1.51% 1.48% 1.45% 1.43%
Efficiency ratio6 41.38% 39.52% 37.14% 39.13% 31.27%
Payout ratio7 28.31% 25.22% 25.45% 25.82% 22.57%
Total Farm Credit System8
Total assets 303,503,000 282,733,000 260,782,000 246,664,000 230,411,000 Gross loan volume 235,890,000 217,054,000 201,060,000 191,904,000 174,664,000 Bonds and notes 246,214,000 228,958,000 210,704,000 200,365,000 186,889,000 Nonperforming loans 1,629,000 1,737,000 2,040,000 2,608,000 2,997,000 Nonaccrual loans 1,324,000 1,375,000 1,736,000 2,300,000 2,738,000 Net income 4,688,000 4,724,000 4,640,000 4,118,000 3,940,000 Nonperforming loans/gross loans2 0.69% 0.80% 1.01% 1.36% 1.72%
Capital/assets3 16.09% 16.17% 16.34% 15.65% 15.60%
Surplus/assets 13.33% 13.36% 13.44% 12.94% 12.90% Return on assets 1.62% 1.74% 1.84% 1.73% 1.71% Return on equity 9.75% 10.50% 11.28% 10.89% 11.17%
Net interest margin4 2.55% 2.64% 2.78% 2.87% 2.86%
Sources: FCA’s Consolidated Reporting System as of December 31, 2015, and the Farm Credit System Quarterly Information Statement provided by the Federal Farm Credit Banks Funding Corporation.
Note: Changes to previous periods occasionally occur for accounting reasons. 1. Includes Farm Credit Banks and the Agricultural Credit Bank.
2. Nonperforming loans are defined as nonaccrual loans, accruing restructured loans, and accrual loans 90 or more days past due.
3. Capital includes restricted capital (amount in Farm Credit Insurance Fund) and excludes mandatorily redeemable preferred stock and protected borrower capital.
4. Net interest margin ratio measures net income produced by interest-earning assets, including the effect of loanable funds, and is a key indicator of loan pricing effectiveness.
5. Operating expenses divided by average gross loans.
6. The efficiency ratio measures total noninterest expenses for the preceding 12 months divided by net interest income plus noninterest income for the preceding 12 months.
7. The percentage of earnings paid out in patronage dividends to borrower-owners and in dividends to holders of preferred stock. (Patronage dividends constitute the majority of earnings paid out.) This ratio is only valid at year-end (December 31).
Table 2
Farm Credit System major financial indicators, by district
December 31, 2015
Dollars in thousands
Gross Allowance Cash and Operating
Farm Credit Total Loan Nonaccrual for Loan Marketable Capital Total Expense
System Banks Assets Volume Loans Losses Investments1 Stock2 Surplus3 Capital4 Ratio5
AgFirst 30,642,851 22,140,758 26,649 15,113 8,192,858 462,471 1,732,628 2,255,021 0.58% AgriBank 99,506,834 82,819,652 43,394 18,076 16,237,330 2,313,343 2,945,638 5,174,116 0.16% CoBank 117,394,526 89,035,580 156,805 486,144 27,674,227 4,024,728 3,845,728 7,810,469 0.39% Texas 19,989,575 14,771,006 4,672 5,833 5,018,604 855,823 725,086 1,553,578 0.59% Total 267,533,786 208,766,996 231,520 525,166 57,123,019 7,656,365 9,249,080 16,793,184 0.33% FCS Associations AgFirst 19,914,776 18,934,719 225,859 163,503 156,344 216,156 3,876,687 4,062,643 2.12% AgriBank 92,654,127 86,905,787 473,613 267,635 1,778,921 341,760 16,360,541 16,702,301 1.39% CoBank 50,921,973 48,168,349 286,946 259,523 368,974 1,513,008 8,685,717 10,100,608 1.43% Texas 16,514,459 15,986,567 108,789 64,514 36,439 285,982 2,473,875 2,756,213 1.55% Total 180,005,335 169,995,422 1,095,207 755,175 2,340,678 2,356,906 31,396,820 33,621,765 1.50% Total FCS6 303,503,000 235,890,000 1,324,000 1,280,000 29,378,000 1,726,000 40,458,000 48,834,000
Sources: Farm Credit System Call Report as of December 31, 2015, and the Farm Credit System Quarterly Information Statement provided by the Federal Farm Credit Banks Funding Corporation.
1. Includes accrued interest receivable on marketable investments.
2. Includes capital stock and participation certificates, excludes mandatorily redeemable preferred stock and protected borrower capital. 3. Includes allocated and unallocated surplus.
4. Includes capital stock, participation certificates, perpetual preferred stock, surplus, accumulated other comprehensive income. For the total Farm Credit System amount, total capital also includes $4.038 billion of restricted capital, which is the amount in the Farm Credit Insurance Fund. Excludes mandatorily redeemable preferred stock and protected borrower capital.
5. Operating expense per $100 of gross loans.
Table 2
Farm Credit System major financial indicators, by district
December 31, 2015
Dollars in thousands
Gross Allowance Cash and Operating
Farm Credit Total Loan Nonaccrual for Loan Marketable Capital Total Expense
System Banks Assets Volume Loans Losses Investments1 Stock2 Surplus3 Capital4 Ratio5
AgFirst 30,642,851 22,140,758 26,649 15,113 8,192,858 462,471 1,732,628 2,255,021 0.58% AgriBank 99,506,834 82,819,652 43,394 18,076 16,237,330 2,313,343 2,945,638 5,174,116 0.16% CoBank 117,394,526 89,035,580 156,805 486,144 27,674,227 4,024,728 3,845,728 7,810,469 0.39% Texas 19,989,575 14,771,006 4,672 5,833 5,018,604 855,823 725,086 1,553,578 0.59% Total 267,533,786 208,766,996 231,520 525,166 57,123,019 7,656,365 9,249,080 16,793,184 0.33% FCS Associations AgFirst 19,914,776 18,934,719 225,859 163,503 156,344 216,156 3,876,687 4,062,643 2.12% AgriBank 92,654,127 86,905,787 473,613 267,635 1,778,921 341,760 16,360,541 16,702,301 1.39% CoBank 50,921,973 48,168,349 286,946 259,523 368,974 1,513,008 8,685,717 10,100,608 1.43% Texas 16,514,459 15,986,567 108,789 64,514 36,439 285,982 2,473,875 2,756,213 1.55% Total 180,005,335 169,995,422 1,095,207 755,175 2,340,678 2,356,906 31,396,820 33,621,765 1.50% Total FCS6 303,503,000 235,890,000 1,324,000 1,280,000 29,378,000 1,726,000 40,458,000 48,834,000
Earnings
Despite the challenges facing U.S. agriculture, the System reported solid earnings in 2015, with net income of $4.69 billion, down slightly from $4.72 billion for 2014 (See figure 1). Although net interest income was up in 2015, higher provisions for loan losses and noninterest expenses resulted in the slight drop in net income.
For 2015, net interest income increased by $211 million because higher average earning asset balances
offset the effect of lower net interest margins. Driven largely by growth in loan volume, average earning assets grew by $17.5 billion, or 6.8 percent, to $275 billion in 2015. Net interest margin decreased 9 basis points to 2.55 percent as a result of competi-tive pressures, loan volume repricing at lower rates, and higher debt costs. Return on average assets declined to 1.64 percent in 2015 from 1.77 per-cent in 2014, and the return on aver-age capital decreased to 9.87 percent from 10.62 percent.
As cooperative institutions, FCS banks and associations typically pass a portion of their earnings on to their borrower-owners as patronage distri-butions. For 2015, System institutions declared a total of $1.5 billion in patronage distributions — $1.12 bil-lion in cash, $308 milbil-lion in allocated retained earnings, and $72 million in stock. This represents 32.0 percent of the System’s net income for 2015 as compared with 30.4 percent in 2014. Also in 2015, the System distributed $161 million in cash from patronage allocations for earlier years.
As of December 31
System growth
The System continued to grow at a moderately strong pace in 2015. Total assets increased to $303.5 billion, up $20.8 billion or 7.3 percent from 2014. Gross loan balances were $235.9 bil-lion at year-end, up $18.8 bilbil-lion or 8.7 percent from 2014. (See figure 2.)
The growth in System loan balances was largely due to increases in real estate mortgage, agribusiness, pro-duction and intermediate-term, and energy lending. Real estate mortgage lending was up $7.0 billion or 6.9 percent mainly due to continued demand for cropland. Real estate mortgage loans represent the larg-est component of the System’s loan portfolio at 45.7 percent.
Agribusiness lending (primarily pro-cessing and marketing loans) was up $3.7 billion or 11.1 percent. Produc-tion and intermediate-term lending increased $2.9 billion or 6.3 percent primarily because farmers financed more of their production costs. Energy loans increased by $2.9 billion or 19.2 percent because of greater lending activity in the electric distri-bution and power supply sectors.
Annual growth rate of FCS loans outstanding, 2004 – 2015
Source: Federal Farm Credit Banks Funding Corporation, Annual Information Statements.
Asset quality
Overall, the quality of System loans remains very good. Credit stress con-tinued to build for cash grain pro-ducers because large supplies of corn and soybeans weighed on prices. As a result, loan delinquencies may rise. With weak margins, farmers will look to strengthen their balance sheets and change their operating structures to reduce their cost of production.
As of December 31, 2015, nonper-forming loans totaled $1.6 billion, or 0.69 percent of gross loans outstand-ing, down from $1.7 billion or 0.80 percent at year-end 2014. (See figure 3.) Loan delinquencies (accruing loans that are 30 days or more past due) fell slightly to 0.20 percent of total accruing loans from 0.23 percent at year-end 2014.
The allowance for loan losses was $1.280 billion, or 0.54 percent of loans outstanding, at year-end 2015. This compares with an allowance for loan losses of $1.237 billion, or 0.57 per-cent of loans outstanding, at year-end 2014. The System recognized provi-sions for loan losses of $106 million in 2015 as compared to $40 million in 2014 and a loan loss reversal of $31 million in 2013. Net loan charge-offs remain low, falling to $37 million in 2015 from $68 million in 2014.
As of December 31
Sources: Federal Farm Credit Banks Funding Corporation, Annual Information Statements.
Funding
Throughout 2015, the System had reliable access to the debt capital markets to support its mission, and investor demand for all System debt products remained favorable. Secu-rities due within a year increased by 5.4 percent while securities with maturities greater than one year increased by 9.6 percent. In total, Systemwide debt increased by 8.0 percent.
The System’s funding composi-tion remained stable. Securities due within a year accounted for 37.7 percent of total Systemwide debt compared with 38.6 percent a year ago. (See “Funding Activity in 2015” on page 39 for further discussion of the System’s funding environment.)
Liquidity
Each System bank maintains a ity reserve to ensure adequate liquid-ity to meet its business and financial needs, especially during unantici-pated disruptions in the capital mar-kets. As of December 31, 2015, the System’s liquidity position equaled 181 days, up from 173 days at year-end 2014 and significantly above the 90-day regulatory minimum.
Investments available for sale (based on fair value) increased 1.5 percent to $50.0 billion in 2015, with a weighted average yield of 1.37 percent.
Mission-related and other invest-ments available for sale (based on fair value) decreased 21.7 percent to $300 million, with a weighted aver-age yield of 2.61 percent.
Mission-related and other investments held to maturity decreased 6.0 percent to $2.5 billion, with a weighted average yield of 3.11 percent.
Each System bank may hold federal funds and available-for-sale securi-ties in an amount not to exceed 35 percent of its average loans out-standing for the quarter. Criteria for eligible investments are defined by FCA regulations. If an investment no longer meets the eligibility criteria, it becomes ineligible for regulatory liquidity calculation purposes, but the bank may continue to hold the investment provided certain require-ments are met.
Capital
The System maintained its strong capital position in 2015. Total capital equaled $48.8 billion at December 31, 2015, compared with $45.7 billion at year-end 2014. The increase in capital was due in large part to the System’s strong earnings performance. At year-end 2015, the System’s capital-to-assets ratio was 16.1 percent, com-pared with 16.2 percent in 2014.
As figure 4 shows, surplus accounts for the vast majority of total capital. FCA regulations establish the mini-mum capital requirements that each System bank and association must achieve and maintain. As of Decem-ber 31, 2015, the permanent capi-tal ratios for all System banks and associations were significantly above the regulatory minimum of 7.0 per-cent. The ratios ranged between 14.9 percent and 20.8 percent for System
banks and between 13.1 percent and 36.0 percent for System associations. In addition, as of December 31, 2015, the FCS had $4.0 billion of restricted capital in the Farm Credit Insurance Fund.
Figure 4
FCS capital, 2008 – 2015
As of December 31
Dollars in billions
Table 3
FCS gross loans outstanding, 2011 – 2015
As of December 31
Dollars in millions
Percent Percent
change change
2011 2012 2013 2014 2015 from 2011 from 2014
Agricultural real estate
mortgage loans $85,644 $92,504 $95,209 $100,811 $107,813 25.9% 6.9% Agricultural production
and intermediate-term loans 40,578 43,446 44,309 46,305 49,204 21.3% 6.3%
Agribusiness loans to the following: Processing and
marketing operations 8,098 10,735 13,164 16,974 19,949 146.3% 17.5% Cooperatives 9,207 10,255 10,885 12,553 13,113 42.4% 4.5% Farm-related businesses 2,596 2,858 2,999 3,408 3,533 36.1% 3.7% Rural utility loans by type of utility:
Energy 11,585 13,193 14,304 15,036 17,925 54.7% 19.2% Communication 2,638 3,435 4,159 5,044 6,196 134.9% 22.8% Water/wastewater 1,061 1,215 1,325 1,488 1,677 58.1% 12.7% Rural home loans 6,047 6,430 6,511 6,754 7,117 17.7% 5.4% Agricultural export finance 4,486 4,729 4,743 4,837 5,075 13.2% 4.9% Lease receivables 2,139 2,415 2,706 2,976 3,373 57.7% 13.3% Loans to other financing
institutions 585 689 746 868 915 56.4% 5.4%
Total $174,664 $191,904 $201,060 $217,054 $235,890 35.1% 8.7% Sources: Federal Farm Credit Banks Funding Corporation Annual Information Statements.
Borrowers served
The System fulfills its overall mis-sion by lending to agriculture and rural America. Its lending authorities include the following:
• Agricultural real estate loans • Agricultural production and
intermediate-term loans
• Loans to producers and harvest-ers of aquatic products
• Loans to certain farmer-owned agricultural processing facilities and farm-related businesses • Loans to farmer-owned
agricul-tural cooperatives • Rural home loans
• Loans that finance agricultural exports and imports
• Loans to rural utilities • Limited portions of loans to
entities that qualify under the System’s similar-entity authority6
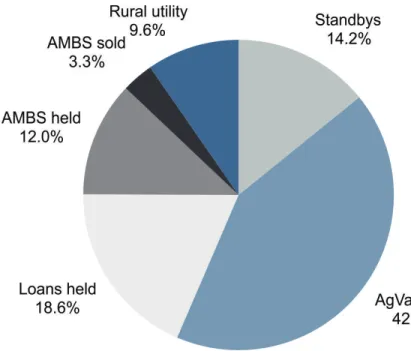
Nationwide, the System had $236 bil-lion in gross loans outstanding as of December 31, 2015. Agricultural pro-ducers represented by far the largest borrower group, with $157 billion, or 66.6 percent, of the total dollar amount of loans outstanding.7 See table 3 and figure 5 for a breakdown of lending by type.
As required by law, borrowers own stock or participation certificates in System institutions. The FCS had nearly 1,304,000 loans and more than
504,000 stockholders in 2015. Approx-imately 86.0 percent of the stockhold-ers were farmstockhold-ers or cooperatives with voting stock. The remaining 14.0 percent were nonvoting stock-holders, including rural homeowners and other financing institutions that borrow from the System. Over the past five years, the total number of System stockholders has increased gradually, rising 3.4 percent since year-end 2011.
Total loans outstanding at FCS banks and associations (net of intra-System lending) increased by $18.8 billion, or 8.7 percent, during the year that ended December 31, 2015. This com-pares with increases of 8.0 percent in
6. A similar-entity borrower is not eligible to borrow directly from an FCS institution, but because the similar-entity borrower’s operation is functionally similar to that of an eligible borrower, the System can participate in these loans (the participation interest must be less than 50 percent).
7. This amount includes real estate mortgages, production loans, and intermediate-term loans, but excludes leases and loans to “rural homeowners” (as defined in 613.3030 of the FCA regulations).
2014 and 4.8 percent in 2013. Since year-end 2011, total System loans outstanding have increased by $61.2 billion, or 35.1 percent.
The increase in 2015 was driven by increases in real estate mortgage, processing and marketing, energy, and production and intermediate-term loans. Real estate mortgage loans increased $7.0 billion, or 6.9 percent, primarily because of the con-tinued demand for cropland financ-ing. Production- and
intermediate-term loans also increased, going up $2.9 billion, or 6.3 percent primarily because farmers needed to finance more of their production costs (for inputs such as fertilizer, seed, and fuel).
Processing and marketing loans increased $3.0 billion, or 17.5 percent, in 2015 largely because of advances on existing loans. And loans to energy utilities increased $2.9 billion, or 19.2 percent, because of increased lending activity in the electric distri-bution and power supply sectors.
The other loan categories also posted significant increases for the year. For example, communication loans increased $1.2 billion, or 22.8 percent, primarily because of new loans to develop or expand data networks.
Figure 5
Farm Credit System lending by type
As of December 31, 2015System funding for other
lenders
Other financing institutions
Under the Farm Credit Act, System banks may further serve the credit needs of rural America by providing funding and discounting services to certain non-System lending institu-tions described in our regulainstitu-tions as “other financing institutions.” OFIs include the following:
• Commercial banks • Savings institutions • Credit unions • Trust companies
• Agricultural credit corporations • Other specified agricultural
lend-ers that are significantly involved in lending to agricultural and aquatic producers and harvesters System banks may fund and dis-count agricultural production and intermediate-term loans for OFIs that demonstrate a need for additional funding to meet the credit needs of borrowers who are eligible to receive loans from the FCS. OFIs benefit by using the System as an additional source of liquidity for their own lending activities and by capitalizing on the System’s expertise in agricul-tural lending.
As of December 31, 2015, the Sys-tem served 23 OFIs, down from 24 in 2014 and 26 in 2013, 2012, and 2011, and down from 28 in 2010 and 2009. Outstanding loan volume to OFIs was $917 million at year-end, up $47 million from 2014. OFI loan volume continues to be less than half of one percent of the System’s loan
portfolio. About three-quarters of the System’s OFI lending activity occurs in the AgriBank district.
Syndications and loan
participations with non-FCS
lenders
In addition to the authority to provide services to OFIs, the Farm Credit Act gives System banks and associations the authority to partner with financial institutions outside the System, including commercial banks, in making loans to agriculture and rural America. Generally, System institutions partner with these finan-cial institutions through loan syndi-cations and participations.
• A loan syndication (or “syndi-cated bank facility”) is a large loan in which a group of finan-cial institutions work together to provide funds for a borrower. Usually one financial institu-tion takes the lead, acting as an agent for all syndicate members and serving as a liaison between them and the borrower. All syn-dicate members are known at the outset to the borrower.
• Loan participations are large loans in which two or more lenders share in providing loan funds to a borrower. One of the participating lenders originates, services, and documents the loan. Generally, the borrower deals with the institution originating the loan and is not aware of the other participating institutions. Financial institutions primarily use loan syndications and participations
to reduce credit risk and to comply with lending limits. For example, a financial institution with a high con-centration of production loans for a single commodity could use partici-pations or syndications to diversify its loan portfolio, or it could use them to sell loans that are beyond its lending limit. Institutions also use syndications and participations to manage and optimize capital, earn-ings, and liquidity.
The System’s gross loan syndication volume has grown by more than $1 billion over the past three years to $13.8 billion at year-end 2015. This figure includes volume from syndica-tions that System institusyndica-tions have with other System institutions as well as with non-FCS institutions.
At year-end 2015, the System had $4.8 billion in net eligible-borrower loan participations with non-System lenders. Net eligible-borrower loan participations peaked in 2010 at $5.4 billion when sales of these par-ticipations were at a low point. The volume of eligible-borrower loan participations purchased from non-System lenders has grown from $6.3 billion in 2011 to $7.5 billion in 2015, and the volume of eligible-borrower loan participations sold to non-System lenders was $2.6 billion in 2015, down from $3.0 billion the year before. However, this figure is up from $1.2 billion in 2010.
In addition to participating in loans to eligible borrowers, FCS institu-tions have the authority to work with non-System lenders that originate “entity” loans. A
similar-entity borrower is not eligible to bor-row directly from an FCS institution, but because the borrower’s operation is similar in function to that of an eligible borrower’s operation, the System has authority to participate in the borrower’s loans (the partici-pation interest must be less than 50 percent).
The System had $13.2 billion in net similar-entity loan participations as of December 31, 2015, up from $11.4 billion the prior year. As figure 6 indicates, the volume of similar-entity
participations that System institu-tions sell to non-System instituinstitu-tions is relatively small, amounting to $700 million or less each year over the past six years.
AgDirect, LLP
AgDirect is a point-of-sale agricul-tural equipment financing program developed by Farm Credit Services of America, ACA, which is affiliated with AgriBank, FCB. AgDirect allows System institutions to participate in retail installment loans or leasing contracts originated by equipment
dealerships. The program enhances financial options for borrowers and institutions, and provides an addi-tional revenue stream to AgDirect owners and AgriBank.
In 2015, FCA approved invest-ments by an additional three Sys-tem associations, bringing the total number of institutions participating in AgDirect to 16. AgDirect financ-ing is now available in many states. As of December 31, 2015, the total outstanding participation interests in loans purchased was $3.2 billion.
Figure 6
Loan participation transactions with non-System lenders, 2010 – 2015
As of December 31
Dollars in billions
Farm debt and market
shares
The U.S. Department of Agriculture’s estimate of total farm business debt for the year ended December 31, 2015, was $364 billion, up 5.4 percent from its $346 billion estimate for year-end 2014.8
USDA estimates that, from 2005 to 2015, total farm business debt rose
by more than $155 billion, or 74 percent. (See figure 7.) In inflation-adjusted dollars, this is an increase of $104 billion, or 46 percent. During this period, farmers invested heavily in new capital items, and they took on more debt to cover rising farm production costs.
Farm real estate debt grew more slowly in 2015 than it did in 2014. Producers were discouraged from
investing in farmland, as well as farm equipment and structures, because of lower prices for major crops and tighter livestock margins. However, non-real estate debt grew faster than farm real estate debt because many farmers needed to bor-row to cover their production costs. On the supply side, lenders had suf-ficient funds to lend in 2015. Even with the prospect of weak
live-Figure 7
U.S. farm business debt, 1990 – 2015
Dollars in billions
Note: Figure shows year-end estimates.
Source: FCA’s Office of Regulatory Policy, based on data from USDA, Economic Research Service.
8. USDA calculates market share for farm business debt only (i.e., debt that is used for farm production and real estate purposes). The estimate for 2015 debt held by the various lender groups will be released in August 2016. Market share information is not available for the other portions of the System’s portfolio, such as agribusiness lending, rural utility lending, or rural home lending.
stock and crop revenues, demand for credit could be strong again in 2016 because of the greater need to finance farm production expenses. However, a significant rise in farm interest rates could weaken demand for credit.
The most current market share infor-mation from USDA is for year-end 2014. USDA’s estimate of debt by lender shows that the System held
39.6 percent of total farm business debt, while commercial banks held 41.7 percent. (See figure 8). Before stabilizing in recent years, the Sys-tem’s market share for farm business debt was growing faster than the commercial banks’ share.
Except for brief periods, the FCS has typically had the largest market share of farm business debt secured by real estate. At year-end 2014, the
System held 45.2 percent of this debt, compared with 37.3 percent for com-mercial banks.
Commercial banks have historically dominated non-real estate farm lend-ing. At year-end 2014, commercial banks held 47.5 percent of this debt, and the System held 32.2 percent.
Figure 8
Estimated market shares of U.S. farm business debt, 1990 – 2015
Serving Young, Beginning, and Small
Farmers and Ranchers
The Farm Credit Act requires Farm Credit System banks and associa-tions to have programs to provide financially sound and constructive credit and related services to young, beginning, and small (YBS) farmers and ranchers. Loans to YBS borrow-ers can help individuals enter the agriculture industry, and they can help smooth the transition of farm businesses from one generation to the next. They also allow System institutions to serve a more diversi-fied customer base — from very small to very large operations, from producers of grain staples for export to producers of organic foods for local and regional food markets. At FCA, we are strongly committed to ensuring that the System fulfills its responsibility to serve all creditwor-thy producers, including those who are young, beginning, or small. We support the YBS mission through our regulatory activities, data collection and reporting, disclosure require-ments, and examination activities. We define young farmers as those who are 35 years of age or younger, beginning farmers as those who have 10 years or less of experience at farming or ranching, and small farm-ers as those who normally have gross annual sales of less than $250,000. These criteria apply to the date on which a loan is made.
Characteristics of YBS
producers
Generally, the shares of Systemwide total farm lending going to the three separate YBS categories have been consistent with the shares of these farmer segments in the total farmer population. The smallest share of total System farm lending goes to the young farmer segment, and the largest share goes to the small farmer segment. Below, we look at some trends in these categories, then we discuss the System’s lending to YBS borrowers.
Young
According to the 2012 Census of Agriculture, less than 6 percent of all principal farm operators and just over 8 percent of all operators (pri-mary, secondary, and tertiary opera-tors) were under 35 years of age in 2012.9 These percentages have held relatively constant from 2002 to 2012. Demographic data generally show the share of those under 35 has been relatively stable over the past decade, while median or average ages have generally been rising.
Beginning
The Census of Agriculture data show a steady decline in the share of prin-cipal farm operators who have been on their farms for less than 10 years. Of the 2.1 million principal operators in 2012, 22 percent had been on their
farms for less than 10 years. Thirty years ago, that percentage was much higher: 38 percent of all principal operators in 1982 had been on their farms for less than 10 years.
Small
U.S. farms have been consolidating for generations as new technolo-gies have increased productivity and reduced the number of farmers needed. From 1982 to 2012, the share of total farms considered to be small farms — those with $250,000 or less in farm sales — declined from 96 percent to 88 percent. Commodity price inflation, particularly since the mid-2000s, has contributed to this decline, with total farm revenues and average sales per farm rising.
FCS lending to YBS
borrowers
The Farm Credit Act stipulates that each System bank must have writ-ten policies that direct each associa-tion board to have a program for furnishing sound and constructive credit and financially related services to YBS farmers. Associations must also coordinate with other govern-ment and private sources of credit in implementing their YBS programs. In addition, each institution must report yearly on the lending volume, operations, and achievements of its YBS program. (See the YBS Programs section on page 32.)
FCA regulations require each System lender’s YBS program to include a mission statement that describes the program’s objectives and specific means to achieve the objectives. The regulations also require each pro-gram to include annual quantitative targets for credit to YBS farmers; these targets should be based on reliable demographic data for the institution’s lending territory. YBS programs must also include outreach efforts and annual qualitative goals for offering credit and related ser-vices that are responsive to the needs of YBS farmers.
The association’s board oversight and reporting are integral parts of each YBS program. Each association’s operational and strategic business plan must include the goals and tar-gets for YBS lending. And each asso-ciation must have an internal control program to ensure proper implemen-tation and management of the YBS program; it must also have methods in place to ensure that credit is pro-vided in a safe and sound manner and within the lender’s risk-bearing capacity.
FCA’s oversight and examination activities encourage System institu-tions to assess their performance and market penetration in the YBS area.
This self-assessment increases each institution’s awareness of its mission and prompts it to allocate resources to serve the YBS market segment. In addition, we continuously consider ways to support and strengthen the System’s YBS programs. For example, we issued an Informational Memorandum to System associations in 2014 to outline ways they can enhance their service to YBS farmers through loan programs provided by USDA’s Farm Service Agency. Please note that, because the YBS mission is focused on each borrower group separately, data are reported separately for each of the three YBS categories. Since some loans fit more than one category, adding the loans across categories does not produce an accurate measure of the System’s YBS lending involvement.
System’s YBS lending in 2015
10The number and volume of loans made during the year is an indicator of the extent to which System institu-tions are serving YBS farmers. Table 4A contains information on loans made in each category during the year; table 4B provides information on loans outstanding at the end of 2015. Loans and commitments to YBS farmers include real estate mortgages and production and
intermediate-term credits, but do not include rural home loans.
Relative to 2014, the number of new loans made and the dollar volume of new loans made to YBS farmers rose in 2015. The number and dollar vol-ume of loans outstanding in all three YBS categories also increased in 2015 from the number and dollar volume in 2014.
Young — The System made 62,143
loans, amounting to $9.4 billion, to young farmers in 2015. The dol-lar volume and the number of new loans made to young farmers rose 8.0 percent and 5.1 percent, respectively, from 2014.
Beginning — The System made
79,642 loans, amounting to $12.7 bil-lion, to beginning farmers in 2015. The dollar volume and the number of new loans made to beginning farmers rose 12.2 percent and 7.5 percent, respectively, from 2014.
Small — FCS institutions made
150,022 loans, totaling $11.8 billion, to small farmers in 2015. The dollar volume and number of new loans made to small farmers rose 10.0 per-cent and 6.7 perper-cent, respectively.
10. System data on service to YBS farmers and ranchers cover the calendar year and are reported at year-end. The statistics show loans made during the year (both number of loans and dollar volume of loans), as well as loans outstanding at year-end (both number and dollar volume). The volume measure includes loan commitments to borrowers, which typically exceed actual loan advances. Borrowers may have more than one loan; thus the loan numbers reported here do not directly measure the number of borrowers.
Table 4A
YBS loans outstanding
As of December 31, 2015
Percentage Percentage
of total Dollar of total
Number number volume
of of System of loans of System volume Averageloan
loans farm loans in millions farm loans size
Young farmers/ranchers 188,696 18.1 $27,070 11.0 $143,458 Beginning farmers/ranchers 274,942 26.4 $41,473 16.9 $150,844 Small farmers/ranchers 502,398 48.2 $46,729 19.0 $93,012
Table 4B
YBS loans made during 2015
As of December 31
Percentage Percentage
of total Dollar of total
Number
of of System number of loans volume of System volume Averageloan
loans farm loans in millions farm loans size
Young farmers/ranchers 62,143 17.2 $9,430 11.3 $151,749 Beginning farmers/ranchers 79,642 22.0 $12,741 15.2 $159,938 Small farmers/ranchers 150,022 41.4 $11,815 14.1 $78,754
Sources: Annual Young, Beginning, and Small Farmer Reports submitted by each System lender through the Farm Credit banks.
Note: A “young” farmer/rancher is defined as 35 years old or younger when the loan is made; a “beginning” farmer/rancher has been operating a farm for not more than 10 years; and a “small” farmer/rancher generates less than $250,000 in annual sales of agricultural or aquatic products. Since the totals are not mutually exclusive, one cannot add across young, beginning, and small categories to count total YBS lending. Also, the totals listed in tables 4A and 4B include loans, advancements, and commitments to farmers, ranchers, and aquatic producers, and exclude rural home loans, loans to coopera-tives, and activities of the Farm Credit Leasing Services Corporation. In 2015, the Farm Credit System made 362,125 new farm loans, totaling $83.781 billion. As of December 31, the System had 1,042,171 farm loans outstanding, amounting to $245.550 billion.
Comparing the System’s YBS
lending with overall lending
In 2015, the pace of new lending to YBS farmers equaled or exceeded the pace in overall System lending to farmers.11 Therefore, the share of newtotal System farm loan volume and loan numbers made to all three YBS categories equaled or rose from that of 2014.
In recent years, the total share of new System farm loans (in terms of loan numbers) made to young and beginning farmers has been slowly rising. For young farmers, the share rose to 17.2 percent in 2015 from 16.9 percent in 2014, and the share for beginning farmers rose to 22.0
percent from 21.2 percent in 2014. (See figures 9A and 9B.) The percent-ages for both categories were the highest since 2001, when the current reporting started. The total share of new System farm loan volume made to young and beginning farmers has been more stable in recent years around 11 percent for young farmers and 15 percent for beginning farmers. The share of total new System loans made to small farmers rose in 2015 to 41.4 percent, up from 40.2 per-cent in 2014. (See figure 9C.) After trending down since the mid-2000s, the share of total new loan counts made to small farmers has now risen for the past two years. The share of
total 2015 farm loan volume made to small farmers increased slightly in 2015 to 14.1 percent from 13.9 per-cent in 2014.
One of the reasons the small farmers�