Evidence Report 83
March 2014
Working Futures
2012-2022
Wo
Rob W
Warw
Rach
Camb
UK C
Marc
orkin
Wilson
wick Institu
hel Beaven
bridge Eco
Commissio
ch 2014
ng Fu
ute for Em
n, Mike Ma
onometric
on for Emp
uture
mployment
ay-Gillings
cs
ployment
es 20
t Researc
s, Graham
and Skills
12-20
ch
m Hay, Jam
s
022
mes Stevens
Working Futures 2012-2022
Foreword
The UK Commission for Employment and Skills is a social partnership, led by Commissioners from large and small employers, trade unions and the voluntary sector. Our ambition is to transform the UK’s approach to investing in the skills of its people as an intrinsic part of securing jobs and growth. Our strategic objectives are to:
Maximise the impact of employment and skills policies and employer behaviour to support jobs and growth and secure an internationally competitive skills base;
Work with businesses to develop the best market solutions which leverage greater investment in skills;
Provide outstanding labour market intelligence which helps businesses and people make the best choices for them.
The third objective, relating to intelligence, reflects an increasing outward focus to the UK Commission’s research activities, as it seeks to facilitate a better informed labour market, in which decisions about careers and skills are based on sound and accessible evidence. Relatedly, impartial research evidence is used to underpin compelling messages that promote a call to action to increase employers’ investment in the skills of their people.
Intelligence is also integral to the two other strategic objectives. In seeking to lever greater investment in skills, the intelligence function serves to identify opportunities where our investments can bring the greatest leverage and economic return. The UK Commission’s first strategic objective, to maximise the impact of policy and employer behaviour to achieve an internationally competitive skills base, is supported by the development of an evidence base on best practice: “what works?” in a policy context.
Our research programme provides a robust evidence base for our insights and actions, drawing on good practice and the most innovative thinking. The research programme is underpinned by a number of core principles including the importance of: ensuring ‘relevance’ to our most pressing strategic priorities; ‘salience’ and effectively translating and sharing the key insights we find; international benchmarking and drawing insights from good practice abroad; high quality analysis which is leading edge, robust and action orientated; being responsive to immediate needs as well as taking a longer term perspective. We also work closely with key partners to ensure a co-ordinated approach to research.
Working Futures 2012-2022
This current report presents the fifth in a series of results from Working Futures, the UK Commission’s labour market model. The model is the most detailed and comprehensive of its kind for the UK, providing a picture of employment prospects by industry, occupation, qualification level, gender and employment status for the UK and for nations and English regions up to 2022. This report makes an important contribution to our understanding of likely trends in the labour market in the medium to longer term, along with the report of our foresight study The Future of Work: Jobs and Skills in 2030. The results contained in this report, together with the extensive range of supporting outputs and data that is available, offer a useful basis for reflection and debate among all those with an interest in future prospects for jobs; including individuals who are considering their careers choices, employers, education and training providers, as well as national and local policymakers.
As with all projections and forecasts, the analysis presented in Working Futures should be regarded as being indicative of likely trends and orders of magnitude, given a continuation of past patterns of behaviour and performance, rather than precise forecasts of the future. The results should not be seen as definitive and should be used in conjunction with other sources of intelligence about the labour market.
Sharing the findings of our research and engaging with our audience is important to further develop the evidence on which we base our work. Evidence Reports are our chief means of reporting our detailed analytical work.
But these outputs are only the beginning of the process and we are engaged in other mechanisms to share our findings, debate the issues they raise and extend their reach and impact.
We hope you find this report useful and informative. If you would like to provide any feedback or comments, or have any queries please e-mail [email protected], quoting the report title or series number.
Lesley Giles
Deputy Director
Working Futures 2012-2022
Preface and Acknowledgements
The authors are grateful to the UK Commission for sponsoring this research. Special thanks are due to the project advisory group for their comments, comprising: James Carey (Welsh Government), Urvashi Parashar (Department for Business, Innovation & Skills), Eilidh Totten and Stuart King (Scottish Government); Tracy Power, Orla Flanagan and Alan Ramsey (Department for Employment and Learning Northern Ireland); and Peter Glover (UK Commission). This report has been a team effort, involving a large number of people. Rachel Beaven, Mike May-Gillings, Graham Hay, James Stevens, Ragini Madan, Jamie Pirie and Shyamoli Patel from Cambridge Econometrics, together with Andrew Holden, Peter Millar and Luke Bosworth from The Institute for Employment Research all made important contributions to the data analysis and processing. Derek Bosworth was responsible for developing key elements of the modelling of the supply of qualifications. David Owen was responsible for drafting the spatial results set out in Annex (E). The responsibility for the views expressed and for any remaining errors lies with the authors.
The projections should be regarded as indicative of likely developments for the economy and the labour market given a gradual recovery from recession and re-establishment of longer term trends, rather than precise forecasts of what will inevitably happen. Many of the trends presented are very robust and are not likely to be affected by even the very turbulent conditions experienced over the past 5 years. It presents a view of medium to longer term trends (5-10 years ahead), reflecting the likely path of recovery from recession and a gradual re-establishment of longer-term trends. These issues are elaborated in more detail in the main body of the report. The results should be regarded as a robust benchmark for debate and used in conjunction with a variety of other sources of Labour Market Information. The opinions expressed in this report are those of the authors and do not necessarily reflect the views of the UK Commission.
Table of Contents
Glossary ... viii
Executive Summary ... ix
Working Futures ... ix
Key findings ... x
1
Introduction and Background ... 1
1.1 Background ... 1
1.2 Rationale for the Working Futures projections ... 2
1.3 Aims and objectives ... 4
1.4 General methodological approach and data sources ... 5
1.5 Outline and structure of the report ... 6
2
Macroeconomic and General Labour Market Context ... 7
Key messages ... 7
2.1 Introduction ... 7
2.2 Exogenous assumptions ... 8
2.3 Macroeconomic context ... 9
2.3.1 World Economy and Exchange Rates ... 9
2.4 UK Domestic Spending and Inflation... 10
2.5 Employment and Output ... 13
2.6 General labour market prospects ... 15
2.6.1 Population and the Labour Force ... 15
2.7 Employment ... 18
2.7.1 Employment by Gender and Status ... 21
2.7.2 Claimant Count and ILO Unemployment ... 25
2.8 Macroeconomic uncertainties ... 26
2.8.1 The strength of the eurozone recovery ... 26
2.8.2 Long-term unemployment in the UK ... 26
2.8.3 UK deficit reduction measures ... 27
2.8.4 UK asset prices ... 27
2.8.5 The strength of the recovery of UK business investment ... 27
2.8.6 Referenda on political union ... 27
2.9 Comparison of forecasts ... 28
3
Sectoral Output and Employment Prospects ... 30
3.1 General prospects ... 30
3.2 Prospects by broad sector ... 38
3.2.1 Primary Sector & Utilities ... 38
3.3 Manufacturing ... 42
3.4 Construction ... 45
3.5 Trade, Accommodation & Transport ... 46
3.6 Business & Other Services ... 50
3.7 Public administration, health and education ... 53
4
Changing Occupational Structure and Replacement Demands ... 57
Key Messages... 57
4.1 Introduction and general approach ... 58
4.2 Changes for broad occupational groups: History and projections ... 62
4.3 Occupational trends by gender /status ... 76
4.4 Replacement demands ... 78
4.5 More detailed occupational projections (SOC sub-major groups) ... 82
4.6 Components of occupational change ... 86
4.7 Detailed occupational changes within industries ... 93
5
Implications for Qualifications ... 96
Key Messages... 96
5.1 Introduction and general approach ... 96
5.2 Supply trends ... 104
5.3 Demand for formal qualifications ... 110
5.4 Reconciliation, imbalances and mismatches ... 116
5.5 Concluding Remarks ... 118
Tables and figures
Table 2.1: Macroeconomic Indicators for the UK ... 12
Table 2.2: Population and Labour Force in the UK ... 16
Table 2.3: Employment Status, 2012-2022 ... 22
Table 3.1: Output by Broad Sector, 2012-2022 ... 31
Table 3.2: Employment by Broad Sector, 2012-2022 ... 37
Table 4.1: Occupational Categories, SOC2010 – Major Groups ... 66
Table 4.2: Females. Occupational Categories, SOC2010 – Major Groups ... 67
Table 4.3: Males, Occupational Categories, SOC2010 – Major Groups ... 68
Table 4.4: Changing Composition of Employment by Occupation, 1992-2022... 75
Table 4.5: Expansion and Replacement Demand by Occupation, 2012-2022 ... 85
Table 4.6: Total Occupational Employment, 2002-2012, UK: All Industry Sectors ... 90
Table 4.7: Total Occupational Employment, 2012-2022, UK: All Industry Sectors ... 91
Table 5.1: Total numbers by qualification (total population 16+, 000s) ... 107
Table 5.2: Economically active population by qualification level (16+, 000s) ... 107
Table 5.3: Unemployed by qualification level (16+, 000s) ... 107
Table 5.4: Unemployment rates by qualification level (%) ... 108
Table 5.5: Share of total unemployment by qualification level (16+, 000s) ... 108
Table 5.6: Employment by qualification level (residence / heads, 16+, 000s) ... 108
Table 5.7: Employment by qualification level (workplace / jobs, 000s) ... 109
Table 5.8: Changing qualification pattern of employment (workplace / jobs, % of total) .... 111
Figure 2.1: Population, Unemployment and Labour Force Trends, 1981-2022 (000s) ... 15
Figure 2.2: Changes in Key Labour Market Indicators for the UK, 2012-2022 (000s) ... 17
Figure 2.3: Changes in Employment by Status, UK, 2012-2022 (000s) ... 23
Figure 2.4: Employment Trends by Gender and Status 1982-2022 (000s) ... 23
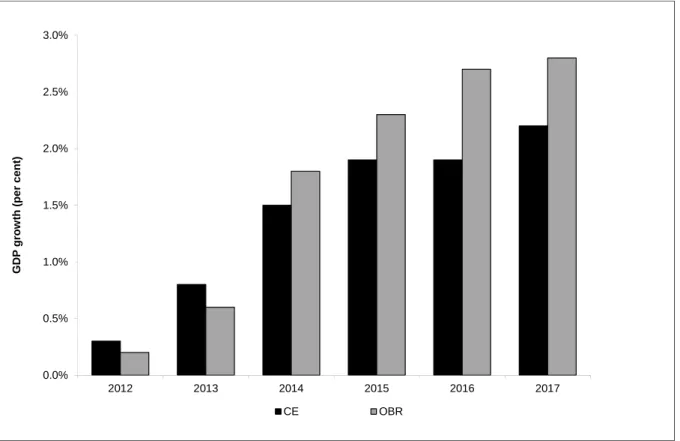
Figure 2.5: Comparison of CE and OBR GDP forecasts ... 29
Figure 3.1: Output growth by Broad Sector, 1990-2020 (per cent per annum) ... 33
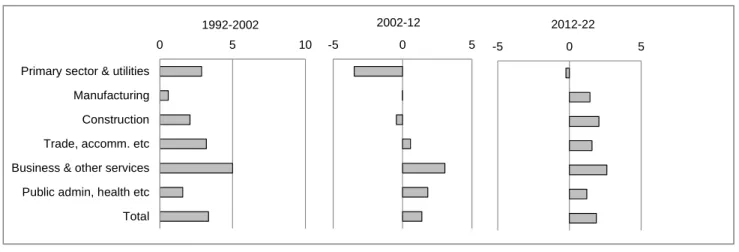
Figure 3.2: Employment growth by Broad Sector, (per cent p.a.) ... 33
Figure 3.3: Employment growth by Broad Sector, (000s) ... 34
Figure 3.4: Output by Broad Sector (£m) ... 39
Figure 3.5: Employment Profiles by Broad Sector (000s) ... 40
Figure 4.1: Changes in Occupational Employment Structure (000s), 1992-2022 ... 65
Figure 4.2: Occupational Trends (000s), 1992-2022 ... 69
Figure 4.3: Occupational Trends (% shares) 1992-2022 ... 70
Figure 4.4: Occupational Change by Gender, 2012-2022, Total Employment (000s) ... 71
Figure 4.5: Occupational Change by Status, 2012-2022, Total Employment (000s) ... 72
Figure 4.6a: Occupational Change by Status, Males, 2012-2022 (000s) ... 73
Figure 4.7: Detailed changes by occupation (000s) ... 89
Figure 4.8: Net Requirements by SOC2000 Sub-major Group, 2012-2022 ... 92
Figure 4.9: Occupational change 2012-2022, across the 22 Industries ... 95
Figure 5.2: Changing qualification pattern of employment (workplace / jobs, % of total) .. 112
Figure 5.3: Qualification pattern of employment by occupation, 2012 (workplace / jobs, % of total) ... 113
Figure 5.4: Changing qualification pattern of employment by sector, 2012-2022 (workplace / jobs, % of total) ... 114
Figure 5.5: Spatial Variations in Employment Patterns by Qualification, 2012-2022 ... 115
Figure 5.6: Reconciling demand and supply in 2020– increasing qualification intensity by occupation (workplace / jobs, % of total)... 117
Boxes
Box 1.1: The rationale for Working Futures projections ... 3Box 2.1: Definitions of Employment and Related Labour Market Indicators ... 19
Box 4.1: Drivers of Occupational Change ... 60
Box 4.2: Replacements Demands: Definitions and Methods... 81
Box 4.3: Shift-share analysis of occupational change ... 87
Box 5.1: The Qualifications and Credit Framework (QCF) ... 100
Glossary
BRICs - Brazil, Russia, India and China
CE – Cambridge Econometrics
IER – Institute for Employment Research, University of Warwick
LMI for All – UKCES project to make labour market information (LMI) data freely available for careers guidance and advice
MDM - CE’s detailed multi-sectoral dynamic macroeconomic model (MDM-E3).
MDM C132F1A (revision 12015) - CE projections conducted in July 2013
MINT – Mexico, Indonesia, Nigeria and Turkey
MINTs – Mexico, Indonesia, Nigeria and Turkey
NQF - National Qualification Framework
QCF - Qualifications and Credit Framework
Replacement demand – job openings created by those leaving the labour force.
SIC – Standard Industry Classification
SOC– Standard Occupational Classification
Terminology for quarters, etc - 2012Q1 = first quarter of 2012, etc
Working Futures 2012-2022 - the latest in a long series of quantitative assessments of UK employment prospects over a ten year horizon.
Executive Summary
Working Futures
Working Futures 2012-2022 is the latest in a series of quantitative assessments of the employment prospects in the UK labour market over a ten year horizon. It presents historical trends and future prospects by sector for the UK and its constituent nations and the English regions. The prime focus of Working Futures is on the demand for skills as measured by employment by occupation and qualification, although the supply side is also considered. Its prime objective is to provide useful labour market information that can help to inform policy development and strategy around skills, careers and employment, for both policy makers and a much wider audience. The results are intended to provide a sound statistical foundation for reflection and debate among all those with an interest in the demand for and supply of skills. This includes individuals, employers, education and training providers, as well as the various agencies and departments of government.
Sectoral change is one of the key drivers of the changing demand for skills. The main analysis focuses on broad sectors, but this is built up from a much more detailed picture of change by industry. The projections are based on the use of a multi-sectoral, regional macroeconomic model, combined with occupational, replacement demand and qualification modules. The results take account of the latest official data published by the Office for National Statistics. These data are used to paint a comprehensive and detailed picture of the changing face of the UK economy and labour market. A separate Technical Report (Wilson et al. 2014) provides full details of sources and methods used to produce the results, including information about even more detailed sub-national / sub-regional results.
The future cannot be predicted with precision or certainty. But all the participants in the labour market make plans for the future. The rationale behind Working Futures is that a comprehensive, systematic, consistent and transparent set of projections can help to inform everyone about the world they are likely to face.
It is important to emphasise that the view presented here is not the only possible future. It represents a benchmark for debate and reflection that can be used to inform policy development and other choices and decisions. The detailed projections present a carefully considered view of what the future might look like, assuming that past patterns of behaviour and performance are continued over the longer term. The results should be regarded as indicative of general trends and orders of magnitude and are not intended to be prescriptive. If policies and patterns of behaviour are changed then alternative futures can result.
Key findings
Working Futures 2012-2022 provides a comprehensive and detailed picture of the UK labour market, focusing on employment prospects for up to 75 industries, 369 occupations, 6 broad qualification levels, gender and employment status.
The latest results indicate:
a slow but steady recovery from recession, with around 1.9 million additional jobs by 2022 compared with 2012;
significant increases in the size of the working age population and the economically active workforce but with a slight decline in overall labour market participation rates, reflecting the aging of the population;
some rebalancing of the economy is expected as a direct consequence of fiscal retrenchment, with a marked shift away from employment in public sector activities, and the share of public administration, health and education in total employment projected to decline from 26 to 25 per cent between 2012 and 2022;
the manufacturing sector is projected to experience a further (albeit small) decline in its share of total employment, from 8 to 7 per cent of the total, despite a recovery in output levels, which enable it to maintain its share of total output (at around 10 per cent);
the main source of recovery in employment levels is expected to continue to be focused in the service sector.
Private services are the main engine of jobs growth, with employment in this part of the economy projected to rise by more than 1.5m (+8 per cent) between 2012 and 2022. Business and other services are the area where employment is expected to grow most rapidly, growing by more than 10 per cent, or 1 million jobs over the same period.
Focussing on skills, as measured by occupation and formal qualifications held, the results suggest a continued trend in favour of more highly skilled, white collar occupations, but with some growth in employment for a number of less skilled occupations too.
Some 2 million additional jobs are projected for occupations such as managers, professionals and associate professional by 2022. Together these occupations are expected to increase their share of total employment from 42 per cent to 46 per cent over the decade.
Lower skilled jobs are also projected to remain a significant component of the labour market. The projections suggest an increase of more than 600,000 jobs in caring, personal and other service occupations (+23 per cent) and more modest increases in numbers of some jobs for elementary occupations over the decade (although overall this group see a slight decline of 67,000 jobs, -2 per cent). Most of this employment growth is focussed in service-based areas, especially related to health care.
In contrast, for many blue collar jobs such as skilled and semi-skilled manual roles in skilled trade occupations and process, plant & machine operatives further job losses are expected, reflecting a combinations of structural change in terms of sectoral employment combined with technological and organisational changes within the sectors in which such jobs are concentrated. Around 500,000 such manual jobs are forecast to disappear over the decade to 2022, reducing their employment share from 17 per cent to 15 per cent.
It is not just blue collar jobs that are under threat. The continuing impact of information and communications technology on the way office and related tasks are carried out means that many administrative, clerical and secretarial jobs are expected to disappear. In total, a loss of almost 500,000 jobs in these occupations between 2012 and 2022 is projected (around 13 per cent). Nevertheless, this area of employment will remain important, still accounting for around 3 million jobs in this occupational area in 2022. This amounts to about 10 per cent of total employment compared to 12 per cent in 2012.
This highlights the importance of not just focusing on projected changes in employment levels. Even in areas where employment is expected to decline there will often be many new job openings and the need to recruit and train new entrants to replace those leaving the workforce for retirement or other reasons.
Job openings created by those who leave the labour market (so called replacement demands) are projected to generate around 12 million job openings over the decade. This is much higher than the 1.8 million openings from the creation of new jobs. Replacement demands results in job openings in all industries and occupations, including those in which the net level of employment is expected to decline significantly. This has important implications for individuals who may be considering their future career and education and training options, since even those occupations where employment is projected to decline may still offer good career prospects.
The other key measure of skills used in Working Futures is qualifications. The numbers of people holding formal qualifications who are economically active is projected to continue to rise. The supply of people holding higher level qualifications such as degrees is projected to grow steadily to 2022, despite the rising costs of attending university. The proportion of the labour force who are unqualified is expected to represent only a small minority by 2022.
Measuring the demand for formal qualifications is more difficult. The number of jobs in occupations typically requiring a high level qualification is expected to continue to grow, albeit more slowly than over the previous decade. It is projected that the supply of high qualified people will grow more quickly than demand for such qualifications, as implied by projections of the patterns of employment by qualification level within industries and occupations. This suggests there will be an increase in qualification intensity within those occupations that have not previously employed higher level qualifications, since this is where there is more scope for increase (rather than in those occupations in which the workforce is already highly qualified, such as professionals). This is not necessarily indicative of excess supply of such qualifications. The nature of jobs may be changing to make higher qualifications more necessary.
Turning to the geographical dimension of the results, the projection suggest that the southern part of England will continue to benefit more from the recovery than other parts of the country. Almost half of the growth in jobs in higher level occupations will occur in London, South East England and the East of England. The remainder of England, and the other nations of the UK are expected to see a recovery in employment levels, but they all fall further behind in relative terms over the coming decade.
W p T m T e g E
1
1.1
Since t UK eco conside Eurozo substan here is followin Chapte new set The re i. ii. iii. Chapte the con Working Fu prospects ca The rationa market abou The results employment gender and English regiIntrod
Backgro
he previous onomies ha erable unce ne has bee ntial upturn one of a g ng previous r 2 explores t of projectio port focuse Where will What are t qualification How does t r 3 focuses ntributions tures 2012-arried out e le for carry ut the world s paint a t prospects employme onsduction
ound
s Working ave gradual ertainty rem en averted in terms of gradual upt recessions s the remai ons for thes on three m the jobs of the implicat n? this compar s on prospec they are li -2022 is the every 2-3 ye
ying out suc they may f comprehen s in the UK ent status,
n and B
Futures rep ly recovere mains, the and econom f both outpuurn, but wit . ning uncert UK. main questi the future b tions of this re with deve cts for the d kely to ma e 5th in seri ears since 2 ch work is face and to nsive, cons K, covering including re
Backgr
port (Wilson ed from the latest evi mies such ut and emp th no quick tainties and ions: be concentr s for skill de elopments o different sec ake in gene ies of asses 2002. to inform p stimulate re sistent and g industries esults for tround
n and Hom e worst rec dence sug as the US loyment. Th k return to l sets out th rated in the emand, as on the supp ctors within erating grow ssments of participants eflection an d very det s, occupatio he devolve enidou (20 ession in re ggests that are beginn he benchma long term t he assumpti UK? measured ply side? the UK eco wth and em f UK labour s in the UK nd debate. tailed pic ons, qualifi ed nations a 012)) the wo recent times t the crisis ning to lead ark view pr trends as o ions underly by occupat onomy, con mployment market K labour cture of cations, and the orld and s. While s in the a more resented observed ying this tion and nsidering . It alsoThe projections take account of the latest official employment data, including the results from the labour Force Survey and the emerging findings from the Census of Population. The latest stance of government policy is taken into account by factoring in the consequences of the various government public spending measures and other official policy statements. The projections are based on the Cambridge Econometric (CE) macroeconomic forecasts, produced in the summer of 2013 (produced using MDM - CE’s detailed multi-sectoral dynamic macroeconomic model (MDM-E3), MDM C132F1A (revision 12015), conducted in July 2013). Based on this analysis, the projections indicate what may happen to the structure of employment in the UK – disaggregated by sector, gender, occupation, etc.
1.2
Rationale for the Working Futures projections
The case for a regular and systematic assessment of future skills needs has been set out in previous Working Futures reports as summarised in Box 1.1.
The results presented provide a benchmark for debate and thinking about the future. They should not be regarded as precise forecasts of what will necessarily happen. Rather, they indicate a likely future, given a continuation of past patterns of behaviour and performance.19 If policies and patterns of behaviour are changed then alternative futures might be achieved. The present results provide a consistent and systematic benchmark view across the whole economy and labour market. They are indicative of general trends and orders of magnitude, given the assumptions set out in detail in the main report.
They are not necessarily a substitute for projections produced by/for individual sectors or other interest groups (defined by say spatial area or occupational group). The Working Futures results show how the more detailed results for particular sectors, occupations or regions fit into a broader macroeconomic context, covering all these in a consistent, systematic and comparable manner.
19
Box 1.
The Eu is a ke requirem skills sh skills su More ef to the p growth Futures There is skills b informa decision as educ The ma will eng It is m (individu general Of cour and try like, ev advanta organis include transpa1: The rat
ropean Cou ey respons ments can hortages, he upply develo ffective anti promotion o and jobs, h s series is a s on-going base to su ation is pote ns about ed cation and t ain rationale gage in any ore about uals making lly) to make rse, nobody to prepare ven if it is ages of pro sations andthe fact tha arent set of
tionale for
uncil has co ibility of M make a ke elping to co opments. icipation an of better lab helping to re a key eleme interest am ustain econ entially of in ducation an training prov e for produc kind of det providing i g career ch e better info y can predic for it. In do simply tha oviding such individuals at this appro results. It ar Working
oncluded th Member Sta y contributi ontribute to a nd matching bour utilisat educe both f nt in the UK mongst polic nomic grow terest not ju d training, i viders. cing these tailed, top d information hoices, educ rmed decis ct the future oing so they at the futur h projection to develop oach can p lso benefitsFutures p
hat "Anticipa ates. Comp ion to the id a better ma g of labour m tion and higfrictional an K’s respons cy makers to wth and c ust to policy ncluding ind kinds of pr down, plann to allow i cational an ions. e with certai y adopt ass re will be ns centrally, p their own rovide a co s from econ
projection
ating and m prehensive dentification atching betw market need gher labour nd structura e to this req o ensure th compete in y makers bu dividuals m ojections is ning (or anti ndividual a d training e inty. Most p sumptions a the same as a publi views inde omprehensiv omies of scs
matching lab assessmen n of labour ween labour ds, it is argu productivit l unemploy quest. hat the UK h nternationall ut for all tho aking caree s no longer cipation) of actors throu establishme people can a about what t as the pas c good, rath pendently. ve, methodi cale. bour market nts of futu market tre r market ne ued, can co ty, and ther yment. Thehas the app ly. Howeve ose having ers choices that policy f the labour ughout the ents and em and do mak the future m st. There a her than re These adv ical, consis t needs” re skills nds and eds and ontribute refore to Working propriate er such to make , as well makers market. system mployers ke plans might be are also elying on vantages tent and
Box 1.
A key consiste sectors econom is groun act as changin1.3
Govern informa in policy individu requirem detailed from an setting The his cross-c and reg The mo UKCES1: The ra
advantage ent econom . This is ba mic relations nded in an u an objectiv ng pattern oAims an
ment polic ation to be m y and plann ual career ments, expl d, compreh ny other so out transpa storical data lassified by gions within gender; employmen occupation expansion qualification ore detailed S.tionale fo
of the Wo my wide ov ased on a ships, affect understand ve, econom of skills demd objectiv
cy has pla made freely ning for the choices an loiting avail ensive and ource, while arently how abase and y sector and England. S nt status (fu (one, two a and replace ns (6 broad d results arr Working
orking Futur verview of transparen ting the whoing of the k my-wide, ex mand
ves
aced increa y available a provision o nd decision able official d consisten e recognisin these have the related d a spatial d Summary reull-time/part-and four dig
ement dema QCF levels re available
g Futures p
ures forecas skill needs nt, specific ole econom key drivers i xplanatory asing emph at a more d of education ns. Workin l information t picture of ng the tech e been addr d projection dimension d esults for em -time/self-e git occupatio and, as wel s). e in the Woprojection
sts is that s, allowing set of mac my and its st impinging u tool to fac hasis on t etailed spat n and trainin g Futures n in such a f employme hnical challe essed. ns focus on own to indiv mployment a mployed); onal groups ll as net req orking Futuns (continu
they provid detailed co roeconomic tructure. As upon the ecoilitate the e
the need tial and sec ng, as well 2012-2022 manner as ent patterns enges that n employme vidual coun are reported s); quirements; ures workbo
ued)
de a comm omparisons c assumptio s such, the onomy. It s examination for labour ctoral level t as helping 2 addresse s to produce s than is a this impos ent by occ ntries within d by: and ooks distrib mon and s across ons and analysis erves to n of the market to assist to guide es these e a more available ses, and cupation, the UK, buted byThe analysis also considers the labour and skills supply. Consistent projections of labour supply have been generated by:
gender; and
age (7 broad age groups: 0-15, 16-24, 25-34, 35-44, 45-59,60-64, 65+).
The labour supply projections are also developed distinguishing the highest qualifications held by the working age population and those economically active. These are consistent with results produced by Bosworth (2013a, b and c). By making assumptions about the distribution of unemployment between qualification categories, projections of employment by highest qualification held have also been developed.
1.4
General methodological approach and data sources
The general methodological approach to developing the Working Futures projections has been discussed in previous reports (Wilson and Homenidou, 2012) and is set out in detail in the accompanying Technical Report. (Wilson et al. (2014). It focuses on sectoral and occupational employment structures, qualifications, and general workforce trends (including replacement demand). The approach exploits existing official data, including the Labour Force Survey (LFS), generating more detailed estimates than are available from official sources. Innovations in Working Futures 2012-2022 include the extension of the database to cover the full set of SOC 2010 4 digit occupational categories.
The complete Working Futures database presents a range of historical data and projections that meet the needs of the UK Commission (and those of its partners) for detailed information and intelligence on likely sectoral developments and their implications for skill requirements.
The approach involves the detailed examination of sectoral as well as occupational employment change and their implications for skill requirements at both a micro and macro level. This is based upon the use of a variety of research methods, ranging from complex econometric modelling, to other more qualitative approaches, depending upon the objectives of the work and the nature of the basic data available.
At the heart of the projections is the latest CE multi-sectoral multi-regional macroeconomic forecast. This is used to produce detailed 75 industry projections, for the period 2012-2022, covering all the English regions and the devolved nations of the UK. The 75 industries are classified using the Standard Industrial Classification (SIC2007). Official ONS data on output
Data from the Labour Force Survey and other sources (including the 2011 Census of Population) are used to develop historical measures of the occupational and qualification structure of employment within industries. A combination of econometric methods and judgement is then used to generate projections of these patterns forward to 2022. This is done using the Standard Occupational Classification (SOC2010).
Analysis of labour supply by age and gender is carried out using econometric methods. These are then further disaggregated by formal qualifications held to obtain measures of the supply of skills by highest qualification held as defined by the National Qualifications Framework.
Full details of the approach are set out in the separate Technical Report. (Wilson et al. (2014)). A brief summary is provided in Annex A to the present report. This covers information on the main data sources and methods, econometric analysis and model structure and content.
1.5
Outline and structure of the report
Chapter 2 presents an overview of macroeconomic prospects for the global and UK economies, and the prospects for the UK labour market.20 Chapter 3 assesses the prospects for broad sectors in more detail. Chapter 4 draws out the implications for occupations, including replacement demands. Chapter 5 considers the implications for qualifications, covering both supply and demand.
Annexes to the present report provide technical information about sources and methods, describing how the projections have been produced, as well as how these new projections compare to previous ones. They also cover the development of the 4-digit occupational results and a summary of the spatial results for the devolved nations of Scotland, Northern Ireland and Wales, and the 9 English regions.
A separate Technical Report (Wilson et al. (2014)) goes into the methodological approach and data sources and limitations in much greater detail. This includes a detailed description of the macroeconomic and other models used to generate the projected demand for skills as well as the treatment of skills supply.
20 Results have also been produced for the devolved nations and the regions of England that together make up the UK. These are presented in a separate Annex.
2
Key me The but Ove nex The but at a2.1
The ma employ report. context These p model ( Section projecti macroe the labo key ass Section previouMacro
Conte
essages e overall pic with no qui erall, the nu xt decade. e macroeco the forecas a more detaIntroduc
acroeconom ment and t The analys of the gen projections (MDM-E3). n 2.2 begins ons. The economic pr our market sumptions, n 2.6 conc s set of Wooecono
ext
cture for the ck return to umber of job nomic envir st presented iled level.
ction
mic prospec the labour m ses of the p neral projec are produc s with a bri current sit rospects fo are then su and the m ludes with orking Futuromic an
e UK econo o long term t bs in the U ronment, as d here prov cts for the U market exa prospects fo ctions for th ced using C ef overview tuation is r the UK ov ummarised macroecono a compar res results and Gen
omy over th trends as o K is project s always, re vides a use UK provide mined in m or individua he UK econ CE’s detaile w of the key assessed ver the nex briefly in Se omic uncer rison with are presenteneral L
he next dec bserved fol ted to rise b emains subj eful benchm the contex more detail i al sectors in nomy as a w d multi-sect y exogenou in Section xt 5-10 yea ection 2.4. T rtainties, ar other forec ed in the seabour
cade is one lowing prev by around 1 ject to risks mark to asse xt for the de n subseque n Section 3 whole outlin toral dynam us assumpti n 2.3, dra ars. The genThe sensitiv re discusse casts. Com eparate Ann
Marke
e of gradua vious recess 1.9 million o s and uncer ess ongoing etailed fore ent section can be see ned in this mic macroec ions underl awing out neral prosp vity of the re ed in Sect mparisons w nexes.t
l upturn, sions. over the rtainties, g trends ecasts of s of this en in the section. conomic ying the general pects for esults to tion 2.5. with the2.2 Exogenous
assumptions
The main exogenous variables in MDM-E3 are:
world growth in GDP;
world inflation (GDP deflators and prices of traded goods including oil); UK population and natural resources (including coal, oil and natural gas); current and capital spending of the UK government;
UK tax rates and allowances;
the sterling-dollar and other exchange rates; UK and US interest rates.
In many cases these assumptions are developed at a very detailed level, distinguishing different commodities and types of spending and many parts of the world. In combination, these assumptions drive the path of demand for the output of goods and services produced by the UK at a very disaggregated level.
The design of the model does not impose market-clearing in the labour market, rational or consistent expectations, or a policy reaction function in response to outcomes for target indicators. The model is therefore capable, in principle, of producing scenarios in which certain combinations of assumptions produce an unsustainable outcome (e.g. steadily increasing budget or trade deficits).
However, the case adopted as the basis for these baseline projections represents a sustainable and plausible outcome on the basis of the experience of the recent past and longer term trends.
It draws on the long-term forecasts prepared by CE as part of its regular commercial forecasting services. These projections have been presented to and discussed with subscribers to CE's forecasting services, who represent a broad range of private and public sector organisations.
2.3 Macroeconomic
context
2.3.1 World Economy and Exchange Rates
World GDP growth slowed to an estimated 2½ per cent in 2012 as output in the EU contracted and growth in two of the main motors of the global economy, China and India, was much weaker than in any year during the previous decade. Recent trends in the economic performance of the UK's major trading partners have been positive but the outlook for the global economy remains fragile in the short-to-medium term.
Conditions in the eurozone improved after GDP returned to growth in 2013Q2 and 2013Q3 following six consecutive quarters of negative growth. Rises in consumption and investment were behind the improvement. Industrial production and construction growth remained positive throughout 2013, although retail trade was more volatile. Despite this improvement, unemployment in the eurozone did not fall back in 2013 and youth unemployment remains very high. Labour costs continued to rise over 2013 but at a slowing rate as consumer price inflation eased and labour productivity was largely flat. Eurozone GDP fell by around 1 per cent in 2013 as a whole. However, the pick-up in economic activity has fed into business and consumer confidence, which have risen steadily since 2013Q2, and this should prevent a fall of GDP overall in 2014. However, this relies in part on an expansion in world trade, while deleveraging in the public and private sector will continue to act as a drag.
After flagging a little in 2011, US GDP growth picked up in 2012 as the growth in investment spending strengthened and the contraction in government spending slowed sharply. Following relatively slow growth in 2013Q1, GDP picked up in 2013Q2 and 2013Q3. The pick-up was largely driven by investment, as well as positive contributions from household expenditure and net trade. However, the pace of growth was not as strong as that seen in 2012.
Depressed household demand and continued government measures to tackle high sovereign debt levels are expected to prevent a return in the near future to the rapid global growth seen before the start of the financial crisis. As a result world output growth is expected to remain static in 2013, at 2½ per cent, before picking up a little to 3 per cent in 2014.
In the medium term, global growth will accelerate slowly from this historically slow pace, with strong growth in China, India and the oil-producing countries making a greater contribution to the global economy. GDP growth in the EU will accelerate only very slowly, with the core EU economies expected to experience a further decline in 2014 before returning to modest growth subsequently. The high level of national debt in the US will prevent much acceleration in GDP growth and keep it at or below 2-2¼ per cent pa. Over the long term, world GDP growth is expected to accelerate to 4-4½ per cent pa, with emerging Asia, the newer EU Member States and the economies of some other developing countries leading the way.
Global inflation eased somewhat in 2012, as the effect of commodity price increases in 2011 fell out of the figures. Annual average inflation is estimated to have slowed further in 2013, to 3 per cent, with the steepest falls in the BRICs, as slower economic growth removes inflationary pressures. In the medium term, annual average inflation is expected to stay at around 3 per cent.
2.4
UK Domestic Spending and Inflation
In the UK, domestic demand has remained weak since the recession for several reasons, including falling real wages, rising unemployment and low consumer confidence stemming from weak employment prospects and uncertainty concerning the strength of any economic recovery.
Household spending grew modestly by 1¼ per cent in 2012 (see Table 2.1), driven largely by growth in the purchase of vehicles (14 per cent). While spending on non-durable goods fell in 2012, spending on durable goods (including purchase of vehicles) remained strong. Household spending grew at a similar rate in 2013. Consumers remain uncertain about the strength of the economic recovery, but there was a modest improvement in consumer confidence during 2013H2. The rise in real wages expected in 2014 should support positive but modest growth in household spending in the medium term.
Despite announcements of various public-sector cuts, government consumption saw moderate growth, of 2¼ per cent, in 2012 and it is estimated to have posted slow growth in 2013 as a whole. But public-sector cuts are scheduled to have a greater impact in the short-to-medium term. Government consumption is expected to fall each year over 2013-16 and not return to growth until 2017 when fiscal constraints are expected to be relaxed in the face of strong demand for public services.
Investment growth has generally been weak since the recession because business confidence has been hit by uncertainty about the weak domestic recovery and the continuing eurozone debt crisis. Firms have been more inclined to retain cash reserves and invest cautiously. Limited access to finance has also held back investment, particularly for SMEs. Investment growth slowed in 2013 as falls in government investment largely counterbalanced the growth of investment in dwellings and business investment (where the sharpest increases are expected to be in Manufacturing, Information & communication and Transport & storage).
Until recently business confidence remained low, given the uncertainty surrounding the recoveries in the UK and global economies, but a gradual improvement in confidence is expected to contribute to stronger growth in investment in 2014 and the medium term. It is expected that this will be led by a marked rise in investment by the broad Financial & business services sector and support pick-ups in investment in machinery & equipment and buildings.
Meanwhile, CPI inflation has been above the Bank of England's 2 per cent target since December 2009 but has been fairly stable at around 2½ per cent since 2012Q2. It fell back to 2¼ per cent in October 2013 but is expected to pick up again in the short term as rises in energy costs in late 2013 feed into the annual comparison.
Although inflation remains just above the 2 per cent target and sterling has depreciated sharply, the strength of economic activity continues to dominate the outlook, especially in light of the strong performance of the UK economy in 2013Q2 and 2013Q3. The Monetary Policy Committee has declared its willingness to tolerate above-target inflation in the short-to-medium term with the new Governor of the Bank of England stating that interest rates are unlikely to rise until the rate of unemployment falls to 7 per cent or below. However, the MPC appears increasingly unlikely to tie itself to this one indicator as a measure of inflationary pressure.
Table 2.1: Macroeconomic Indicators for the UK
Historical trends Recent trends Projections
2002-07 2007-12 2009-10 2010-11 2011-12 2012-17 2017-22
GDP at Market Prices (% pa) 3.1 -0.4 1.8 0.8 0.5 1.7 2.5
GVA at Basic Prices (% pa) 3.2 -0.4 1.8 1.0 0.4 1.5 2.3
excl. Extra-Regio (% pa) 3.5 -0.2 1.9 1.3 0.6 1.5 2.3
GVA per capita (% pa) 2.1 -0.5 2.4 1.0 -2.0 1.0 1.6
Manufacturing Output (% pa) 1.6 -1.6 3.8 2.0 -0.8 1.1 1.8
Household Expenditure (% pa) 2.7 -0.6 1.3 -0.9 1.3 1.8 2.3
Employment (jobs, millions) 31.8 32.1 31.3 31.3 32.1 32.8 33.9
Unemployment (claimants, millions) 0.9 1.6 1.5 1.5 1.6 1.4 1.3
CPI Inflation (% pa) 1.9 3.2 3.3 4.5 2.7 2.5 2.2
BP/GDP (%) -2.3 -3.7 -2.5 -1.9 -3.7 -2.4 -2.1
PSNCR/GDP (%) 2.5 13.1 0.3 -2.3 13.1 10.5 11.7
Source: Cambridge Econometrics, MDM revision 12015. Notes:
a) GDP = Gross Domestic Product b) GVA = Gross Value Added c) CPI = Consumer Price Index
d) The balance of payment (BP) and the public sector net cash requirements (PSNCR) are expressed as a percentage of GDP at current prices.
e) Employment, unemployment, CPI, BP/GDP and PSNCR/GDP refer to the last year of the period concerned.
2.5
Employment and Output
Following near zero growth in 2012, GDP began to pick up through 2013, helped by a robust outturn for household spending in 2013Q2, which was sustained in 2013H2 despite a poor trade performance and weak government spending.
With regard to the sectors, a recovery for wholesalers after a poor 2012 allowed the Distribution sector to drive GDP growth in 2013, supported by modest growth of Financial & business services.
Weak global demand for UK exports contributed to a fall in manufacturing output in 2013. Demand from non-EU countries, particularly for niche products, along with a steady improvement in domestic demand is expected to help the sector return to growth in 2014 but medium-term growth will remain modest.
Reduced government investment weighed down on construction output in 2013, but there was a marked pick up in private dwellings work in 2013H2, boosted by the government’s Help to Buy scheme. Further pick-ups in buildings investment are expected to support stronger growth in construction in 2014 and the medium term.
Financial & business services enjoyed only modest output growth in 2013, limited partly by the introduction of new regulations. Output will begin to pick up in the medium term as global demand slowly recovers and firms begin to invest more. However, growth is expected to remain slow by historical standards.
Despite being held back by rises in business rates, the Distribution sector contributed much more to growth in 2013 as wholesalers recovered from a difficult 2012. However, output growth in the sector is expected to be moderate in the medium term.
Similarly, Transport & storage output bounced back in 2013, following a fall in 2012. Uncertainty around the global economy will keep trade and demand for freight services in check in 2014. This is likely to curb growth in the short term, but growth is expected to strengthen in the medium term as the improvements in the domestic and global economies lift demand for Transport services.
In the medium term, total output growth is expected to pick up but remain below trend as the contraction in Public administration weighs down on the economy. Output growth of 2-2½ per cent pa is forecast in the long term as business and consumer confidence gradually improve along with global demand. One reason for this forecast of rather modest growth is the tendency of household spending to grow only weakly.
Total employment in the UK increased by 2½ per cent in 2012, driven by strong growth in two sectors in particular: Accommodation & food services (8 per cent) and Financial & business services (5 per cent). The increase in Accommodation & food services was mainly driven by one-off events such as the Jubilee and the London Olympic and Paralympic Games and so employment declined in 2013 as conditions returned to normal, but modest growth is forecast in the medium term. The increase in Financial & business services employment was most likely due to the greater degree of stability in global markets during 2012. Within the eurozone, some stability was given by Mario Draghi’s pledge in July 2012 to do ‘whatever it takes’ to save the euro. The forecast for 2013 and 2014 indicates continued employment growth in Financial & business services, albeit at a more moderate rate of between 1 per cent and 2 per cent.
An overall fall of ¼ per cent in employment in Public administration, education, health and social work in 2012 is unsurprising given the continued deficit reduction programme. A small increase in employment in 2013 provided some respite, but this is expected to be followed by further falls in the short and medium term as the deficit reduction programme deepens in a bid to make an additional £11.5bn in savings by 2016 (on top of the reduction in public spending that had already been announced).
The other sector that saw a large decline in employment in 2012 was Construction. The government has announced several initiatives designed to boost house building and infrastructure work. This appears to be bearing some fruit and so the construction industry is likely to see robust employment growth in the medium term, but skills shortages remain an issue.
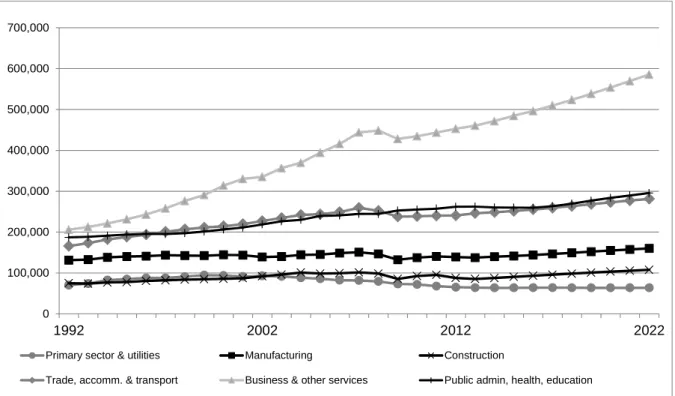
Services sectors, such as Information & communications, are likely to see the strongest employment growth in the medium term. In contrast, Manufacturing and Agriculture are forecast to see further declines in employment, albeit only modest falls in Manufacturing.
In the long term, Construction is expected to see the strongest rate of employment growth, particularly over 2017-22, and faster than the average for the whole economy. In view of the planned continuation of deficit reduction, employment in government services is forecast to grow only weakly, by about ¼ per cent pa over 2012-22. Continued declines are forecast for manufacturing, mining & quarrying and agriculture. Prospects by sector are discussed in more detail in Section 3 below.
2.6
General labour market prospects
2.6.1 Population
and the Labour Force
Over the period 2002-12, the UK total resident population increased by 4.4 million (7.3 per cent) to 63.7 million (see Figure 2.1). Most of this increase came in the 2007-12 period. This was reflected in a 9.3 per cent increase (2002-12) in the size of the labour force, which rose by 2.7m to 31.8 million by 2012.
Figure 2.1: Population, Unemployment and Labour Force Trends, 1981-2022 (000s)
Source: Cambridge Econometrics, MDM revision 12015 0 10,000 20,000 30,000 40,000 50,000 60,000 70,000 80,000 1981 1991 2001 2011 2021
Table 2.2: Population and Labour Force in the UK
percentage change over
period 2002 2007 2012 2017 2022 2002-2007 2007-2012 2012-2017 2017-2022 Male Population 28,952 29,868 31,304 32,713 33,984 3.2 4.8 4.5 3.9 Population 16+ 22,917 23,924 25,169 26,229 27,149 4.4 5.2 4.2 3.5 Labour Force 15,734 16,654 17,155 17,744 18,284 5.8 3.0 3.4 3.0 Activity Rate 69 70 68 68 67 1.4 -2.1 -0.7 -0.5 ILO Unemployment 901 905 1,428 1,586 1,652 0.5 57.8 11.1 4.1 Employment (headcount) 14,834 15,749 15,726 16,158 16,632 6.2 -0.1 2.7 2.9 Labour Market Residual (2) 1,137 1,141 1,282 1,150 1,150 0.0 0.0 0.0 0.0 Jobs = headcount + residual 15,970 16,890 17,008 17,308 17,782 5.8 0.7 1.8 2.7
Female Population 30,368 31,121 32,374 33,593 34,736 2.5 4.0 3.8 3.4 Population 16+ 24,613 25,451 26,525 27,405 28,208 3.4 4.2 3.3 2.9 Labour Force 13,308 14,059 14,636 15,372 15,753 5.6 4.1 5.0 2.5 Activity Rate 54 55 55 56 56 2.2 -0.1 1.6 -0.4 ILO Unemployment 615 685 1,068 1,346 1,106 11.4 55.8 26.1 -17.8 Employment (headcount) 12,693 13,374 13,568 14,026 14,647 5.4 1.5 3.4 4.4 Labour Market Residual (2) 1,520 1,561 1,535 1,454 1,504 0.0 0.0 0.0 0.0 Jobs = headcount + residual 14,213 14,935 15,104 15,480 16,151 5.1 1.1 2.5 4.3
Total Population 59,320 60,988 63,678 66,306 68,721 2.8 4.4 4.1 3.6 Population 16+ 47,530 49,376 51,694 53,634 55,358 3.9 4.7 3.8 3.2 Labour Force 29,042 30,713 31,790 33,116 34,036 5.8 3.5 4.2 2.8 Activity Rate 61 62 62 62 61 1.8 -1.1 0.4 -0.4 ILO Unemployment 1,516 1,590 2,496 2,933 2,758 4.9 56.9 17.5 -6.0 Employment (headcount) 27,527 29,123 29,294 30,184 31,279 5.8 0.6 3.0 3.6 Labour Market Residual (2) 2,656 2,702 2,818 2,605 2,655 0.0 0.0 0.0 0.0 Jobs = headcount + residual 30,183 31,825 32,112 32,788 33,933 5.4 0.9 2.1 3.5 Source: CE/IER estimates; CE projections MDM C132F1A (revision 12015)
Notes:
(1) Levels are in thousands except for the activity rate, which is in percentages. Changes are percentage difference over the period except for the activity rate which are percentage points.
(2) Labour Market Residual is the difference of employment (number of jobs) and head count employment
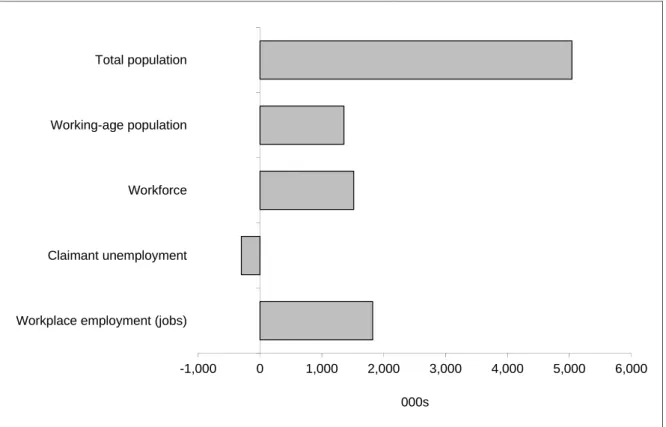
The demographic assumptions embodied in the forecast incorporate the estimates of the mid-year UK population to 2011, together with the interim 2011-based population projections for England which were published in September 2012 and the 2010-based UK population projections which were published in October 2011. Over 2012-22, the UK population is expected to grow by 0.8 per cent per annum and so experience a slightly larger increase (7.8 per cent) compared to 2002-12. However, the population aged over 16 will grow at a slower rate over 2012-22 than over 2002-12 (see Table 2.2). As a result, the working age population is expected to increase by around 1.4 million (3.3 per cent) over 2012-22 (see Figure 2.2).
The number of children in the population declined in the early part of the 2002-12 period, alongside a continuing steady rise in the number of pensioners. However, the number of children (aged less than 16 years) in the population has actually risen in the last few years to reach 12.0 million in 2012. By 2022 the number of children is projected to be 11½ per cent (around 1.4 million) higher than the 2012 level.
Overall, labour market participation, or activity rates, over the decade to 2012 increased slightly, but this was the result of a rising activity rate for women (by around 1 percentage point) and a falling activity rate for men (by 0.5 percentage points). However, by 2012 the activity rate of women was still about 13 percentage points lower than the activity rate for men.
Figure 2.2: Changes in Key Labour Market Indicators for the UK, 2012-2022 (000s)
Source: Cambridge Econometrics, MDM revision 12015
Both population and working age population are forecast to rise faster for males than for females, but the labour force for females is expected to increase faster than the male labour force (continuing recent trends). This reflects the increasing participation of women in the labour force and, over the period 2012-22, the gradually increasing pension age for women from 59 to 64. Overall participation rates are expected to increase slightly over 2012-17 but then see little change, such that the rate in 2022 will be about the same as in 2012.
-1,000 0 1,000 2,000 3,000 4,000 5,000 6,000 Workplace employment (jobs)
Claimant unemployment Workforce Working-age population Total population
The economically active labour force depends on the size of the population and the labour market participation rate. The latter varies considerably by age and gender. Women are still not as likely to take part in the formal economy as males, although trends in participation rates for women are still rising. This trend is projected to continue out to 2017; thereafter the female participation rate is forecast to remain about the same to 2022.
Labour market participation rates for younger people have fallen steadily in recent years as educational participation beyond the age of compulsory schooling has risen. However, participation rates of younger people are expected to stabilise in the coming years; the expansion of higher education is expected to be curbed by higher tuition fees (which apply to most parts of the UK) and uncertainties over future demand for graduate employment.
Activity rates for older workers (age 60-64), especially males, had fallen during the early-2000s as people chose to take rising real incomes in the form of earlier retirement. However, since the recession, these participation rates stopped falling, and along with those for the over 65s, participation rates are projected to rise due to concerns about the sustainability of pensions and planned rises in the State Pension age (see Box 2.1).
2.7 Employment
Employment can be defined and measured in a variety of ways (see Box 2.1 for details):
numbers of jobs;
numbers of people in employment (heads); by area of workplace; and
by area of residence.
In most of Working Futures 2012-2022, the term employment is used to refer to the number of jobs located in a particular area (generally where the workplace is located). Box 2.1 provides the alternative definitions of employment and other labour market indicators. Unless indicated otherwise, data on employment in tables and charts show the number of workplace jobs rather than numbers of people or place of residence.
Box 2
Altern There betwe two c additio Simila and po Resid Work Busine Work emplo establ otherw Emplo are b classif ILO u work i of wor Claim Workf (emplo claima Labou2.1: Defini
native defin e are variou een the num concepts re on, a furthe arly there a opulation. I dence basis place basi ess Registe place emp oyers, such lishments. wise stated. oyed resid based prima fied accord unemploym in the previo rk and have mant Unemp force: the oyee jobs a ant unemplo ur Force: eitions of E
nitions us ways of mber of peo epresent dif r distinction re various d n Working F s: measure s: measure er and Emp ployment ( h as the A In this repo . dents (head arily on da ing to their ment: cover ous four we e accepted a ployed: me size of th and self-em oyment. employed reEmployme
looking at e ople in emp fferent thing n can be ma different de Futures 201 d at place o ed at place loyment Su number of ABI and B ort referenc d count): th ata collecte main job. S rs people w eeks and ar a job that th easures peo he workforc mployment j esidents pluent and Re
employme ployment (h gs, as one ade betwee efinitions of 12-2022 the of residence of work (a urvey (BRES jobs): thes BRES, focu es to emplo he number ed in hous Some havewho are out re available hey are wait
ople claimin ce is obta jobs), HM F s ILO unem
elated Lab
nt. For exa head count) e person m n area of re unemploym e following d e (as in the as in the An S)). se are typic using upon oyment rela of people i sehold surv more than o t of work, w to start wo ting to start g Job Seek ained by s Forces, gov mployment.bour Marke
ample, a dis ) and the n may hold m esidence an ment, the la definitions a Labour For nnual Busin cally estima the numb ate to the n in employm veys, e.g. t one job. want a job, rk within th in the next ker’s Allowa umming wo vernment-suet Indicato
stinction ca number of jo more than o nd area of w abour force are used: rce Survey ( ness Inquiry ated using bers of job number of j ment. These the LFS. P , have activ e next fortn t fortnight). ance benefit workplace e upported trors
an be made obs. These one job. In workplace. , workforce (LFS)). y (ABI) and surveys of bs in their jobs unless e estimates People are vely sought night (or outts. employment ainees and e e n e d f r s s e t t t d
Box 2.1 Labour employ Labour The ma spatial differen in the v Total P Popula Workin (female to 65 in increas 1 (continue r market pa ment or (ILO r Market Ac ain cause of level, net c nce will also
arious sour Population: ation 16+: th ng-age pop es), (residen n 2018. Fro e to reach 6 ed): Definit articipation O) unemplo ccounts Re f the residua commuting o reflect dat rces. the total nu he total num pulation: t nce basis). T om 2018 the 66 by 2020. ions of Em n or Econo oyed as a p esidual: wo al at nation across geo a errors an umber of pe mber of peo the total n The State P e State Pen . mployment omic activit ercentage o orkplace em al level is “d ographical d other min eople reside ople aged 16 number of Pension age sion age fo and Relate ty rate: the of the total p mployment m double jobb boundaries nor differenc ent in an are 6 and above people ag e of females r all (both m ed Labour M number of population a minus Resid bing”. At a m s is also ve ces in data ea (residenc e (residence ged 16-64 s will increa males and fe Market Ind f people wh aged 16 an dence empl more disagg ery significa collection m ce basis). ce basis). (males) o ase from 60 emales) wil icators ho are in d over. oyment. gregated ant. The methods r 16-64 in 2011 l start to
2.7.1 Employment by Gender and Status
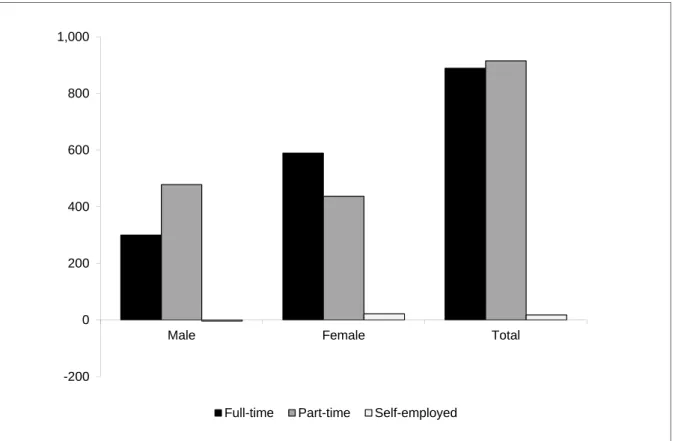
In 2012, employment (workplace jobs) in the UK increased by 2½ per cent. The steepest growth was in self-employment, especially among females (see Figures 2.3 & 2.4). Female self-employment increased by 7¾ per cent in 2012 and male self-employment rose by 6 per cent. There was also a substantial growth of just over 3½ per cent in male part-time employment, whereas female part-time employment grew modestly, by 1 per cent. However, female full-time employment rose by 2¾ per cent in 2012 compared with 1½ per cent growth in male full-time employment.
The result is that around 59 per cent (18.9 million) of all jobs in the UK in 2012 were full-time, while around 28 per cent (9.1 million) were part-time. The remaining 13 per cent (4.2 million) were self-employed (see Table 2.3).
Table 2.3: Employment Status, 2012-2022
Level 000's
2012
Employment by Gender Full-time Part-time Self-employed Total
Male 11,755 2,412 2,842 17,008
Female 7,121 6,639 1,344 15,104
Total 18,876 9,050 4,186 32,112
2017
Employment by Gender Full-time Part-time Self-employed Total
Male 11,853 2,625 2,831 17,308
Female 7,353 6,779 1,348 15,480
Total 19,206 9,404 4,179 32,788
2022
Employment by Gender Full-time Part-time Self-employed Total
Male 12,054 2,890 2,839 17,782
Female 7,710 7,076 1,365 16,151
Total 19,765 9,965 4,204 33,933
% of total %
2012
Employment by Gender Full-time Part-time Self-employed Total
Male 37 8 9 53
Female 22 21 4 47
Total 59 28 13 100
2017
Employment by Gender Full-time Part-time Self-employed Total
Male 36 8 9 53
Female 22 21 4 47
Total 59 29 13 100
2022
Employment by Gender Full-time Part-time Self-employed Total
Male 36 9 8 52
Female 23 21 4 48
Total 58 29 12 100
Change 000's
2012-2017
Employment by Gender Full-time Part-time Self-employed Total
Male 98 213 -12 300
Female 232 141 4 376
Total 330 354 -8 676
2017-2022
Employment by Gender Full-time Part-time Self-employed Total
Male 202 265 8 474
Female 357 296 17 671
Total 559 561 25 1,145
2012-2022
Employment by Gender Full-time Part-time Self-employed Total
Male 300 478 -4 774
Female 589 437 21 1,048
Total 889 915 18 1,821
Source: Cambridge Econometrics, MDM revision 12015 Numbers may appear not to sum due to rounding.
Figure 2.3: Changes in Employment by Status, UK, 2012-2022 (000s)
Source: Cambridge Econometrics, MDM revision 12015
Figure 2.4: Employment Trends by Gender and Status 1982-2022 (000s)
-200 0 200 400 600 800 1,000
Male Female Total
Full-time Part-time Self-employed
0 2,000 4,000 6,000 8,000 10,000 12,000 14,000 1982 1992 2002 2012 2022 MFT MPT FFT FPT MSE FSE
Among men, full-time employee (jobs) was the dominant status, accounting for around 69 per cent (11.8 million) of all jobs held by men. Around 2.4 million jobs held by men were part-time, representing 14 per cent of all jobs held by men. Self-employment accounted for around 17 per cent of jobs held by men. Amongst women, full-time employment accounted for just 47 per cent of all jobs held by women in the UK in 2012, while around 44 per cent were part-time jobs.
It is possible that the large increases in self-employment rather than full-time employee work are a sign that there is under-employment in the labour market. That is, there are many workers who would like to have a full-time job, but are unable to find one. Therefore, they choose the second-best option which is self-employment or part-time employment. If this is what is happening, it may explain why productivity is not growing as fast as many economists would expect post-recession. It may also be symptomatic of a weak economy.
At ¾ per cent in the year to June 2013, employment growth is estimated to have been weaker than it was in 2012. In 2013 the overall growth in part-time jobs is estimated to have been stronger than the growth in full-time jobs and self-employment: male and female part-time employment grew by 1½ per cent and 1 per cent respectively in 2013. Contrary to recent years, overall self-employment is estimated to have fallen, albeit by only ¼ per cent.
At just ¼ per cent, employment growth in 2014 is forecast to be weaker than in 2013, as the government's deficit reduction measures continue to impact on employment, particularly in public administration. The greatest increase is again expected to be in part-time employment, driven by an increase in male part-time employment of 1¾ per cent. Female part-time employment is expected to see little growth. Growth in male and female full-time employment is expected to be modest, and, continuing the trend of the previous year, self-employment is expected to fall slightly.
Over 2012-22 female full-time employment is projected to continue growing at a faster pace (¾ per cent per annum) than male full-time employment (¼ per cent per annum).