1
The Importance
of Data-Based
Decision Making
T
his chapter provides a general introduction to data-based decision making by addressing the question, why is using data for decision making important for school improvement? Today’s effective educational leaders use data extensively to guide them in decision making, setting and prioritizing goals, and monitoring progress. They use data to define needs, set goals, plan interventions, and evaluate progress. The continu-ing analysis of the gaps between goals for student learncontinu-ing and student performance defines the actions of effective schools. Capable data-based decision makers understand the array of data that is needed for school improvement. They know some fundamental principles of measurement and assessment and can implement data-analysis skills. They use a mul-titude of strategies to analyze data to propel teaching and learning and school improvement. They use technology to support the use of data. They engage the school community (teachers, parents, students) in using data to analyze strengths, weakness, threats, and opportunities for school improvement. At the end of this chapter, you should be able to explain why data-driven decision making is critical for schools to meet the needs of all children and to reach accountability expectations.ViGnEttE
Imagine you are a new principal with little previous adminis-trative and leadership experience. You have taken your first job as a principal of Rosemont School. Rosemont serves students from kindergarten through Grade 8. As you begin this new role
and establish new relationships with your staff, you face many demands. The greatest demand for you is guiding your school in a high-stakes accountability environment. Although your school has a highly qualified staff and supportive parents, your school must help students learn more and should, therefore, produce bet-ter results, particularly on the state-mandated assessments. When you were hired, you were informed by the district superintendent that Rosemont’s test scores have declined during the past few years. You need a plan. A systematic one. One that will provide leadership to your school and maintain the support and morale of your staff and parents. What will you do? The first thing you know you must do is come to grips with understanding all the data available about your school, your staff, and your students. You desire to know how these data support Rosemont’s vision and mission and how the data provide information for improving what occurs in your school.
As this vignette suggests, effective educational leaders can use data extensively to guide them in decision making. A primary goal of instruc-tional leaders is to focus the staff on the mission and vision of the school. They also use the array of available data to inform the school community about how well they are progressing toward meeting the goals and objec-tives of that mission. Continuous improvement hinges on continuous data-based decision making.
Throughout this book we refer to Rosemont School to provide exam-ples of data-based decision making in action. However, the examexam-ples are applicable to all schools. Rosemont School serves students in elementary and middle school grades. The guiding principles can also be applied to high schools. High schools are often much more complex than elemen-tary and middle schools; however, the importance of data-based decision making is the same. The processes and the types and sources of data are similar. This book is for school leaders at all types of schools.
Why is data-driven decision making so crucial for school improve-ment? Why are leaders turning to data to help drive their leadership? In this chapter we present the major reasons for engaging in data-driven decision making and provide an overview of the literature and theory supporting data-driven decision making in schools. After first discussing the role of data-based decision making within the context of a standards-based reform framework, we then discuss four key reasons for data-driven decision making:
• To work toward continuous improvement
the importance of Data-based Decision making
•
• To focus efforts and monitor progress
• To develop a sense of community through organizational learning
stAnDArDs-bAseD reForm
AnD DAtA-bAseD DeCision mAking
Since 1969, the Gallup organization has conducted systematic annual surveys of public opinion on a number of issues regarding public educa-tion. From the resulting reams of data have come various trends, both nationally and internationally, that suggest that too many students in the United States are not proficient in mathematics and reading and that the United States lags behind many of our international competi-tors. Multiple waves of these national and international studies over the past couple of decades suggest that the U.S. educational system is not progressing to meet our expectations and desires. In fact, some are quite skeptical that U.S. schools are making steady progress in educating students, pointing to indicators from a battery of national and interna-tional standardized tests such as the Nainterna-tional Assessment of Educainterna-tional Progress (NAEP), the International Assessment of Educational Progress (IAEP), and the International Evaluation of Achievement (IEA). Critics cite seemingly mediocre or poor test scores as evidence that American public schools are failing in their missions to educate the nation’s stu-dents and to prepare them for competition in an increasingly global workforce.1 In response to these accusations of regress and decreas-ing student performances, state-level and national-level reforms have called for implementing academic standards to which schools and students must be held accountable. A growing number of legislators and educators argue that this is the only way to guarantee progress in American schools toward the goal of educating all students successfully. Standards-based reform involves aligning teachers’ instruction and stu-dent learning with statewide standards that can be measured through annual assessments of students, a process furthered by continuous pro-fessional development of teachers and principals.
Standards-based reforms have enjoyed widespread political support throughout the nation. The administrations of the past four presidents have moved increasingly to promote such changes at the national level. Goals 2000 under Bill Clinton called for students to be first in the world 1. Although there probably is some merit to these critics’ claims, it is important to note that many researchers do not hold to the contention that public schooling in the United States is failing our students (see Berends, Lucas, Sullivan, & Briggs, 2005; Berliner & Biddle, 1995; Grissmer, Kirby, Berends, & Williamson, 1994; Rothstein, 1998).
on science and mathematics tests by the year 2000, and George W. Bush’s No Child Left Behind Act of 2001 (NCLB) expanded the role of standard-ized tests to evaluate schools’ progress in educating their students with the aim that all students would be proficient in reading and mathematics by 2014. Although NCLB has generated widespread debate, its initial passage in Congress showed the strong bipartisan support for the use of standards-based accountability. At the core of these reforms across the country is a focus on students and the conviction that they must be able to demonstrate what they have learned in their course work by performing on various assessments at different points in their academic careers.
Standards-based reform consists of four key elements: content and performance standards, curriculum and instructional alignment, assess-ments, and accountability.
Content and Performance Standards
Content standards answer the question, what should students know and be able to do? These goals consist of key concepts, facts, and skills that students are expected to learn in school. States often express these in the forms of what a student should be able to understand, do, or know at every grade level and every subject. These standards vary in complexity, content, and detail. Educators have established the standards by deter-mining reasonable benchmarks that students of each age should meet. Students are expected to meet an increasingly higher and more complex set of standards that build upon previous concepts, skills, and facts.
Performance standards refer to how well students should know the content. Such standards consist of the goals or benchmarks that students are expected to meet. Typically, these are measured with the use of assess-ments to establish different performance levels, such as whether students are below basic, basic, or proficient.
Many of these basic ideas are not new to education: Teachers and schools have long set various benchmarks for their students to learn in classes and subject areas. The big difference with the current reforms is that the new standards are now used on statewide bases rather than within specific classes, schools, or districts. All students within a state are expected to meet the state-set standards by a certain age or grade, and all students are expected to demonstrate this by their performance on various statewide evaluations.
Curriculum Alignment
A second key element of standards-based reform is the alignment of the delivered curriculum to the standards. Alignment entails focusing teaching
the importance of Data-based Decision making
•
and instruction to match the priorities set forth by statewide standards.Schools and teachers must respond to the learning priorities set forth in the standards by emphasizing those same skills, concepts, and content in their curricula. For students to meet the state standards, school districts across the country are aiming to align curricular textbooks and materi-als to those benchmarks. By virtue of these requirements, standards have begun to push widespread change in curricula as they indicate what is important for students to learn and be able to do at particular ages in particular subjects. Support for such alignment stems from international studies that described the U.S. curriculum as “a mile wide and an inch deep,” which was based in large part on analyses of U.S. math and sci-ence textbooks (Porter, 2002; Schmidt et al., 2001; Schmidt, McKnight, & Raizen, 1997). In addition, the emphasis on curricular alignment is based on a number of research studies showing that teaching focused on content aligned to standards and assessments is associated with higher test scores (e.g., Brophy & Good, 1986; Gamoran, Porter, Smithson, & White, 1997; Knapp, Shields, & Turnbull, 1992; Newmann & Wehlage, 1995; Wong, Hedges, Borman, & D’Agostino, 1996). Some research has begun to document this trend in which standards serve as change agents to direct teachers’ improvement of content organization (McGeehee & Griffith, 2001). Although some contend that teachers may be aligning their content and instruction too narrowly to meet the requirements of the assessments (Hamilton, Stecher, & Klein, 2002), the aim of aligning curriculum to standards is a critical quest on which many schools and districts across the nation are embarking.
Assessment and Accountability
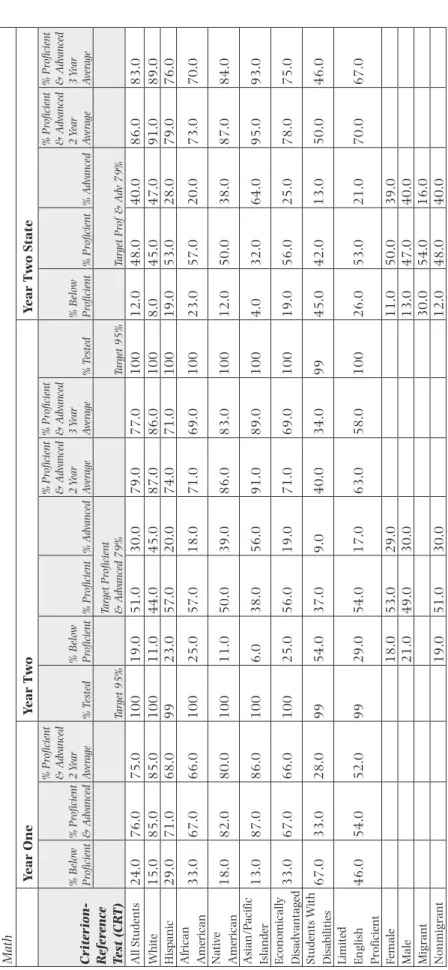
This brings us to assessment, the third key component of these reforms. Like the standards themselves, the assessments that states have implemented to test student performance according to the standards have ranged greatly. However, under NCLB legislation, every child in grades 3–8 must be tested every year in reading, math, and science. States typically assess students once during the spring of each school year. State assessments are supposed to match or align with individual state standards. As such, a key question that drives the assessments is, to what extent have students mastered the standards? It is not sufficient under NCLB to answer this question in terms of all students, on average. Rather, states and districts must report the percentage of students tested and the percentage of students proficient, that is, passing the benchmark, disag-gregated by the following subgroups: all students, major ethnic and racial groups, limited English proficient, economically disadvantaged, migrant, gender, and students with disabilities.
Once test scores have been calculated, they are disseminated to various organizations throughout the state, both inside and outside of education. States and districts receiving Title I funds must prepare and disseminate annual report cards according to NCLB.
The disaggregated results on the state standardized tests are used to determine if a school has met adequate yearly progress (AYP) under No Child Left Behind. Each state defines adequate yearly progress for school districts and schools by setting the level of student achievement a school must attain for each of the subgroups (http://www.ed.gov/nclb/accountability/schools/ accountability.html). AYP measures the yearly progress toward achieving grade-level performance for each student group. These report cards contain such information as depicted in Tables 1.1 and 1.2.
The information is made public to provide accountability, the last ele-ment of standards-based reform. Reformers argue that scores on these standardized tests offer evidence of the degree to which teachers, classes, or schools have made progress in educating students according to the standards and benchmarks. Accountability entails monitoring, challeng-ing, and rewarding educators to improve student learning as evidenced on standardized assessments. To promote enforcement of this account-ability, standardized test scores are made public through newspaper articles, local news organizations, and state or district Web site postings. As performance-based pay has yet to become a pervasive policy, public knowledge comprises some of the most widespread incentives and pres-sures for educators to improve their students’ performance.
Depending on the state, these test scores are then used as criteria in various decisions. Tests that are used to make critical decisions about rewards and sanctions for districts, schools, students, or teachers are called high-stakes tests. For example, in many states students must pass high school tests to graduate; in other states test scores may be tied to pay raises. The stakes associated with such test results are high, and they may go only higher.
NCLB ties schools’ receipt of national-level funding for certain pro-grams to their students’ performances on state standardized tests. Such policies have increased pressure on principals and teachers to improve student scores on these assessments. The use of standardized test scores in these ways is designed to give educators multiple incentives to improve students’ performances and thereby improve their learning as defined by the benchmarks. Reformers argue that such policies will not only promote improved student learning but also offer educators and others a complex way of monitoring progress toward the standards.
Key to implementing standards-based reform is high-quality sional development. Within the context of standards-based reform, profes-sional development is the mechanism that effective leaders use to help
ta ble 1.1 Gr ades K–8: Subg roup Disa gg reg ation for Ma th Scores Math Year One Year t w o Year t w o State Criterion- Ref erence Test (CR T) % Belo w Pr oficient % Pr oficient & Ad vanced % Pr oficient & Ad vanced 2 Year Av er age % Tested % Belo w Pr oficient % Pr oficient % Ad vanced % Pr oficient & Ad vanced 2 Year Av er age % Pr oficient & Ad vanced 3 Year Av er age % Tested % Belo w Pr oficient % Pr oficient % Ad vanced % Pr oficient & Ad vanced 2 Year Av er age % Pr oficient & Ad vanced 3 Year Av er age Tar get 95% Tar get Pr oficient & Ad vanced 79% Tar get 95% Tar get Pr of & Ad v 79% All Students 24.0 76.0 75.0 100 19.0 51.0 30.0 79.0 77.0 100 12.0 48.0 40.0 86.0 83.0 W hite 15.0 85.0 85.0 100 11.0 44.0 45.0 87.0 86.0 100 8.0 45.0 47.0 91.0 89.0 Hispanic 29.0 71.0 68.0 99 23.0 57.0 20.0 74.0 71.0 100 19.0 53.0 28.0 79.0 76.0 African American 33.0 67.0 66.0 100 25.0 57.0 18.0 71.0 69.0 100 23.0 57.0 20.0 73.0 70.0 Na tiv e American 18.0 82.0 80.0 100 11.0 50.0 39.0 86.0 83.0 100 12.0 50.0 38.0 87.0 84.0 Asian/P acif ic Islander 13.0 87.0 86.0 100 6.0 38.0 56.0 91.0 89.0 100 4.0 32.0 64.0 95.0 93.0 Economicall y Disad vanta ged 33.0 67.0 66.0 100 25.0 56.0 19.0 71.0 69.0 100 19.0 56.0 25.0 78.0 75.0 Students W ith Disa bilities 67.0 33.0 28.0 99 54.0 37.0 9.0 40.0 34.0 99 45.0 42.0 13.0 50.0 46.0 Limited Eng lish Prof icient 46.0 54.0 52.0 99 29.0 54.0 17.0 63.0 58.0 100 26.0 53.0 21.0 70.0 67.0 Female 18.0 53.0 29.0 11.0 50.0 39.0 Male 21.0 49.0 30.0 13.0 47.0 40.0 Mig rant 30.0 54.0 16.0 Nonmig rant 19.0 51.0 30.0 12.0 48.0 40.0 SOUR CE: Depar tment of Educa tion, Tennessee .
table 1.2 Disaggregated Results for High School Students Meeting Adequate Yearly Progress
High School All White Hispanic
African American Native American Math % Tested + + + + <45 % Proficient/ Advanced x + x x <45
Reading, Language Arts, Writing
% Tested + + + + <45 % Proficient/ Advanced + + + + <45 Event Dropout Rate + Met AYP? x High School Asian/ Pacific Islander Economic Disadvantaged Students w/ Disabilities Limited English Proficient Math % Tested + + + + % Proficient/ Advanced + x x x
Reading, Language Arts, Writing
% Tested + + + + % Proficient/ Advanced + x + x Event Dropout Rate Met AYP?
SOURCE: Department of Education, Tennessee. Key: + = meets AYP; x = does not meet AYP
the importance of Data-based Decision making
•
13 teachers learn and understand new content standards. Professionaldevelopment also drives the implementation of rigorous standards-based reform by helping teachers implement curriculum and pedagogy that help all students meet the standards.
Research has documented many elements that are associated with highly effective professional development for teachers (Desimone, Garet, Birman, Porter, & Yoon, 2002; Desimone, Porter, Garet, Yoon, & Birman, 2002; Garet, Porter, Desimone, Birman, & Yoon, 2001; Knapp, Copland, & Talbert, 2003). Perhaps one of the important characteristics of high-quality professional development is that it is sustained over time and linked to schoolwide improvement efforts. Teachers are actively involved in planning and setting goals for their own learning. Effective professional development focuses on both content (e.g., math or literacy) and pedagogy. Furthermore, it provides opportunities for ongoing support, feedback, and assistance for implementation of change. High-quality professional devel-opment is aligned to state and district standards and assessments.
ViGnEttE REViSitEd
The vignette at the outset of the chapter provides a picture of a realistic, yet challenging, scenario facing many school principals. While considering the challenges facing a new leader at Rosemont School, reflect upon your own professional development experi-ences. In what ways have professional development experiences prepared you to meet the Rosemont challenges? What types of professional development might you seek to better equip you to meet these kinds of issues?
Principals play a key role in both planning and delivering professional development to teachers. By supporting and developing a school context and culture for teacher learning through collaboration and support, principals have a profound impact on teacher professional development (Gamoran et al., 2003). In this role, data-based decision-making knowl-edge is part of the repertoire for school principals. They can help teachers use data to identify individual students who need remedial assistance, tailor instruction to individual students’ needs, identify and correct gaps in the curriculum, improve or increase the involvement of parents in student learning, and assign or reassign students to classes or groups. Furthermore, data can help teachers identify areas where they need to strengthen their own content knowledge or teaching skills—in other words, where to focus professional development.
This section has described the key components of standards-based reform and its role in data-based decision making. In the next section we review some of the research on standards-based reform and its links to student performance.
What Do We Know About Standards-Based Reform?
The core premise of standards-based reform is that by aligning the key elements of the system—expectations for what students should know, assessments of how well students know the content, curriculum alignment to standards, professional development for teachers, and accountability for performance—we can build a more coherent and powerful education system (Fuhrman & Elmore, 2004; Porter, 1994; Smith & O’Day, 1991; Vinovskis, 1996). However, research on the effects of alignment on stu-dent learning to high standards remains an open question. We know little about whether aligning the key elements of standards-based reform are affecting student learning as policymakers and educators intend (Porter, 2002). Some acknowledge that standards-based reforms have pushed teachers to clarify their goals and use a range of instructional strategies to help diverse students in their classrooms. However, they also worry about evidence that the initiatives have caused teachers to embrace techniques that are detrimental to student learning, such as lockstep curricula and retention or promotion decisions based on a single test (Falk, 2002).
Research studies that examine the alignment of state tests to state standards (Council of Chief State School Officers, 2005; Porter, 2002; Rothman, Slattery, Vranek, & Resnick, 2002; Webb, 1997) reveal that, generally, state assessments are only weakly aligned to standards. In addi-tion, the lack of alignment is due to the tests’ emphasis on facts, recall, and routine procedures and not on understanding and interpretation. As such, there are significant challenges that remain for standards-based accountability in America’s schools. However, as standards-based reform continues to unfold in schools across the nation, it is imperative to provide support to schools to use the data at hand to improve curriculum, instruc-tion, professional development, and overall alignment of the educational program.
Why DAtA-bAseD DeCision mAking?
Continuous ImproementAlthough data-driven decision making is a buzz phrase in educa-tional leadership circles today, it has deep theoretical origins in the
the importance of Data-based Decision making
•
15 organizational-theory literature on continuous improvement andlearn-ing curves (Zangwill & Kantor, 1998).
The origins of continuous improvement can be traced back to the early 1950s when Toyota implemented a just-in-time improvement strategy in which employees would conduct routine weekly analyses to improve their job performance (Adler, 1991). In education, continuous improvement can be an integral part of standards-based reform if test scores and other accountability information are used for organizational learning. “Because organizations learn from experience incrementally in response to feedback about outcomes, the increase in the sheer volume of information provided by a strengthened state accountability system may provide the experience necessary for higher-level learning” (Coggshall, 2004, p. 9).
Organizational learning is the process by which members of an orga-nization, schools in our case, acquire and use information to change and implement action (Dixon, 1999). Organizational learning occurs as a social and dynamic process. Organizational learning occurs when knowl-edge is distributed across individuals and is embedded in the culture, values, and routines of the organization. This type of learning is a devel-opmental process that can occur in an organization over time.
Data can serve as a catalyst to propel organizational learning. As will be explained later, data refer to multiple sources and types of information. Although many think of scores on standardized tests as the main type of data, other data include information about the students, school programs, and others measures of student learning such as student work, ongoing formative assessments, and portfolios. Data are not limited to students and programs. Data include observations of the quality of teaching and the content of the curriculum actually taught in the classroom.
School leaders can use data to develop a culture of learning for adults as well as students in the school with the regular flow of information from data. Leaders can use data to put into place mechanisms to support indi-vidual and collective learning surrounding data by pursuing such questions as: What are the data telling us? What can we learn from the data? How can we change our practice in light of the data? What other data do we need to collect? How does the information from standardized assessments compare with teachers’ grades and other more local information about student performance and development? Ideally, teacher teams have access to infor-mation that is used to build collaborative relationships and drive cycles of inquiry. Therefore, data that is dispersed and shared throughout the school will better facilitate the professional climate and organizational learning. In fact, for data to be useful to the organization, there should be a number of teams in place that can facilitate the data-driven processes.