University of Dayton
eCommons
Electrical and Computer Engineering Faculty
Publications
Department of Electrical and Computer
Engineering
7-2016
Analysis of Various Classification Techniques for
Computer Aided Detection System of Pulmonary
Nodules in CT
Barath Narayanan Narayanan
University of DaytonRussell C. Hardie
University of Dayton, [email protected]
Temesguen Messay
University of Dayton, [email protected]
Follow this and additional works at:
http://ecommons.udayton.edu/ece_fac_pub
Part of the
Computer Engineering Commons
,
Electrical and Electronics Commons
,
Electromagnetics and Photonics Commons
,
Optics Commons
,
Other Electrical and Computer
Engineering Commons
, and the
Systems and Communications Commons
This Conference Paper is brought to you for free and open access by the Department of Electrical and Computer Engineering at eCommons. It has been accepted for inclusion in Electrical and Computer Engineering Faculty Publications by an authorized administrator of eCommons. For more information, please [email protected], [email protected].
eCommons Citation
Narayanan, Barath Narayanan; Hardie, Russell C.; and Messay, Temesguen, "Analysis of Various Classification Techniques for Computer Aided Detection System of Pulmonary Nodules in CT" (2016).Electrical and Computer Engineering Faculty Publications. 409.
Abstract - Lung cancer is the leading cause of cancer death in the United States. It usually exhibits its presence with the formation of pulmonary nodules. Nodules are round or oval-shaped growth present in the lung. Computed Tomography (CT) scans are used by radiologists to detect such nodules. Computer Aided Detection (CAD) of such nodules would aid in providing a second opinion to the radiologists and would be of valuable help in lung cancer screening. In this research, we study various feature selection methods for the CAD system framework proposed in FlyerScan. Algorithmic steps of FlyerScan include (i) local contrast enhancement (ii) automated anatomical segmentation (iii) detection of potential nodule candidates (iv) feature computation & selection and (v) candidate classification. In this paper, we study the performance of the FlyerScan by implementing various classification methods such as linear, quadratic and Fischer linear discriminant classifier. This algorithm is implemented using a publicly available Lung Image Database Consortium – Image Database Resource Initiative (LIDC-IDRI) dataset. 107 cases from LIDC-IDRI are handpicked in particular for this paper and performance of the CAD system is studied based on 5 example cases of Automatic Nodule Detection (ANODE09) database. This research will aid in improving the nodule detection rate in CT scans, thereby enhancing a patient’s chance of survival.
Index Terms – Computed Tomography, Computer Aided Detection System, Lung Cancer, Fischer Linear Discriminant Classifier, Quadratic Classifier, Neural Network.
I. INTRODUCTION
UNG cancer is the leading cause of cancer death in the United States. According to the National Cancer Institute, 158,080 lung cancer cases are expected by the end of 2016 [1]. Early detection of potentially cancerous nodules could improve patients’ chances of survival [2]. Nodules are round or oval shaped growth present in the lung. Imaging techniques such as Computed Tomography (CT) and chest radiographs are used in order to detect such cancerous nodules. In the Early Lung Cancer Action Project, low dose CT has proven to be more effective than chest radiographs [2]. These imaging techniques, especially low-dose CT, have been successful in the initial screening of lung cancer detection. In this research, we primarily focus on CT. Early detection of such potentially cancerous nodules is a problem attracting great interest. These
nodules are approximately round or oval shaped lesions present in the lung with well-defined boundaries. In high resolution CTs, it is not only possible to identify such nodules but also make some useful measurements regarding its shape, volume, etc. In certain Medical Imaging modality, CT provides numerous slices of image data which can be time consuming and potentially fatiguing for radiologists to study. Also, dealing with this bulk volume of CT data is quite a challenge. Thus, Computer Aided Detection (CAD) for automatically identifying such pulmonary nodules on CT is very essential and would be of great help for lung cancer screening. This CAD system would eventually enhance the work flow of radiologist. Extensive research has been done on automatic detection of lung cancer nodules for the last few decades. However, there is still scope for further improvement. A typical CAD system contains a front end detector, candidate segmentator and a feature based classifier/neural network to distinguish the candidates. Sensitivity of these modules [3, 4] is undoubtedly one of the parameters that could be improved.
One area for improvement, we believe, is within the design of feature-based classifiers. We improvise by identifying a best set of features that are necessary for a particular type of classifier to distinguish nodules from non-nodules by looking into existing set of feature selection methods and also by identifying set of features that performs well across various set of classifiers. We also study the performance of various classification techniques that would enhance the performance of existing CAD system by locking into certain set of features. Till date, not much study has examined this portion of backend processor. Implementation of this feature-based classification technique is an interesting area to explore. We provide our findings and results for Lung Image Database Consortium Image and Image Database Resource Initiative (LIDC-IDRI) and Automatic Nodule Detection (ANODE09) database.
The remainder of this report is organized as follows. Section 2 presents the necessary background about existing CAD systems. Section 3 provides a brief description about the databases that are employed in this research. Section 4 elucidates the proposed methods. Section 5 presents the
Analysis of Various Classification Techniques for
Computer Aided Detection System of
Pulmonary Nodules in CT
Barath Narayanan Narayanan, Russell C. Hardie, Temesguen M. Kebede Department of Electrical and Computer Engineering
University of Dayton, Dayton, OH 45469, USA Email: {narayananb1, rhardie1, tmessay1}@udayton.edu
experimental results obtained using the proposed methods. Finally, conclusions are offered in Section 6.
II. REVIEW OF RELATED WORK
Automated CAD of lung nodules has been an active field of research and several CAD systems have been proposed in the literature [3]. In this paper, we primarily follow the footsteps of the CAD system proposed in [3] and it would serve as the benchmark for our proposed CAD system.
For instance, [5] utilizes the ‘N-Quoit filter’, [6] describes the diagnosis rules based on fuzzy clustering. In 1999, [7], a hybrid classifier combining an unsupervised and a supervised model was designed to improve classification performance of malignant and benign masses in Mammograms. In 2001, an improved system that combines 2-D and 3-D feature analysis along with linear discriminant classifier was proposed in [8]. Another system [9] was designed based on improved template-matching technique built on genetic algorithm. [10] proposed new gradient concentration features for recognizing polyps. [11] presented a detection system that uses a surface normal overlap technique along with simple rule-based classifier to attenuate False Positive (FP) findings. [12] applies various classification techniques such as support vector machine, kernel Fisher discriminant, AdaBoost for automated classification. [13] uses a localized search method based on anatomical classification to detect potential nodule candidates in chest radiographs. [14] incorporated a dot enhancement filter for candidate selection and a neural classifier for reduction of FPs. [15] proposed a novel CAD system for identifying lung nodules in 2-D chest radiographs that comprises of a novel weighted multiscale convergence-index filter and an adaptive distance based threshold algorithm for potential candidates segmentation. A set of 114 features are computed for each candidate. Gaussian Bayes Linear classifier (GBL), Fisher Linear Discriminant (FLD) and quadratic classifier are compared in [15] as well. In this research, we primarily follow the footsteps of the CAD system proposed in [3] and it would serve as the benchmark for our system. Figure 1 represents the block diagram of the CAD system presented in [3].
For this research, we focus on front end detector systems in [3] where front end detection is performed using the following methods (i) image down-sampling & orientation (ii) Local contrast enhancement (iii) 3-D lung segmentation (iv) 3-D detection of potential nodule candidates and segmentation. At first, CT data is oriented consistently and down-sampled later. Down sampling is done to increase the resolution compatibility between the training and testing data. Image down-sampling is also performed to reduce the processing time and for noise smoothing. 3-D Lung Segmentation along with potential candidate detection and segmentation is performed on the oriented and down-sampled CT scans as described in [3]. Figure 2 shows the typical front end detector result for a case from LIDC-IDRI - Case 0001.
Figure 1: Top level block diagram of the CAD system proposed in [3]
Figure 2: Typical Front end detector result for LIDC-IDRI: Case 0001
III. DATABASES USED A. ANODE Database
The Automatic Nodule Detection 2009 (ANODE09) dataset comprises of 55 anonymized CT Scans [16]. 5 out of these 55 scans are set as examples and are available with radiologist annotations. These 5 example cases serve as testing dataset for this research. However, the radiological annotations of these 50 cases are not available publicly.
The ANODE09 database were observed by 3 radiologists; Nodules detected were classified into two different categories relevant and irrelevant. Irrelevant nodules are findings below 4mm. In the 5 example cases, there are 39 relevant nodules and 31 irrelevant ones are noted whereas in the 50 testing cases, 207 relevant and 433 irrelevant findings are recorded.
B. LIDC-IDRI Database
LIDC–IDRI is a publicly available database in the National Biomedical Imaging Archive (NBIA) [17]. The LIDC data has been collected from various sites in the United States. This established database was initiated by the National Cancer Institute (NCI) which was further enhanced by the Foundation of the National Institutes of Health (FNIH) along with Food and Drug Administration (FDA). The LIDC/IDRI contains 1018 CT scans and each of them have been studied by at least one of the radiologists. In the initial blinded-read phase, each radiologist annotated the CT scan independently and marked lesions. Later, each radiologist independently reviewed their own markings along with the markings of the other three radiologists to render their final opinion. There is some dissent among the radiologists about many of their nodule findings even after the second session of study. This database contains ‘7371’ lesions marked as a ‘nodule’ by at least one of the radiologists out of which 2669 are above 3mm.
IV. METHODS
We extract a set of 503 features from the segmented candidates including the 245 features mentioned in [3]. Feature selection is later processed to select the optimum set of features to aid classification. In [3], the subset of features from the computed 245 is selected based on the area under the Free Receiving Operating Curve (FROC) between 0-10 FPs. In [15], classification comparison is performed for GBL, Quadratic and FLD techniques. In this research, we primarily focus on Quadratic, Linear and FLD classifier. The performance of the CAD system is usually measured using a FROC or ANODE09 metric. By ANODE09 metric, we measure the performance of the entire CAD system provided in a single score [4]. The sensitivities are measured at: 1/8, 1/4, 1/2, 1, 2, 4 and 8 FPs per patient. Sensitivities at those particular points are averaged to get an overall score for the system.
A. Feature Selection methods
Now, we study the performance of various feature selection methods such as Sequential Forward Selection (SFS), Sequential Backward Removal (SBR) after SFS by locking into a particular type of classifier.
1) Sequential Forward Selection
In SFS, features are added to an empty set one-by-one. At each step, one feature is added and we measure the performance of the system. For this project, performance of the feature is either determined based on Area under the Curve (AUC) between 0-10 FPs or bin scoring metric. Bin metric system computes the overall AUC based on the ANODE scoring metric using bins with key points at : 1/8, 1/4, 1/2, 1, 2, 4 and 8 FPs per patient. Features that provide the maximum area or bin score metric value would be selected. This type of selection would help us avoid exhaustive enumeration.
2) Sequential Backward Removal
Contrasting to SFS, in SBR, we would remove features one by one based on their impact. For this scenario as well, we make use of various performance metrics. To reduce computation
complexity, we try implementing SBR along with SFS to determine the best suite of features necessary for classification. B. Classification methods
In this research, we study the following classification methods and their performance based on a particular set of features selected.
1) Quadratic Classifier
As the name suggests, quadratic classifier forms a quadratic decision boundary to distinguish the patterns [18]. It is also known as a minimum error classifier for Gaussian classes with different covariance [18]. The heart of this classifier depends on the estimate of the mean and the covariance of their respective classes. The decision of quadratic classifier is based on a discriminant function (g) provided in equation 1.
( ) = ( − ) ∑ ( − ) − ( − ) ∑ ( − ) + (∑∑ ) + 2 ( ) (1)
X represents the feature vector in question. M, ∑ and P represent the mean, covariance and prior of respective classes. Corresponding class assignments are provided in equation 2.
Class Assignment = 2 ( ) > 0 1 ( ) ≤ 0 (2) 2)Linear Classifier
A linear classifier forms a linear decision boundary to distinguish the patterns. It is also known as the minimum error classifier for Gaussian classes with equal covariance. Here, we have a common covariance for all the samples instead of individual covariance for respective classes. Common covariance is estimated based on the covariance of all the samples. g is calculated based on Equation 3 and final decision is made based on equation 2.
( ) = ( − ) ∑ + 0.5 × ∑ − ∑ + (3) 3) FLD Classifier
FLD classifier is a special case of linear classifier [18]. Here, common covariance is estimated based on the mean of covariance of the respective classes as shown in Equation 4.
∑ = ( ∑ + ∑ ) (4)
However, g and final decision remains the same as mentioned in equations 3 and 2.
V.EXPERIMENTAL RESULTS
In this section, we present experimental results that includes FROC analysis. At first, we handpick 107 LIDC-IDRI cases from the entire dataset of 1010 cases. These cases match the thickness and spacing of 5 example cases of ANODE09 database. 107 cases of LIDC-IDRI dataset serve as the training dataset and 5 cases of ANODE09 dataset serve as the testing dataset. We shortlist the top 300 features out of the 503 features
available using ‘rank’. Front end sensitivity of ANODE09 using the front end detector described in [3] is found to be 84.62%. Additionally, we consider only the relevant nodules present in ANODE09 for our evaluation.
We compare the feature selection methods by locking the classification technique. FLD classification method is used in this scenario. Feature selection is conducted using k-fold validation of training dataset. We perform SFS, based on AUC between 0-10 FPs metric. Number of features selected for each type of selection is based on a knee point obtained in the SFS merit function curve. Now, we perform SBR to shortlist features from 100 features selected using SFS. SBR is performed on the bin metric scoring system.
Figures 3 and 4 show the merit function curve obtained using SFS and SBR after the application of SFS. Figure 5 shows the FROC curves obtained for the testing dataset after selection of features based on the various selection techniques mentioned using a FLD classifier. Table I shows the number of features selected using each method along with the corresponding ANODE score obtained.
Figure 3: SFS process merit function using FLD classifier
Figure 4: SBR after SFS Process merit function using FLD classifier
Figure 5: FROC showing CAD performance on ANODE09
dataset as a function of features selected based on SFS, and SBR after SFS using FLD Classifier
TABLE I
Performance comparison of various feature selection methods using FLD classifier on ANODE09 dataset
Feature Selection Method No. of features selected ANODE Score Area under the curve (0-10 FPs) SFS 20 0.5604 6.89 SBR after SFS 18 0.6227 7.05
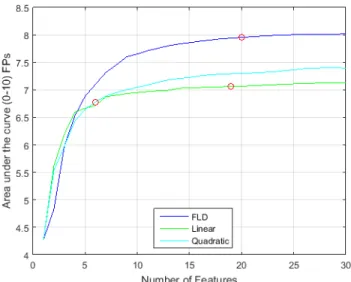
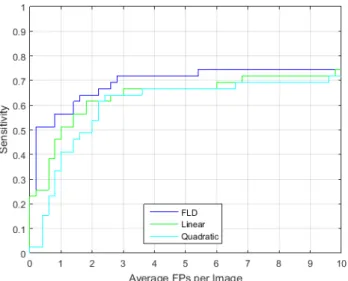
Now, we compare the classification techniques by performing SFS based on area under the curve utilizing k-fold validation using each classifier type respectively. Figure 6 shows the SFS process merit function for linear, quadratic and FLD classifier. Figure 7 and Table II shows the results obtained using various classification techniques for ANODE09 utilizing SFS based selected features.
Figure 6: SFS process merit function using Linear, Quadratic and FLD classifier
Figure 7: FROC showing CAD performance on ANODE09 dataset as a function of classifier (Linear, Quadratic and FLD)
using SFS based selected features
TABLE II
Performance comparison of various classification methods using SFS feature selection method on ANODE09 dataset
Type of Classification No. of features selected ANODE Score Area under the curve (0-10 FPs) Linear 19 0.4652 6.35 Quadratic 6 0.3590 5.96 FLD 20 0.5604 6.89 VI. CONCLUSIONS
The results obtained suggest that among the feature selection methods implemented in this paper, SBR after SFS provides the best results. This method enables the selection algorithm to identify the optimal set of features which are not only optimized for AUC but also bin metric during SBR which enables the CAD system to provide higher sensitivity results even at lower FPs. SBR method removes certain features that might be present redundantly due to SFS.
Classification results clearly suggest that FLD classifier performs the best among the classifiers presented in this paper. This might be due to the fact that overall covariance is estimated based on the average of covariance of both nodules and non-nodules. The number of nodules present in a dataset are too less when compared to non-nodules which might lead to poor covariance estimation of nodules, hence poor performance in case of quadratic classifier. However, the performance gets slightly better in case of linear as it estimates a single overall covariance thereby giving more weightage to non-nodules.
Early detection of such pulmonary nodules can have significant impact on early lung cancer detection. This effort enhances the fundamental knowledge of various feature selection and classification techniques that can be implemented
in a CAD system. Furthermore, this CAD system serves as a new benchmark for future research efforts.
REFERENCES
[1] Cancer Facts and Figures 2015. The American Cancer Society.
[2] Henschke, C.I., McCauley, D.I., Yankelevitz, D.F., Naidich, D.P., McGuniness, G. Miettinen, O.S., Libby, D.M., Pasmantier, M.W., Koizumi, J., Altorki, N.K., Smith, J.P., 1999. “Early cancer action project: overall design and findings from baseline screening”. Lancet, 354 (1973), 99-105.
[3] Kebede Temesguen M., Hardie Russell C., Rogers Steven K. “A new computationally efficient CAD system for pulmonary nodule detection in CT imagery”, Medical Image Analysis, Vol. 14, No. 3, 2010, Pages 390-406.
[4] Van Ginneken, Bram, Samuel G. Armato, Bartjan de Hoop, Saskia van Amelsvoort-van de Vorst, Thomas Duindam, Meindert Niemeijer, Keelin Murphy et al. "Comparing and combining algorithms for computer-aided detection of pulmonary nodules in computed tomography scans: the ANODE09 study", Medical image analysis, Vol. 14, No. 6, 2010, Pages 707-722.
[5] Okumura Toshiaki, Tomoko Miwa, Junichi Kako, Shinji Yamamoto, Mitsuomi Matsumoto, Yukio Tateno, Takeshi Iinuma, and Tohru Matsumoto. "Variable N-Quoit filter applied for automatic detection of lung cancer by X-ray CT", Computer Assisted Radiology and Surgery (CAR’98), 1998, Pages 242-247.
[6] Kanazawa Keizo, Yoshiki Kawata, Noboru Niki, Hitoshi Satoh, Hironobu Ohmatsu, Ryutarou Kakinuma, Masahiro Kaneko, Noriyuki Moriyama, and Kenji Eguchi. "Computer-aided diagnosis for pulmonary nodules based on helical CT images", Computerized Medical Imaging and Graphics, Vol. 22, No. 2, 1998, Pages 157-167.
[7] Hadjiiski Lubomir, Berkman Sahiner, Heang-Ping Chan, Nicholas Petrick, and Mark Helvie. "Classification of malignant and benign masses based on hybrid ART2LDA approach", IEEE Transactions on Medical Imaging, Vol.18, No. 12, 1999, Pages 1178-1187.
[8] Armato III, Samuel G., Maryellen L. Giger, and Heber MacMahon. "Automated detection of lung nodules in CT scans: preliminary results", Medical physics, Vol.28, No. 8, 2001, Pages 1552-1561.
[9] Lee Yongbum, Takeshi Hara, Hiroshi Fujita, Shigeki Itoh, and Takeo Ishigaki. "Automated detection of pulmonary nodules in helical CT images based on an improved template-matching technique", IEEE Transactions on Medical Imaging, Vol. 20, No. 7, 2001, Pages 595-604.
[10] Näppi Janne, and Hiroyuki Yoshida. "Automated detection of polyps with CT colonography: evaluation of volumetric
features for reduction of false-positive findings", Academic Radiology, Vol. 9, No. 4, 2002, Pages 386-397.
[11] Rubin Geoffrey D., John K. Lyo, David S. Paik, Anthony J. Sherbondy, Lawrence C. Chow, Ann N. Leung, Robert Mindelzun et al. "Pulmonary Nodules on Multi–Detector Row CT Scans: Performance Comparison of Radiologists and Computer-aided Detection", Radiology 234, No. 1,2005, Pages 274-283.
[12] Wei Liyang, Yongyi Yang, Robert M. Nishikawa, and Yulei Jiang. "A study on several machine-learning methods for classification of malignant and benign clustered microcalcification", IEEE Transactions on Medical Imaging , Vol. 24, No. 3, 2005, Pages 371-380.
[13] Shiraishi Junji, Qiang Li, Kenji Suzuki, Roger Engelmann, and Kunio Doi. "Computer-aided diagnostic scheme for the detection of lung nodules on chest radiographs: localized search method based on anatomical classification" Medical Physics, Vol. 33, No. 7, 2006, Pages 2642-2653.
[14] Gori I., M. E. Fantacci, A. Preite Martinez, and A. Retico. "An automated system for lung nodule detection in low-dose computed tomography", Proceeding of SPIE in Medical Imaging, Vol.6514, 2007, Pages 65143R.
[15] Hardie Russell C., Steven K. Rogers, Terry Wilson, and Adam Rogers. "Performance analysis of a new computer aided detection system for identifying lung nodules on chest radiographs". Medical Image Analysis, Vol.12, No. 3, 2008, Pages 240-258.
[16] http://anode09.grand-challenge.org/
[17] Armato III, Samuel G., Geoffrey McLennan, Michael F. McNitt-Gray, Charles R. Meyer, David Yankelevitz, Denise R. Aberle, Claudia I. Henschke et al. "Lung image database consortium: Developing a resource for the medical imaging research community", Radiology 232, No. 3, 2004, Pages 739-748.
[18] Fukunaga Keinosuke. “Introduction to statistical pattern recognition”, Academic press, 2013.
![Figure 1: Top level block diagram of the CAD system proposed in [3]](https://thumb-us.123doks.com/thumbv2/123dok_us/805063.2601749/3.918.469.844.281.646/figure-level-block-diagram-cad-proposed.webp)