Jácome Miguel Costa da Cunha
Setembro de 2010 U M in ho |2 01 0Model-based Spreadsheet Engineering
M o d e l-b a se d S p re a d sh e e t E n g in e e ri n g Já co m e M ig ue l C os ta d a C un ha
Universidade do Minho
Escola de Engenharia
Tese de Doutoramento
Doutoramento em Informática
Jácome Miguel Costa da Cunha
Setembro de 2010
Model-based Spreadsheet Engineering
Universidade do Minho
Escola de Engenharia
Trabalho efectuado sob a orientação do
Professor Doutor João Saraiva
e do
COMPROMETE;
Universidade do Minho, ___/___/______
Acknowledgments
Four years have passed and I am finally finishing my PhD studies. These have been times of great joy for many reasons: for start, I’m working on something that I like, research. Also during this period I have had the time to be with my friends and family and to enjoy the life with them. The happiness when a paper is accepted in a conference is also quite something. Then, of course, plan the trip and enjoy the conference and the city where it is taking place is another great reason for my happiness.
I think everyone says that to work on a thesis is only possible because we have the support of those we love and that love us back. I will not say the same think just because everyone says it, but because I fill it! Without the support of these people this simply would not be impossible!
First of all I want to thank my supervisor and friend Jo˜ao Saraiva. He took his time to accept me as his PhD student because, at the time, he thought I was a bit insane... Probably he was right. I hope he has changed his mind, though! But then he decided to trust me and that was very important to me. I am not sure if any other person would do such a risky decision, but I am glade he made it. After he accepted to guide me during these times, he was devoted, supportive and a real research and life guide. His research and life experience are quite inspiring. I have no doubts that he is the best supervisor that I could have chosen! Thank you very much for your dedication to me! Better than having a supervisor is to have two supervisors! The wisdom, incisive comments and brilliant mind of Joost Visser were fundamental for the good results of this work. The fact that he left the department was a great lost to all of us, and specially to me, but that never stopped him to help me during my work. Thank you very much for all what you have done for me!
Martin Erwig came in the end of this work but was quite important. His expertise is inspiring and I know that it will keep motivating me. Thank you for the inspiration! I want to say thanks to many more people, starting by my office colleagues and
friends (not by any specific order): Jo˜ao Paulo (the one that I keep following), Vilac¸a (the one always ready for everything), Paulo (the smartest and slowest one), Andr´e (the industrial one), Ricardo (the one that do not speak, yells!), Filipe (the father one), Mirandˆes (the lesiano one), Jo˜ao Paulo (the one with a band), Nuno (the geek and paranoiac one), Ana (the geek girl), Xico (the professional driver one), Maia (the one with a TV instead of a monitor), Miguel (the men in the greatcoat), Tiago (the one with almost a Porsche) and Paulo (Jesus himself!). As expected, a very thankful word
toOs Sem Estatuto. The sharing of ideas, not research related ones, of course, was of
great help. Thank you very much!
I would like to thank all my outside work friends. Again in no special oder: T´ercio, Marta, Alice, Amadeu, Senhor Engenheiro Malheiro, Raphinha, Xana, Trofa, Z´e and Gonc¸alo. These are the people that are present in the important moments of my life. Somehow, they still keep supporting me! To all of you, thank you very very much for making me happy and enjoying my life!
Now that I’m married, yes I got married during the PhD (nice excuse for some vacations, by the way!), I need to dedicate a paragraph to my wife (otherwise I will have troubles at home!). Actually, I do not need to, but I want to. For many years now, almost a decade, she has been my best friend, my shoulder to cry and basically, my life support machine. Without her encouragement, support and trust it would be impossible to work on something like a PhD. Actually, it would be even difficult to live! Thank you very much for everything! I love you very very much!!!
Finally, I would like to thank my parents: Durante 27 anos tive o incondicional apoio de 2 pessoas, Aristides Cunha e Maria Arminda. Estas s˜ao as pessoas que me apoiaram e me ajudaram a seguir em frente em todas as situac¸˜oes da minha vida, n˜ao apenas durante o doutoramento, mas tamb´em, claro. Pelo vosso amor, que eu sei ser infinito, eu vos agradec¸o do fundo do meu corac¸˜ao! Amo-vos muito!
Some institutions supported the work presented in this thesis. The Por-tuguese science foundation, Fundac¸˜ao para a Ciˆencia e a Tecnologia,
sup-ported this work with a grant (POPH/FSE),SFRH/BD/30231/2006, for the
whole period of studies. The Department of Informatics and the Computer Science and Technology Center of the University of Minho provided me the conditions for my studies. The ACM SIGPLAN Professional Activities Committee supported some conference participations. Software Improvement Group received me as a guest so I could work closely with Joost.
Model-based Spreadsheet Engineering
Spreadsheets can be viewed as programming languages for non-professional program-mers. These so-called “end-user” programmers vastly outnumber professional pro-grammers creating millions of new spreadsheets every year. As a programming lan-guage, spreadsheets lack support for abstraction, testing, encapsulation, or structured programming. As a result, and as numerous studies have shown, the high rate of pro-duction is accompanied by an alarming high rate of errors. Some studies report that up to 90% of real-world spreadsheets contain errors. After their initial creation, many spreadsheets turn out to be used for storing and processing increasing amounts of data and supporting increasing numbers of users over long periods of time, making them complicated systems.
An emerging solution to handle the complex and evolving software systems is
Model-driven Engineering(MDE). To consider models as first class entities and any
software artifact as a model or a model element is one of the basic principles of MDE. We adopted some techniques from MDE to solve spreadsheet problems. Most spreadsheets (if not all) lack a proper specification or a model. Using reverse engi-neering techniques we are able to derive various models from legacy spreadsheets. We
use functional dependencies (a formalism that allow us to define how some column
values depend on other column values) as building blocks for these models. Models can be used for several spreadsheet improvements, namely refactoring, safe evolution, migration or even generation of edit assistance. The techniques presented in this work are available under the framework HAEXCEL that we developed. It is composed of online and batch tools, reusable HASKELLlibraries andOpenOffice.orgextensions.
A study with several end-users was organized to survey the impact of the tech-niques we designed. The results of this study indicate that the models can bring great benefits to spreadsheet engineering helping users to commit less errors and to work faster.
Engenharia de Folhas de C´alculo
Baseada em Modelos
Folhas de c´alculo podem ser vistas como linguagens de programac¸˜ao para progra-madores n˜ao profissionais, ultrapassando estes em n´umero os profissionais, criando milh˜oes de folhas todos os anos. Faltam v´arios mecanismos `as folhas de c´alculo como abstracc¸˜ao, encapsulamento, ou programac¸˜ao estruturada, resultando numa alarmante taxa de erros. Estudos mostram que 90% das folhas de c´alculo usadas no mundo real contˆem erros. Depois da sua criac¸˜ao, muitas folhas acabam por ser usadas para guardar e processar grandes quantidades de dados suportando um numero elevado de utilizadores por longos per´ıodos de tempo, tornando-as assim sistemas complicados.
Uma soluc¸˜ao para manipular sistemas de software complexos ´e usar Engenharia
Dirigida por Modelos(EDM), onde considerar modelos como entidades de primeira
classe e qualquer artefacto de software como um modelo ´e o princ´ıpio b´asico.
Neste trabalho, n´os adaptamos t´ecnicas de EDM para resolver problemas das folhas de c´alculo. A maior parte das folhas de c´alculo n˜ao possui um modelo, mas fazendo uso de engenharia reversa, n´os somos capazes de derivar v´arios modelos a partir de folhas existentes. N´os usamosdependˆencias funcionais(um mecanismo que permite definir como certas colunas dependem de outras colunas) como blocos construtores destes modelos, que por sua vez podem ser usados para v´arias melhorias das folhas de c´alculo como evoluc¸˜ao, migrac¸˜ao ou gerac¸˜ao de assistentes de edic¸˜ao. As t´ecnicas apresentadas neste trabalho est˜ao dispon´ıveis numa plataforma, HAEXCEL, que n´os desenvolvemos. Esta ´e constitu´ıda por ferramentas online e em linha de comandos, bibliotecas HASKELLreutiliz´aveis e extens˜oes paraOpenOffice.org.
N´os organizamos um estudo com v´arias pessoas para inferir o impacto das nossas t´ecnicas. Os resultados indicam que os modelos podem trazer benef´ıcios `a engenharia de folhas de c´alculo, ajudando os utilizadores a serem mais eficazes e eficiente.
Contents
1 Introduction 1
1.1 Spreadsheets . . . 1
1.2 Problem Statement . . . 3
1.3 Some Possible Solutions . . . 6
1.4 Our Solution - An Example . . . 7
1.5 Reviewing Our Solution . . . 12
1.6 Research Questions . . . 15
1.7 Contributions . . . 15
1.8 Structure of the thesis . . . 16
2 Functional Dependencies for Spreadsheets 19 2.1 Introduction . . . 19
2.2 Motivational Example . . . 21
2.3 Relational Databases . . . 25
2.4 Inferring Functional Dependencies from Spreadsheet Data . . . 28
2.5 Inferring Functional Dependencies from Spreadsheet Formulas . . . . 31
2.6 Filtering Functional Dependencies . . . 33
2.7 Normalizing Functional Dependencies . . . 36
2.8 SSFUN: Functional Dependencies for Spreadsheets . . . 39
2.9 Conclusions . . . 41
3 Inferring Models for Spreadsheets 43 3.1 Introduction . . . 43
3.2 Motivational Example . . . 45
3.3 Deriving a Relational Schema . . . 48
3.3.1 Name Inference . . . 50
3.3.2 The Candidate Keys . . . 51 ix
3.3.3 The Foreign Keys . . . 52
3.3.4 The Primary Keys . . . 54
3.3.5 The Relational Intermediate Directed Graph . . . 54
3.3.6 Optimizing the Relational Intermediate Direct Graph . . . 55
3.3.7 The Relational Schema . . . 56
3.4 Deriving aClassSheetSpecification . . . 57
3.4.1 ClassSheets . . . 57
3.4.2 GeneratingClassSheets. . . 59
3.5 Deriving a UML Class Diagram . . . 63
3.5.1 Mapping Blocks . . . 64 3.5.2 Mapping Labels . . . 65 3.5.3 Mapping Classes . . . 65 3.5.4 Mapping Sheets . . . 66 3.6 Evaluation . . . 67 3.6.1 Test Results . . . 67 3.6.2 Discussion . . . 69 3.7 Conclusions . . . 69
4 Spreadsheet Edit Assistance 71 4.1 Introduction . . . 71
4.2 Motivational Example . . . 73
4.3 Bidirectional Auto-completion . . . 77
4.3.1 Generating Visual Objects . . . 78
4.3.2 Generating Spreadsheet Formulas . . . 80
4.4 Formula Copying . . . 82 4.5 Safe Deletion . . . 83 4.6 Non-editable Columns . . . 84 4.7 Traditional Editing . . . 85 4.8 Evaluation . . . 85 4.8.1 Processed Spreadsheets . . . 86 4.8.2 Observations . . . 89 4.8.3 Discussion . . . 89 4.9 Conclusions . . . 90 5 Migration of Spreadsheets 91 5.1 Introduction . . . 91
Contents xi
5.2 Motivational Example . . . 92
5.3 A Constraint-aware Rewriting System . . . 96
5.3.1 Data Refinements . . . 96
5.3.2 Two-Level Transformations with Constraints . . . 99
5.3.3 Representing Spreadsheets and Relational Databases . . . 102
5.4 Migration Rules . . . 105
5.4.1 Refining a Spreadsheet Table to a Relational Table . . . 105
5.4.2 Refining Tables with Foreign Key in the Primary Key . . . 107
5.4.3 Refining Tables with Foreign Key in the Non-key Attributes . 109 5.4.4 Data Refinements as a Strategic Rewrite System . . . 111
5.5 Conclusions . . . 111
6 Safe Evolution of Spreadsheets 113 6.1 Introduction . . . 113
6.2 Motivational Example . . . 115
6.3 A Framework for Evolution of Spreadsheets . . . 118
6.3.1 ClassSheetsand Spreadsheets in HASKELL . . . 118
6.3.2 Specifying Formulas . . . 121 6.3.3 Representing Functions . . . 122 6.4 Spreadsheets Evolution . . . 123 6.4.1 Combinators . . . 123 6.4.2 Semantic Rules . . . 124 6.4.3 Layout Rules . . . 129 6.5 Conclusions . . . 131
7 End-user Validation of Model-based Spreadsheets 133 7.1 Introduction . . . 133
7.2 Study Design . . . 135
7.2.1 Methodology . . . 136
7.2.2 Participants . . . 136
7.2.3 Tasks . . . 137
7.3 Analyzing End-users Performance . . . 139
7.3.1 Effectiveness . . . 140
7.3.2 Efficiency . . . 145
7.4 Threats to Validity . . . 147
7.4.2 Internal Validity . . . 147
7.4.3 External Validity . . . 148
7.5 Conclusions . . . 149
8 The HAEXCELFramework 151 8.1 Introduction . . . 151
8.2 Manipulating Spreadsheets in HAEXCEL . . . 153
8.2.1 Representing Spreadsheets in HASKELL . . . 154
8.2.2 Importing Spreadsheets . . . 155
8.2.3 Exporting Spreadsheets . . . 156
8.3 Functional Dependencies . . . 156
8.3.1 Extracting Schemas and Relations . . . 156
8.3.2 Functional Dependencies in HAEXCEL . . . 157
8.4 Computing Models . . . 159
8.4.1 Generating Entity-Relationship Diagrams . . . 160
8.4.2 GeneratingClassSheets. . . 160
8.5 Edit Assistance for Spreadsheets . . . 161
8.5.1 Bidirectional Auto-Completion . . . 162
8.5.2 Safe Deletion . . . 164
8.6 Migration of Spreadsheets . . . 165
8.6.1 From Spreadsheets to Databases . . . 165
8.6.2 From Databases to Spreadsheets . . . 166
8.6.3 Generating Databases . . . 167
8.7 Evolution of Spreadsheets . . . 168
8.8 Conclusions . . . 171
9 Conclusions 173 9.1 Contributions . . . 173
9.2 Answers to the Research Questions . . . 175
9.3 Future Work . . . 177
Bibliography 181
List of Figures
2.3 An example of a relation representing part of our management
spread-sheet. . . 26
2.4 Two example tables. . . 27
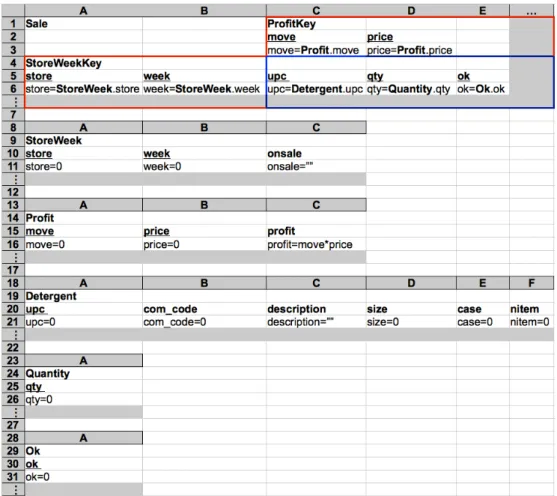
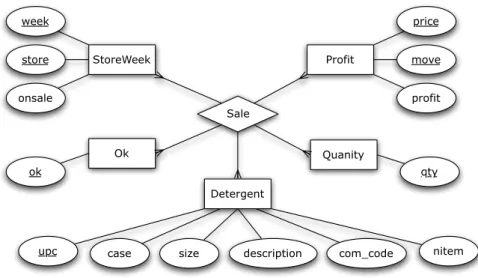
3.1 A spreadsheet representing a sales system for dishwasher detergents. . 45
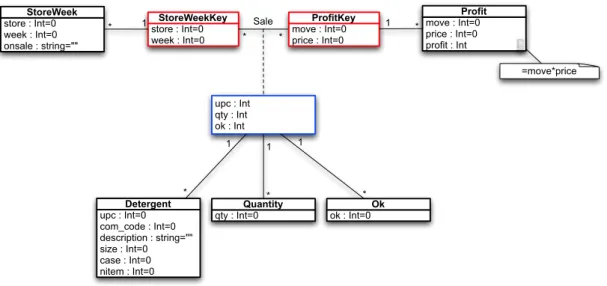
3.2 ClassSheetmodeling the sales system for dishwasher detergents. . . . 47
3.3 A class diagram specifying the sales system for dishwasher detergents. 48 3.4 Graphical representation of Algorithm 4. . . 49
3.5 RID graph for the detergents example. . . 55
3.6 Optimized RID graph for our running example. . . 56
3.7 ER model specifying our running example. . . 57
3.8 An example of aClassSheet: theincomesheet. . . 58
3.9 Generated class for a relationA. . . 59
3.10 GeneratedClassSheetfor relations with foreign keys. . . 59
3.11 ClassSheetof a relationship connecting two relations. . . 60
3.12 ClassSheetwhere on entity has only key attributes. . . 61
3.13 ClassSheet of a relationship with all the key attributes being foreign keys. . . 62
3.14 ClassSheetof a relationship composed only key attributes. . . 62
3.15 TheClassSheetgenerated by our algorithm to the detergents example. 63 3.16 Two models for the incomesheet: aClassSheetand a UML class dia-gram. . . 64
3.17 Mapping default values to UML. . . 65
3.18 Mapping qualified access to UML. . . 65
3.19 A UML class diagram specifying the detergent sale system. . . 66 xiii
4.1 Edit assistance is added to an existing spreadsheet based on functional
dependencies obtained by data mining. . . 72
5.3 The spreadsheet after applying the third normal form refactoring. . . . 94
6.1 Budget spreadsheet instance. . . 115
6.2 Budget spreadsheet model. . . 116
6.3 New spreadsheet and the model that it instantiates. . . 117
6.4 Coupled transformation of data typeAinto data typeA0. . . 118
6.5 Spreadsheet instance of thepurchase ClassSheet. . . 120
6.6 Coupled transformation of data typeAinto data typeA0with references. 121 7.1 Example of a sheet that participants received containing data for in-serting. . . 138
7.2 Global effectiveness results. . . 140
7.3 Effectiveness results for data insertion. . . 142
7.4 Effectiveness results for data editing. . . 143
7.5 Effectiveness results for statistical calculations. . . 144
List of Tables
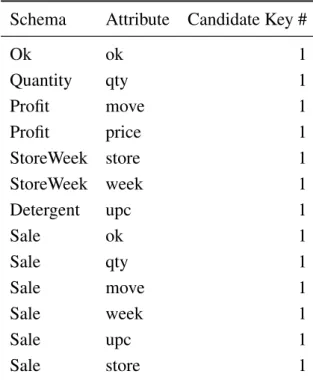
3.1 Table representing the candidate keys for the detergents example. . . . 52
3.2 Table representing the foreign keys for the detergents example. . . 53
3.3 Table representing the primary keys for the detergents example. . . 54
3.4 Results of theClassSheetinference evaluation. . . 68
7.1 Summary of the participants’ data. . . 137
7.2 Number of participants that worked on each spreadsheet/model. . . . 139
7.3 Participations graded under 50%. . . 141
7.4 Grading of post-session questionnaires for participations graded under 50%. . . 141
7.5 Average overhead results. . . 146
List of Algorithms
1 Algorithm to infer functional dependencies from data. . . 30 2 Algorithm to normalize a set of functional dependencies up to the 3NF. 37 3 Algorithm to calculate functional dependencies for spreadsheets. . . . 39 4 Algorithm to calculate a relational schema from schemas with
candi-date keys. . . 49 5 Algorithm to create the foreign keys’ table. . . 53 6 Algorithm to identify relationships. . . 55
Chapter 1
Introduction
Summary
In this chapter we present a small introduction to the concepts that will be studied throughout this thesis. In particular, we introduce spreadsheets, us-ing a simple example. The problems inherent to spreadsheets are described, as well as the solutions we propose to help solving them.
1.1
Spreadsheets
For many people, the programming language of choice is a spreadsheet. This is par-ticularly true for non-professional programmers, often defined as “end-user” program-mers (Nardi 1993). An end-user programmer is typically a teacher, an engineer, a physicist, a secretary, an accountant or a manager. In fact, almost every person but a trained programmer is considered an end user. End users’ interest in computer pro-gramming is usually limited to get a concrete task done; often they are not interested in programmingper se.
End-user programmers outnumber professional programmers, and this difference is projected to increase more rapidly. In fact, as a study performed in 2005 shows, in the U.S. alone, the number of end-user programmers is conservatively estimated at 11 million, compared to only 2.75 million other, professional programmers (Scaffidi
et al.2005). These facts suggest that the spreadsheet, which is a widely used and
com-mercially successful end-user programming language, is also a particularly significant target for the broader application of programming-language design principles.
A spreadsheet is a digital document created with a specific software application 1
that simulates a paper displaying multiple cells that together make up a grid consisting of rows and columns, each cell containing alphanumeric text, numeric values or for-mulas. A formula defines how the content of that cell is calculated from the contents of other cells and it is updated each time those cells are changed. Constant values are also accepted as formula parameters. For example, a formula can be used to sum all the cells of a particular column. Moreover, a cell can be defined by a reference to another cell, thus displaying the referenced cell content. One of the nicest features of spreadsheets is their ability to incrementally recalculate the entire sheet automatically after a change to a single cell is made. Figure 1.1 illustrates a simple spreadsheet.
Figure 1.1: Example of a spreadsheet.
In a spreadsheet, cells are typically identified by the pair column (usually a capital letter) and row (usually a number). In the spreadsheet shown in Figure 1.1 the value in cellA1is the constanta(and alphanumeric text) while cellC3contains the numeric value 3. CellD4 is a formula since it starts with the =sign. The formula adds 2 to the value in cellA2, which is the formula is represented by thereference to such cell trough the textA2.
Historically,Visicalc (O’Donovan 1984) is usually considered the first electronic spreadsheet system. Later,Lotus 1-2-3(Bookbinder 1989) led the spreadsheet market
whenMS-DOS1was the dominant operating system. Nowadays, it isExcel(Campbell
1985; O’Leary 2008) that has the largest market share both onWindowsandMacintosh
platforms. The component Calc from the OpenOffice.org suite (Riley 2009) can be seen as an open source alternative toExcel.
The advent of the internet is changing the way people interact with computers influencing our lifestyle. Internet is also playing an important role in the context of
1.2 Problem Statement 3
spreadsheets. Indeed, spreadsheet systems usually seen as desktop applications are becoming web-based applications. Google Docs (Google 2011) is one of the first examples of a web-based spreadsheet system that is also influencing other systems like the widely used Excel from Microsoft. As a consequence, spreadsheet systems will soon be widely available in our mobile devices, like mobile phones and tablet computers.
In spite of their huge popularity, spreadsheets still have some problems, specially when considered from the point of view of a programming language. The purpose of the next section is to describe some of these problems.
1.2
Problem Statement
Spreadsheet systems offer a high level of flexibility, making it easy for people to start working with them. The downside of this freedom is that it also offers ample op-portunity to create erroneous spreadsheets. In fact, numerous studies report that up to 90% of real-world spreadsheets contain errors (Panko 2000; Rajalingham et al.
2001; Powell and Baker 2003; EuSpRIG 2011). This happens because, as program-ming systems, spreadsheets lack the support provided by modern programprogram-ming lan-guages/environments, namely:
Abstraction The following definition of abstraction, extracted from (Oxford 2011), should help the reader to understand how this term applies to computer science:
Abstract: existing in thought or as an idea but not having a physical or concrete existence.
This definition can easily be adapted to computer science: an abstraction is a gen-eral, non-concrete concept or idea; it is a classification of instances or objects.
A good example of an abstraction is the one ofclassesin the object-oriented (OO) programming paradigm (Meyer 1997). There, it is possible to define a class repre-senting, for example, animals. In such class, only the characteristics of all animals are represented; one does not specify which animal or even the kind of animal it rep-resents. Then, concrete instance of this class can be defined for concrete animals. Unfortunately, this is not possible to accomplish in a spreadsheet environment. It is only possible to define concrete values, not abstract concepts.
Encapsulation Booch et al. (2007) defined encapsulation as “the process of com-partmentalizing the elements of an abstraction that constitute its structure and behav-ior; encapsulation serves to separate the contractual interface of an abstraction and
its implementation”.
The motivation for encapsulation is to achieve higher potential for change accom-modation. It should be possible to improve the internal mechanisms of a component without this having impact on others. Encapsulation also protects the integrity of a component by preventing users from directly and without control changing its internal state. Encapsulation also reduces a system complexity and thus increases its robust-ness since it limits the interdependencies between software components (Booch et al.
2007).
Encapsulation is usually achieved by creating some kind of capsule, that is, some kind of component, possibly with an internal state, which can only be accessed by controlled methods. This is, in general, very difficult, if not impossible, to achieve in a spreadsheet environment.
Type system A type system associates types with each computed value. It may be
defined as “a tractable syntactic framework for classifying phrases according to the
kinds of values they compute” (Pierce 2002). By examining the flow of these values,
a type system attempts to prove that no type errors can occur. The type system in question determines what constitutes a type error, but a type system generally seeks to guarantee that operations expecting a certain kind of value are not used with values for which that operation does not make sense.
Although spreadsheets have a very basic type system (they can distinguish, for ex-ample, numbers and strings), they can not detect when, for exex-ample, the user is trying to sum shoes and ties (in a cloth stock application, for instance). The exception to this is the work made by Abrahamet al. on a system to infer unit and header information for spreadsheets (Abraham and Erwig 2004).
Testing Software testing is a technique used to detect software failures so that defects may be discovered and corrected. Unfortunately, this is a non-trivial task for software in general. In fact, “program testing can be used to show the presence of bugs, but
never to show their absence” (Dijkstra 1970).
Software testing often includes examination of code as well as its execution in var-ious environments and conditions. Moreover, information derived from software
test-1.2 Problem Statement 5
ing may be used to correct the process by which the software is developed (Huizinga and Kolawa 2007).
The fact that data and computations are all on the same level on a spreadsheet makes it difficult to effectively test them. As a consequence, it is difficult to distin-guish input data and computations since there is not a way to clearly define them. An exception to the lack of testing techniques for spreadsheets can be found in (Abraham and Erwig 2006c).
The lack of these important features results in error-prone spreadsheets. Errors are made during the creation of a spreadsheet as well as when it is modified. The problem gets exacerbated when the user modifying the spreadsheet does not fully understand its functionality. These factors make widespread reuse of spreadsheets difficult and prone to errors.
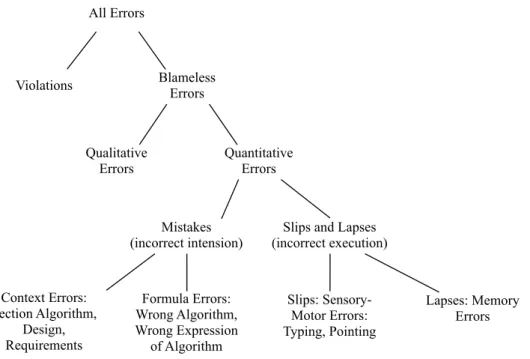
Given this scenario, and to help researchers improving it, Panko and Aurigemma (2010) proposed a spreadsheet error taxonomy as illustrated in Figure 1.2.
All Errors
Violations Blameless Errors
Qualitative Errors Quantitative Errors Context Errors: Section Algorithm, Design, Requirements Formula Errors: Wrong Algorithm, Wrong Expression of Algorithm Slips: Sensory-Motor Errors: Typing, Pointing Lapses: Memory Errors Mistakes (incorrect intension)
Slips and Lapses (incorrect execution)
Figure 1.2: Spreadsheet error taxonomy.
Some of these errors have high impact in company productivity (Croll 2007, 2009) leading to companies and institutions losing millions of dollars (EuSpRIG 2011). In fact, the Jamaican Banking System collapsed in its entirety in the late 1990’s partly due
to the use of spreadsheets and a consequent failure to manage and control them (Le-mieux 2002, 2008).
In the following section we will briefly present existing approaches to solve some of the problems related to spreadsheets.
1.3
Some Possible Solutions
As explained in the previous section, there are several problems with spreadsheets. Several researchers have realized the importance of spreadsheets and have presented several approaches to reduce the incidence of errors in them. These approaches can be divided in two main categories: (1) solutions not directly related to end users, but more indicated for professionals and (2) solutions directly shaped for spreadsheet end users, helping them closely. Category (1) can be subdivided as follows:
1. Recommendations for better spreadsheet design (Ronenet al.1989; Yoder and Cohn 1994; Isakowitz et al. 1995; Rajalingham et al. 2000; Powell and Baker 2003).
2. Auditing spreadsheets to detect and remove errors (Panko 1999; Sajaniemi 2000; Mittermeir and Clermont 2002).
Although the techniques from these two subcategories can be used by end users, they are more indicated to professionals. Recommendations can be taken into account by a professional programmer developing a spreadsheet (that will be then used by an end user). Auditing techniques are in principle used by professional to assess spread-sheets.
On the other hand, category (2) intends to produce techniques to help end users in a daily base, that is, when actually working with spreadsheets:
1. Testing (Rothermelet al.2001; Fisheret al.2002; Burnettet al.2002).
2. Automatic consistency checking (Erwig and Burnett 2002; Ahmadet al.2003; Burnett et al. 2003; Antoniu et al. 2004; Abraham and Erwig 2004; Coblenz
et al.2005).
3. Error prevention techniques (Erwiget al.2005; Engels and Erwig 2005; Cunha
1.4 Our Solution - An Example 7
The first two subcategories, testing and consistency checking, should be used by users to detect errors in their spreadsheets, that is, they give the users some feedback on their errors. Error preventing is intended to help users not creating errors. This is a technique that can be used before testing and checking. In fact, this should make testing unnecessary.
Our approach is intended to work when users are working with a spreadsheet, but in a preventive way, that is, we fit in the error prevention techniques. In the following section we will present our solution.
1.4
Our Solution - An Example
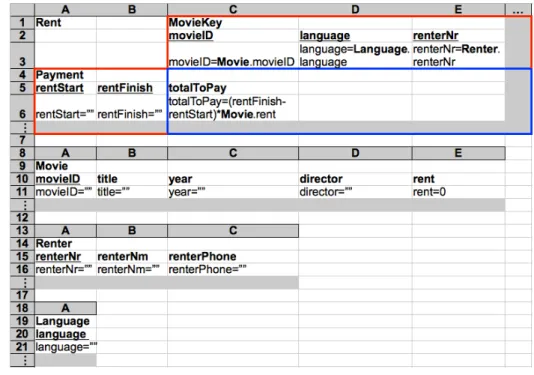
In order to better present our work we shall consider the following example adapted from (Berdagueret al.2007) and modeled in a spreadsheet as shown in Figure 1.3.
Figure 1.3: A spreadsheet representing a movie renting system.
This spreadsheet represents a movie renting system containing information about movies, renters and the leases themselves. ColumnsAtoEcontain information about the movies, columnsF to H contain information about the renters and the remaining columns contain information about the leases (the labels of the columns should be self explanatory).
Having this spreadsheet data, we wish to understand its business model, that is, the semantic of the spreadsheet, its logic. For this simple and small example it is possible for an experienced programmer to define the business model underlying the spreadsheet data. However, this is difficult for an end user, has shown by Abraham and Erwig (2006a). As a consequence, we wish to define techniques to infer the business logic model automatically with no end-user interaction.
Functional Dependencies
The interdependencies between spreadsheet data can be captured by a powerful mech-anism calledfunctional dependencies, a concept from relational databases theory de-scribing the relationship between attributes of a table/relation (Codd 1970).
Let us take as an example the following subset of attributes of the movies ex-ample: {renterNr,movieID,rentStart,rentFinish}. Even non-experts in movie renting systems will accept the following “business” rule:the start and end date of renting and
the rent of a movie determine the total amount to pay. This restriction is an example of
a so-calledfunctional dependencyamong attributes, which can be stated more formally as follows: attribute totalToPay is functionally dependent on rentStart,rentFinish and rent. In the standard practice, this will be abbreviated by writing
rentStart,rentFinish,rent*totalToPay
which has the following, alternative reading:rentStart,rentFinish and rent functionally
determine totalToPay. The left-hand side of the harpoon is termed antecedentof the
functional dependency and the right-hand side consequent. Note that the consequent can be an empty set, meaning that no repetition of antecedent values is allowed.
A second example of a functional dependency is as follows:
renterNr*renterNm
This dependency encodes the fact that the code of a renter, that is, its renterNr deter-mines its name. In other words this means that can not exist two different codes for two different renters. Note that, there can exist two clients with the same name, that is, the dependencyrenterNm*renterNrdoes not hold.
By reasoning on the spreadsheet data we can discover the functional dependencies induced by it. These techniques are usually applied in the database realm which make them not very suitable for spreadsheets.
In our work we refine these techniques to better work with data from spreadsheets using several heuristics to filter out the “accidental” dependencies, that is, the depen-dencies that are in the data but do not reflect any real relationship. This may hap-pen if the data does not represent well enough the situation. For example, if our data would have only one renter it would be impossible to see the relationship be-tween its number and its name. For the movies example, the functional dependency
renterNm*languageexists, meaning that we can determine the language of a movie
1.4 Our Solution - An Example 9
in the spreadsheet isEnglish. As a consequence, not only renterNmdetermines the language, but also most of the other columns determine it. These dependencies are un-usable and should be discarded from further consideration. For our running example, we would like to infer the following dependencies:
language*{}
rentStart,rentFinish,rent*totalToPay
renterNr*renterNm,renterPhone
movieID*title,year,director,rent
language,rentStart,rentFinish,renterNr,movieID*{}
These dependencies reflect the entities present in this system: languages of movies,
payments,renters,moviesandleases themselves.
Inferring Models for Spreadsheets
From the functional dependencies previously defined we would like to compute a nor-malized relational database schema (Codd 1970) reflecting the restrictions imposed by the dependencies. The following schema is a possible solution:
Language(language)
Payment (rentStart,rentFinish,rent,totalToPay)
Renter (renterNr,renterNm,renterPhone)
Movie (movieID,title,year,director,rent)
<Rent> (#language,#rentStart,#rentFinish,#renterNr,#movieID)
This schema has five tables implementing the five entities we have identified above. Notice that the underlined attributes are known as theprimary keysof the tables, that is, the columns that uniquely identify each row of a table. The symbol # marks the
foreign keycolumns, that is, the columns that are references to other columns.
From the inferred relational model, we would also like to devise a ClassSheet
model (Engels and Erwig 2005). ClassSheet models are a formalism to define the model of a spreadsheet, that is, its business rules. A spreadsheet application consistent with the model could be automatically generated, and thus, a large variety of errors could be prevented. Figure 1.4 illustrates the desired model.
Given the similarity betweenClassSheetmodels andUnified Modeling Language
dia-Figure 1.4: ClassSheetmodel representing a movie renting system.
grams fromClassSheets. These diagrams could then be used to support other migra-tions, for example, to the object-oriented paradigm.
Edit Assistance for Spreadsheets
Using the functional dependencies inferred before we would like to generate a new spreadsheet similar to the original one, but with edit assistance, that is, with some kind of help to the user when editing the spreadsheet. Figure 1.5 illustrates such an environment.
Figure 1.5: A spreadsheet representing a movie renting system with edit assistance.
Since we know the relationship between columns, given by the functional depen-dencies, we would like to use them to create a mechanism that automatically fills in
1.4 Our Solution - An Example 11
some columns. The columns with green2combo boxes represent antecedents in func-tional dependencies and the red ones, represent consequents. Since we know that antecedents uniquely determine consequents, when the user selects a value in a green cell, the corresponding red cells are automatically filled in. Such a mechanism is present in the spreadsheet illustrated in Figure 1.5: when the user selected a possible value for themovieIDcolumn (namelymv1), columnstitle,year,directorandrentwere automatically filled in.
Spreadsheet Refactoring
From the relational schema previously inferred, we would like to create a new spread-sheet without data redundancy, that is, without having data repeated several times. Moreover, this spreadsheet should respect the relational schema. Figure 1.6 represents part of a possible refactored movie renting system spreadsheet.
Figure 1.6: Refactored spreadsheet representing a movie renting system. This spreadsheet does not contain data redundancy as opposed to the one presented in Figure 1.3, where, for example, the phone number ofSmithappears three times.
Spreadsheet Migration
Spreadsheets are applications usually created by one end user, without planning ahead of time for maintainability or scalability. Still, after their initial creation, many spread-sheets turn out to be used for storing and processing increasing amounts of data and supporting increasing numbers of users over long periods of time. To turn such spread-sheets into database-backed multi-user applications with high maintainability is not a smooth transition, but requires substantial time and effort.
Having inferred the relational database schema and the data in the same format, a smooth transition from spreadsheets to relational databases is possible. In fact, we would like to be able to generate Structured Query Language(Date 1986) scripts to
create and populate a real relational database. Usingdata refinementtheory, the trans-formation between spreadsheets and databases can be achieved. Data refinementis the systematic substitution of one data type by another in a program. Usually, the new data type is more efficient than the old, but possibly more complex (Morgan and Gardiner 1990; Oliveira 1990, 2008). Rules between the tabular spreadsheet model and the re-lational schema are capable of the transformation between the two models. Moreover, we would like to define the functions that migrate the data between these two data representations. Again, we use data refinement theory so that we can get for free the functions to migrate the data. From this result it is easy to generate the desired scripts.
Evolution of Spreadsheets
The transformation of a spreadsheet into another one with the same data but another layout is a particular case of an evolution step (L¨ammel and Lohmann 2001). Using
theClassSheetmodel presented in Figure 1.4 we would like to define a set of evolution
steps that represent usual updates that users do, for example, inserting a new column or moving part of the spreadsheet to another sheet. When changing a spreadsheet affects the underlying model the probability of making an error is quite high. We would like to create several rules that allow this evolution in a safe way.
The steps described in this section can be generalized and automatized for general spreadsheets. During this thesis we will describe in detail how this can be done. In fact, the process described in this section for the movies example was produced by our techniques.
In the following section we will review our solution from a Model-Driven
En-gineering (MDE) point of view. We will show that, in fact, we have followed the
principles from this field, which are well established and an active area of research.
1.5
Reviewing Our Solution
In this section we briefly introduceModel-driven Engineering (Stahlet al.2006) and explain how our approach follows this well-succeeded approach.
In the last years MDE has emerged as a solution to handle complex and evolving software systems. To consider models as first class entities and any software artifact as a model or as a model element is one of the basic principles of MDE.
1.5 Reviewing Our Solution 13
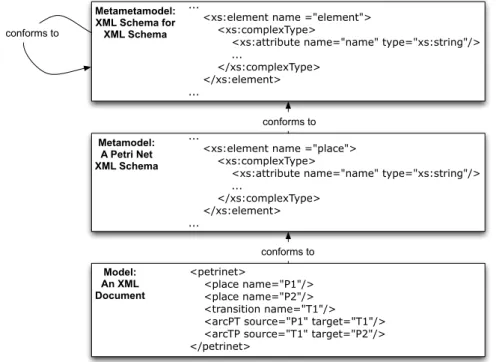
Consider as an example XML (XML 2008). An XML document can be seen as a model while its schema (or DTD) as its metamodel. Figure 1.7 illustrates a three level structure in an XML environment (B´ezivin 2006).
Metametamodel: XML Schema for XML Schema
...
<xs:element name ="element"> <xs:complexType>
<xs:attribute name="name" type="xs:string"/> ... </xs:complexType> </xs:element> ... Metamodel: A Petri Net XML Schema ...
<xs:element name ="place"> <xs:complexType>
<xs:attribute name="name" type="xs:string"/> ... </xs:complexType> </xs:element> ... Model: An XML Document <petrinet> <place name="P1"/> <place name="P2"/> <transition name="T1"/> <arcPT source="P1" target="T1"/> <arcTP source="T1" target="P2"/> </petrinet>
conforms to
conforms to
conforms to
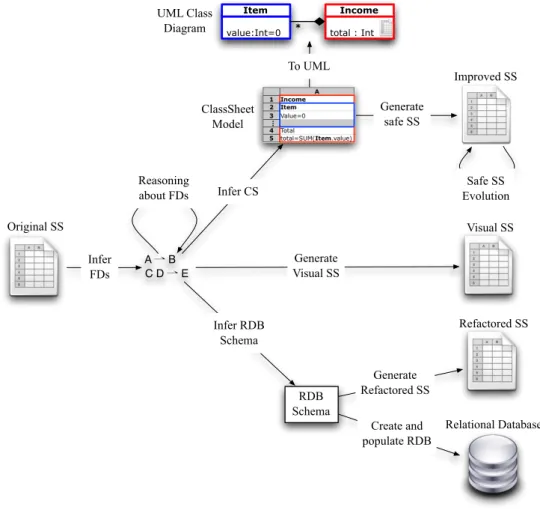
Figure 1.7: A three level structure in an XML environment (B´ezivin 2006). The approach we follow in this work is closely related to the MDE principles. In fact, we consider spreadsheets as models and work with three kinds of metamodels to specify spreadsheets: relational schemas,ClassSheetmodels and UML class diagrams. Consider the illustration of our approach in Figure 1.8.
If we look at it from left to right, we can see that from the original spreadsheet we can automatically infer functional dependencies representing the relationship be-tween the spreadsheet data. By reasoning with this functional dependencies we can infer a relational database schema. These schemas are used in the database realm to model the logic of databases. We can automatically infer this kind of models from ex-isting spreadsheets so they can have some specification of their business logic. From these models we can generate refactored spreadsheets that are normalized (from a data point of view), Refactored SS in the right-hand side of Figure 1.8. Moreover, from these models we can generate scripts to automatically create and populate relational databases (below the refactored spreadsheet). This kind of behavior is common in the MDE approach because it produces good results. In fact, it is quite common to
A ⇀ B C D ⇀ E Generate safe SS Infer FDs Infer CS To UML Original SS Create and populate RDB RDB Schema Infer RDB Schema Improved SS Safe SS Evolution Reasoning about FDs Generate Refactored SS Refactored SS Generate Visual SS Visual SS Relational Database UML Class
Diagram total : Int
Income value:Int=0 Item * ClassSheet Model
Figure 1.8: Overview of the work presented in this thesis.
generate code from models, for example, to generate object-oriented code from UML specifications.
Relational schemas are quite appropriate to model spreadsheets in a data organiza-tion and manipulaorganiza-tion way, but they miss some important characteristics from spread-sheets like, for example, spatial constraints. On the other hand,ClassSheetsallow us to express business object structures within a spreadsheet using concepts from UML. Moreover,ClassSheetmodels allow us to completely specify a spreadsheet. The reader can see in the overview figure that we can automatically generate ClassSheets from spreadsheets. In fact, a spreadsheet application consistent with the model can be auto-matically generated, and thus, a large variety of errors can be prevented. This gener-ated version allows only a finite and controlled set of actions, each of them respecting the model. This is represented in Figure 1.8 as Improved SSon the right-hand side. Once more, this is the kind of behavior one would expect when working in any MDE
1.6 Research Questions 15
setting. TheClassSheetmodel can also be used to generate a more generic model: a UML class diagram (above theClassSheet model in the figure). This allows further transformations to others paradigms using already existing techniques from the UML realm.
A final possible transformation in our work is the generation of a spreadsheet with edit assistance for the user (Visual SSin Figure 1.8). This helps the user introducing data that conforms the previously inferred set of functional dependencies. Once more, this kind of controlled editing approach is based on MDE principles.
We have presented an overview of the solution we propose to improve the produc-tivity of spreadsheets end users. In the next section we will state the research questions we intend to answer with our work.
1.6
Research Questions
In previous sections we have presented some of the problems related to spreadsheets. We have also shown the solution we engineered to solve some of these issues. Next, we list the research questions we will try to answer with this thesis.
RQ1 Can we automatically infer the implicit logic of a spreadsheet and produce a specification or model describing it?
RQ2 Can we use these specifications/models to improve spreadsheet environments in such a way that end users commit less errors, that is, can these models prevent users to commit errors?
RQ3 To which extent can we create specifications for spreadsheets and improve them in a non-invasive way?
In the end of this thesis we will give clear answers to these questions.
1.7
Contributions
With the work presented in this thesis we have made several contributions in different areas such as programming languages or software engineering. A summary of these contributions is presented next:
• We study and present techniques to infer and reason about functional dependen-cies in the context of spreadsheets;
• Using the idiosyncrasies of spreadsheets, we present techniques to automatic inference of relational schemas for spreadsheets, ClassSheetmodels and UML class diagrams;
• Using functional dependencies we can infer edit assistance for spreadsheets in-cluding, for example, the auto-completion of some columns;
• We calculate the formal relationship between spreadsheet models and relational schemas. Rules for the migration between these two fields are presented;
• Based on a relational schema we are able to produce a new spreadsheet that is more organized than the original one and thus better for handling data;
• We improve the 2LT framework (Cunha et al. 2006; Alves et al. 2008; Visser 2008) to support spreadsheet models/specifications (based on ClassSheet mod-els). We also develop a series of common evolution steps for spreadsheets in-cluding, for example, insertion of a column in each instance of a model;
• A study with end users validating the results of our work is presented;
• All the techniques here presented are available under an open source framework, HAEXCEL, that can be reused in other projects.
For a more extensive description of our contributions the reader is referred to Chap-ter 9.
1.8
Structure of the thesis
This thesis is organized as follows:
Chapter 2 presents techniques to derive functional dependencies for spreadsheets.
The filtering and normalization of those dependencies is also presented. This chapter is based on the following paper:
J´acome Cunha, Martin Erwig, Jo˜ao Saraiva. Automatically inferring ClassSheet mod-els from spreadsheets. VL/HCC ’2010. 233–241.
1.8 Structure of the thesis 17
Chapter 3 presents techniques to derive models from functional dependencies for
spreadsheets. Relational database schemas, ClassSheets and UML diagrams can be automatically generated.
This chapter is based on the following papers:
J´acome Cunha, Jo˜ao Saraiva, Joost Visser. From spreadsheets to relational databases and back. PEPM ’2009. 179–188.
J´acome Cunha, Martin Erwig, Jo˜ao Saraiva. Automatically inferring ClassSheet mod-els from spreadsheets. VL/HCC ’2010. 233–241.
Chapter 4 explains how to use the functional dependencies induced in Chapter 2 to
generate edit assistance for spreadsheets. This chapter is based on the following paper:
J´acome Cunha, Jo˜ao Saraiva, Joost Visser. Discovery-based edit assistance for spread-sheets. VL/HCC ’2009. 233–237.
Chapter 5 presents methods to migrate spreadsheets to relational databases. The
inverse process is also explained.
This chapter is based on the following paper:
J´acome Cunha, Jo˜ao Saraiva, Joost Visser. From spreadsheets to relational databases and back. PEPM ’2009. 179–188.
Chapter 6 shows how to specify spreadsheet models in the 2LT platform and how
to use this framework to do evolution of spreadsheet models and instances. This chapter is based on the following paper:
J´acome Cunha, Joost Visser, Tiago Alves, Jo˜ao Saraiva. Type-safe evolution of spread-sheets. FASE ’2011. to appear.
Chapter 7 presents an evaluation of the work here exposed. In this evaluation we
present an empirical study with human subjects using our techniques. This chapter is based on the following technical report:
J´acome Cunha, Laura Beckwith, Jo˜ao Paulo Fernandes, Jo˜ao Saraiva. An empirical study on the influence of different spreadsheet models on end-users performance. DI-CCTC-10-10. 2010.
Chapter 8 presents the framework developed to support all the techniques intro-duced in this work, HAEXCEL.
This chapter is based on the papers referenced on the other chapters.
Chapter 2
Functional Dependencies for
Spreadsheets
Summary
The inference of functional dependencies is a data mining process used in databases, and thus, not very suitable for other paradigms.
In this chapter we present an algorithm to extract functional dependencies from spreadsheet data. We investigate how the idiosyncrasies of spread-sheets can be exploited to infer functional dependencies that well charac-terize the business model of the underlying spreadsheet. For example, the order of columns and the semantic of their labels are considered and used to produce more realistic functional dependencies. Moreover, formulas also induce functional dependencies.
These dependencies can then be normalized so they can help preventing data redundancy, for example.
2.1
Introduction
Spreadsheets are applications often created by one end user, without planning ahead of time for maintainability or scalability. Still, after their initial creation, many spread-sheets turn out to be used to store and process increasing amounts of data and support increasing numbers of users over long periods of time. To turn such spreadsheets into database-backed multi-user applications with high maintainability is not a smooth transition. In fact, it requires substantial time and effort.
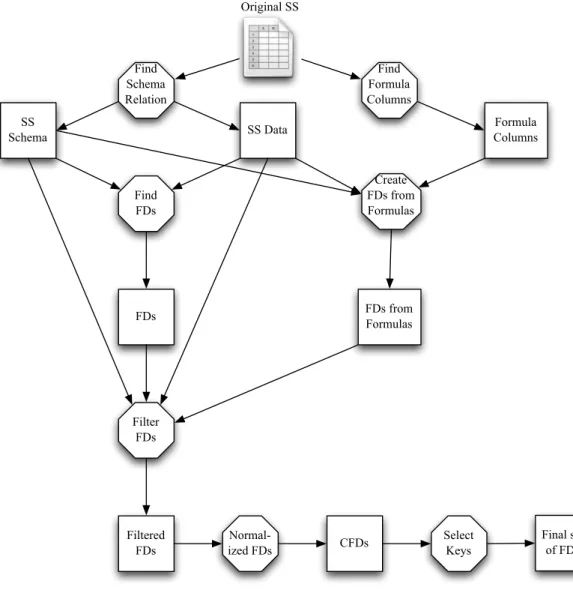
In this chapter, we develop techniques to discover functional dependencies in ex-isting spreadsheets. These dependencies will be the building blocks for further trans-formations, for example, to migrate spreadsheet to database. Figure 2.1 illustrates the steps necessary to infer functional dependencies from spreadsheets. Note that, octag-onal figures represent computations, and squares, results from those computations.
Original SS SS Schema SS Data Formula Columns Filtered FDs FDs from Formulas CFDs Final set of FDs FDs Find Formula Columns Find Schema Relation Create FDs from Formulas Find FDs Filter FDs Normal-ized FDs Select Keys
Figure 2.1: Steps necessary to infer functional dependencies from spreadsheets. We use “regular” data mining techniques to discover all the functional dependen-cies induced by the spreadsheet data, which usually is a big set. In a database, though, the number of functional dependencies that who designs it have in mind is usually small. This means that the inferred functional dependencies are often polluted by “ac-cidental” dependencies, that is, dependencies that are embedded in the data but do not
2.2 Motivational Example 21
characterize the relationships between the data. Thus, these dependencies should be discarded.
In this chapter we also describe how to, based on the idiosyncrasies of spreadsheets, select the relevant dependencies and how to discard the ones that do not characterize the data. For example, we take into consideration the order of the columns and their labels to recognize the dependencies that we should keep and the ones that we should discard. In fact, the techniques here presented only apply to spreadsheets because they use characteristics available only in this paradigm.
Having computed a small and very representative set of functional dependencies, does not make it necessarily suitable to represent the spreadsheet data because it may not be normalized. Thus, we present a technique for the normalization of functional dependencies. Only after this step we can use these dependencies, for example, to create a relational database to store the spreadsheet data.
As we will see in Chapter 3, the functional dependencies inferred in this chapter can be used to construct several models specifying the business logic of spreadsheets.
This chapter is organized as follows. In Section 2.2 we present a motivational ex-ample used throughout this chapter. In Section 2.3 we introduce some concepts from the relational database realm. In Section 2.4 we explain how to extract functional de-pendencies from spreadsheets. The extraction of functional dede-pendencies from spread-sheet formulas is presented in Section 2.5. Sections 2.6 and 2.7 describe techniques to filter and normalize functional dependencies for spreadsheets, respectively. In Sec-tion 2.8 we explain how to combine all the previous techniques to calculate a set of functional dependencies characterizing a spreadsheet’s business logic. Finally, in Sec-tion 2.9 we draw our conclusions of this chapter.
2.2
Motivational Example
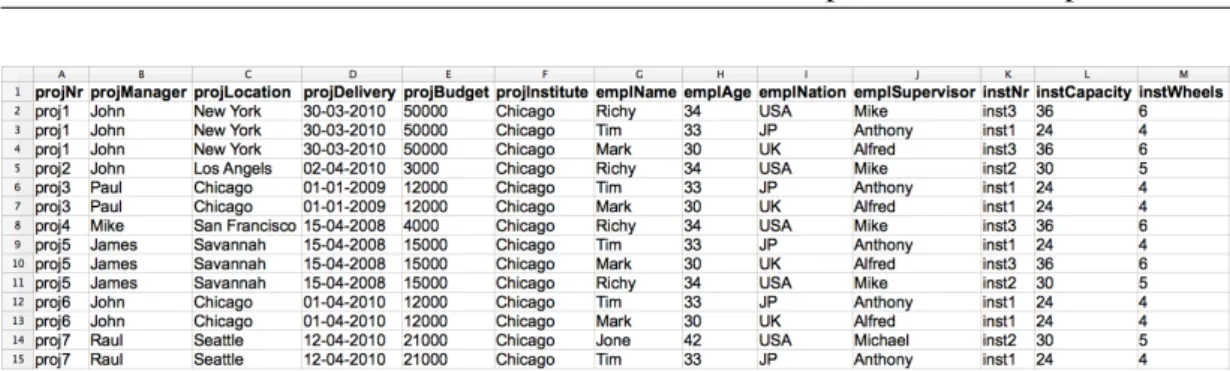
Throughout this chapter we will use an example adapted from (Alhajj 2003) and illus-trated in Figure 2.2.
This spreadsheet reproduces a project management system, gathering information about projects (number, manager, location, delivery date, budget and institute), their workers (name, age, nationality and supervisor) and the instruments they use (number, capacity and number of wheels). The name of each column should give a clear idea
Figure 2.2: A spreadsheet reproducing a project management system.
of the information it represents. The values in column L (labeled instCapacity) are calculated multiplying the values of columnM(labeledinstWheels) by 6.
This spreadsheet defines a valid model to represent the information of the manage-ment system. However, it contains redundant information. Notice that, the displayed data specifies seven projects, but their information is included several times. In fact, some of it is repeated three times! This kind of redundancy makes the maintenance and update of the spreadsheet complex and error-prone. A mistake is easily made, for example, by mistyping a name and thus corrupting the data.
The same information can be stored without redundancy. In fact, in the database community, techniques for database normalization are commonly used to minimize duplication of information and improve data integrity. Database normalization is based on the detection and exploitation offunctional dependenciesinherent in the data (Maier 1983; Ullman 1988; Atzeni and De Antonellis 1993).
Afunctional dependencybetween two columns or sets of columnsAandB, denoted
A*B, means that when projecting the columns inA, if two rows are equal, then, when projecting the columns in Bthe corresponding rows are also equal. For instance, the project number functionally determines the project manager.
The following question arises: Can we leverage these database techniques for spreadsheets?
Based on the data in our example spreadsheet, a standard data mining algorithm will infer the following functional dependencies:
projNr*projManager,projLocation,projDelivery,projBudget,projInstitute
projManager*projInstitute
projLocation*projBudget,projInstitute
projDelivery*projInstitute
2.2 Motivational Example 23
emplName*projInstitute,emplAge,emplNation,emplSupervisor
emplAge*projInstitute,emplName,emplNation,emplSupervisor
emplNation*projInstitute
emplSupervisor*projInstitute,emplName,emplAge,emplNation
instNr*projInstitute,instCapacity,instWheels
instCapacity*projInstitute,instNr,instWheels
instWheels*projInstitute,instNr,instCapacity
projManager,projLocation*projNr,projDelivery
projManager,projDelivery*projNr,projLocation,projBudget
projLocation,projDelivery*projNr,projManager
projManager,projBudget*projNr,projDelivery
projDelivery,projBudget*projNr,projManager
projLocation,emplName*instNr,instCapacity,instWheels
projBudget,emplName*instNr,instCapacity,instWheels
projLocation,emplAge*instNr,instCapacity,instWheels
projBudget,emplAge*instNr,instCapacity,instWheels
projManager,emplNation*emplName,emplAge,emplSupervisor
projLocation,emplNation*emplName,emplAge,emplSupervisor,instNr,
instCapacity,instWheels
projDelivery,emplNation*emplName,emplAge,emplSupervisor
projBudget,emplNation*emplName,emplAge,emplSupervisor,instNr,
instCapacity,instWheels
projLocation,emplSupervisor*instNr,instCapacity,instWheels
projBudget,emplSupervisor*instNr,instCapacity,instWheels
Notice that there are 27 functional dependencies embedded in the spreadsheet data! This big number of dependencies makes it very difficult to reason about them because there is too much entropy, that is, too many dependencies that are not useful.
The first problem is that constant columns appear in multiple functional dependen-cies, for example, columnF, the institute. This implies that this column will appear in most of the functional dependencies. In fact, it will appear as consequent of any functional dependency that has as antecedent a column with two equal values in dif-ferent rows. This situation is quite common in spreadsheets and should be handled in a proper way. A possible solution would be to infer the functional dependencies without considering this column and producing a single functional dependency with
it: projInstitute*{ }. In this case, the consequent of the dependency is the empty set. From the set of inferred functional dependencies we would like to filter out the “accidental” dependencies referred in Section 2.1, that is, the dependencies that do not reflect true relationships among the data. We would like to discover the follow-ing functional dependencies since they define/represent the four entities involved in a project management system: namelyprojects,employees,instrumentsandinstitutes:
projNr*projManager,projLocation,projDelivery,projBudget
emplName*emplAge,emplNation,emplSupervisor
instNr*instWheels
projInstitute*{ }
The second problem is that spreadsheet formulas can induce functional dependencies too. In our running example, columnL(labeledinstCapacity) is calculated using col-umnM(labeledinstWheels). We can say that columnLis determined by columnM. So the functional dependencyinstWheels*instCapacityexists in our example.
These functional dependencies can be normalized: the content of each dependency can be such that the entire set respects certain properties ensuring data consistency.
A common property in databases is thelossless decomposition property: this prop-erty ensures that if we decompose a relation/table into smaller relations, it is possible to undo the process and recover the original relation (Maier 1983). To ensure that the set of functional dependencies obeys to this property we can add a particular func-tional dependency to the current set of dependencies. This dependency has the form
all the columns of our spreadsheet*some new column not used. For our running
example, such dependency is:
projNr,projManager,projLocation,projDelivery,projBudget,projInstitute,
emplName,emplAge,emplNation,emplSupervisor,instNr,instCapacity,
instWheels*newAtt
Normalizing our previous set we get the following new normalized set:
projNr*projManager,projLocation,projDelivery,projBudget
emplName*emplAge,emplNation,emplSupervisor
instNr*instWheels
projInstitute*{ }
instWheels*instCapacity
2.3 Relational Databases 25
In this new set, there are two new functional dependencies: the last one was originated by the dependency introduce to ensure the lossless decomposition property; the one but last was created based in the formula of columnL.
The results presented in this section were automatically produced by the techniques we will formalize in the following sections. With these dependencies we can construct different models for our spreadsheets. These models can be used to generate edit assis-tance for end users, migration techniques, evolution and refactoring of spreadsheets. In fact, we will describe these techniques in the following chapters.
2.3
Relational Databases
In this section we briefly introduce some well established concepts from relational database theory. Most of the definitions here presented are taken from (Maier 1983). These definitions are essential for understanding the work we will present in the rest of this thesis.
A relational schema R is a finite set of attributes {A1, ...,Ak}. Corresponding to
each attribute Ai is a set Di called the domain of Ai. These domains are arbitrary,
non-empty sets, finite or countably infinite. In the context of spreadsheets an attribute usually corresponds to the label of a column, such asprojNrandinstCapacity.
A relation(or table)r on a relational schema Ris a finite set of tuples (orrows)
of the form{t1, ...,tk}. For eacht∈r,t(Ai)must be inDi. Our example has only one table which corresponds to the entire spreadsheet. In general, a table is a set of rows labeled by a row of attributes or labels.
Arelational database schemais a collection of relational schemas{R1, ...,Rn}. A
relational database(RDB) is a collection of relations{r1, ...,rn}.
Each tuple is uniquely identified by a minimum non-empty set of attributes called
primary key(PK).
Some times there may be more than one set of attributes suitable for becoming the primary key. Each of these sets is designated acandidate key (CK) and only one is chosen to become the primary key. To represent schemas with candidate keys, we use a pair where its first part represents a set of candidate keys and its second part represents the rest of the attributes. For example,
({{projNr},{projNr,projManager}},{projDelivery,projBudget})
Aforeign key(FK) is a set of attributes within one relation that matches the primary key of some relation.
Arelationshipis a concept from the entity-relationship modeling framework (Chen
1976): arelationship Rwith participant entities (or relations)R1, ...,Rndefines a set of associations among these entities and is composed by a set of instances. Each instance represents the fact that the entities participating on it are related. A relationship is usually represented by a table in a database.
Some these concepts are illustrated in Figure 2.3.
Attributes
{
Relation
Tuples instNr instCapacity instWheels
inst3 36 6
inst1 24 4
Figure 2.3: An example of a relation representing part of our management spreadsheet. To represent textually a relational database schema modeling part of our running example, we write:
Instrument(instNr,instWheels)
<Work> (#projNr,#emplName,#instNr,#projInstitute)
The first row represents instruments, so we start by writing the name of the rela-tion/table, Instrument. We then write all its attributes within parentheses. The key attributes are underlined. The second row represents theWorkrelationship. It is writ-ten in a similar way asInstrument, but we need to mark the foreign keys, and thus we add as prefix the symbol # to each attribute that is a foreign key. It is also necessary to show that it is a relationship and so we surround the name with symbols<and>.
Given this representation, we now have to different definitions for a relational schema: one where the schema is only a set of attributes, and this new representa-tion with primary and foreign keys and with relarepresenta-tionships. When it is unambiguous, we will use the same term for both definitions. When necessary, we will make it clear which one we are using.
Afunctional dependency between two sets of attributesA and B, written A*B,
holds in a table if for any two tuplest andt0in that tablet[A] =t0[A] =⇒ t[B] =t0[B] wheret[A]yields the (sub)tuple of values for the attributes inA. In other words, if the
2.3 Relational Databases 27
tuples agree in the values for attribute setA, they agree in the values for attribute set
B. The setA is called the antecedentof the functional dependency and the set Bits
consequent. The attributes inAcan be called thekey attributes and the ones inBcan
be callednon-keyattributes.
For instance, in our running example the functional dependency emplName*
emplAgeexists, meaning that the values in columnemplNameuniquely determine the
values in columnemplAge, that is, it models the usual notion that an employee can not have two different names.
Let us take as another example the tables presented in Figure 2.4.
A1 A2 B1 B2
a1 a2 b1 b2 a1 a3 b1 b1
a1 a2 b1 b2 (a) Table inducingA*B.
A1 A2 B1 B2
a1 a2 b1 b2 a1 a3 b1 b1
a1 a2 b2 b2 (b) Table not inducingA*B. Figure 2.4: Two example tables.
LetA={A1,A2}andB={B1,B2}. The data in the table presented in Figure 2.4a encodes the functional dependencyA*B({A1,A2}*{B1,B2}) because rows 1 and 3 have the same values inAand in B. The other row does not affect the dependency because the values inAare different from the others. The data in the table presented in Figure 2.4b does not encode the functional dependencyA*Bbecause, although rows 1 and 3 have the same values inA, the values inBare different. Notice that the value in the third row in columnB1changed fromb1 to b2 (in red) and thus the functional
dependencyA*Bdoes not hold anymore.
Database normalization is important to prevent data redundancy. Although, there are more normal forms, in general, a RDB is considered normalized if it respects the third normal form. Next, we recall the definition of three normal forms (Codd 1972).
Thefirst normal form(1NF) is respected if each element of each tuple contains an
atomic value. This corresponds to a cell having a single value, for example, a cell with a project number can not have two project numbers.
A relation respects the second normal form (2NF) if it respects the 1NF and its non-key attributes are not functionally dependent on part of the key attributes. For example, for a table with key attributes{A,B}and non-key attributes{C},C must be functionally dependent on the entire set{A,B}, that is, not only dependent onAorB.
Thethird normal form(3NF) is respected if the 2NF is present and if the non-key attributes are only dependent on the key attributes. For example, for a table with pri-mary key{A}and non-key attributes{B,C}, it can not exist the functional dependency
B*Cor any other involving the non-key attributes.
2.4
Inferring Functional Dependencies from
Spread-sheet Data
In this section we explain how to extract functional dependencies from the data in a spreadsheet. In fact, this process is similar to extract functional dependencies in databases, which is a complex data mining process. There are several data mining algorithms that perform this task in the context of databases such as TANE (Huhtala
et al. 1999), DEPMINER (Lopes et al. 2000), FUN (Novelli and Cicchetti 2001) or
FD MINE (Yao and Hamilton 2007). Since the process is similar in databases and spreadsheets, we adapted an algorithm from databases to work with spreadsheets. Al-though they produce the same functional dependencies, we choose to use FUNbecause it is considered to be the faster and the most efficient (Novelli and Cicchetti 2001).
FUN receives as input a set of data tuples, that is, a relation. We consider each row of a spreadsheet as a tuple. Therefore, the columns in a spreadsheet represent the attributes of the spreadsheet. Note that, we could also consider columns as tuples and rows as attributes, but this is a less common way to structure a spreadsheet.
A few concepts, taken from (Novelli and Cicchetti 2001), are necessary to under-stand this algorithm.
Cardinality Thecardinalityof a set of attributesX in a relationr, written as|X|r, is the number of distinct values ofX inr.
Free A setXof attributes is said to befreein a relationrif and only if@X0⊂X,|X0|r=
|X|r. Informally, this means that if we projectr with the attributes inX we get a certain number of distinct tuples. For X to be said free, there can not exist a subset of X, say X0, such that the projection over r of X0 contains the same number of distinct tuples of the projection ofX.
Maximal subset A maximal subset ofX is any of its subsets with one attribute less then itself.
2.4 Inferring Functional Dependencies from Spreadsheet Data 29
Closure The closure of a set X, subset of a schema R, in a relation r is defined as
Xr+=X∪ {A∈R\X| |X|r=|X∪A|r}. This means that the closure ofXcontains all the attributes of the relation schemarfunctionally determined byX.
Quasi-closure The quasi-closure of a set X in a relation r is defined as Xr=X∪ S
A∈X(X\A)+r . Informally, the quasi-close of a set of attributesX is the union of the closures of all its maximal subsets andX itself.
FUN is a step-wise algorithm and at each step it handles candidate attributes of increasing length. Each candidate functional dependency is a quadruple with the list of candidate attributesX, its cardinality, the quasi-closure and the closure. At level one it works with candidates of length one computing their cardinality and generating a set of free setsL0. In the next level all possible pairs of distinct attributes are considered.
If the couple in examination is not a free set then it captures at least one functional dependency and at most two minimal functional dependencies that will be yielded by the algorithm. If it is a free set then it is a possible source of functional dependencies and if there is any they will be computed in the next step.
Let us assume that the algorithm is in the stepk. If the considered attribute set is proved to be free it is dealt with at levelk. If not, the candidate encompasses at least a maximal subset having a similar cardinality and the target is the additional attribute in the candidate. Each superset of a non-free set is non-free and cannot be source of minimal functional dependency and so it is not examined in