Segmentation and Estimation of Brain Tumor
Volume in Magnetic Resonance Images Based on
T2-Weighted using Hidden Markov Random Field
Algorithm
Hayder Saad Abdulbaqi
1,2, Mohd Zubir Mat Jafri
a, Kussay N. Mutter
1, Ahmad Fairuz Omar
1,
Iskandar Shahrim Bin Mustafa
1, Loay Kadom Abood
31School of Physics, Universiti Sains Malaysia, Penang, Malaysia. 2Department of Physics, College of Education Al-Qadisiya, Al-Qadisiya, Iraq. 3Department of Computer Science, College of Science, University of Baghdad
Baghdad, Iraq. [email protected]
Abstract—A brain tumor is an abnormal growth of tissue in the brain. The segmentation of brain tumors, which has been manually achieved from magnetic resonance images (MRI) is a decisive and time-consuming task. Treatment, diagnosis, signs and symptoms of the brain tumors mainly depend on the tumor size, position, and growth pattern. The accuracy and timeliness of detecting a brain tumor are vital factors to achieve the success in diagnosis and treatment of brain tumor. Therefore, segmentation and estimation of volume of brain tumor have been deemed a challenge mission in medical image processing. This paper aims to present a new approach, to improve the segmentation of brain tumors form T2-weighted MRI images using hidden Markov random fields (HMRF) and threshold method. We calculate the volume of the tumor using a new approach based on 2D images measurements and voxel space. The accuracy of segmentation is computed by using the ROC method. In order to validate the proposed approach a comparison is achieved with a manual method using Mango software. This comparison reveals that the noise or impurities in measurement of tumor volume are less in the proposed approach than in Mango software.
Index Terms—Brain Tumor; T2-weighted magnetic resonance images; Hidden Markov Random fields; Threshold method.
I. INTRODUCTION
A brain tumors have been created by abnormal and uncontrolled cell division inside the brain [1] measurements of brain tumor images using manual segmentation have been done in clinics practically. However, this process is time-consuming, labor intensive, and subject to considerable variation in intra and inter operator performance. Widely used medical imaging, Magnetic Resonance Imaging (MRI) modality is a diagnostic technique that uses magnetic fields and radio waves to produce a detailed image of the body’s soft tissue and bones, which is constructive for various medical and clinical diagnosis. The brain tumors are greatly issued to be investigated by MRI, where the provided images aid radiologists to detect and determine pathological changes with more accuracy. Then, the brain tumors can be distinguished by different tissues according to their gray level
[2] MRI images have been established as the mainstay isotropic pixel sizing for volumetric analysis. The outweigh of MRI images make it capable of supplying 3D data in comparison with other imaging techniques [3]. This advantage facilitates diagnosing diseases related to internal brain lesion and studying brain diseases. MRI segmentation is an important and fundamental problem in medical image analysis and the accuracy of detecting brain tumor shape, location and volume plays the important role in the success diagnosis and treatment of tumors. MRI images can be segmented into different tissue classes which are cerebrospinal fluid (CSF), gray matter (GM) and white matter (WM) [4]. The segmentation makes divisions to the MRI images that transform them into regions with boundaries with similar attributed pixels. One of the widely applied approach for segmentation is the hidden Markov random field (HMRF) in a series of image analysis. The importance of the HMRF model derive from MRF theory, which is considered as unsupervised image segmentation is that the spatial information in an image is encoded through contextual constraints of neighboring pixels [3] [5] [20] [7] [8] [9] [10] [11]. Imposing such constraints, neighboring pixels can be expected to have the same class labels or similar intensities. This can be achieved by characterizing mutual influences among pixels using conditional MRF distributions. The image segmentation that has been resulted from the proposed approach reveals the gray level and label images which are modeled using random fields and dedicated probabilistic models. This segmentation then consists in, the gray levels, recovering hidden data, the labels, from noisy and blurred observed data [5] [7]. The current study presents a hybrid method which includes two methods; one of them is HMRF-EM, which produces positive initial classification of the image while the other is threshold, which gives the final segmentation. However, HMRF-EM segmentation algorithm for brain T2-weighted MRI images gives good image segmentation and well-estimated parameters for each tissue type. The significance of the detected changes can be assessed by applying thresholding on the final labels obtained by
HMRF-EM algorithm [12]. In this paper, we are going to adopt HMRF for T2-weighted MRI images to classify it into 5 classes to extract brain tumor volume. The maximum likelihood (ML) estimation model for HMRF lacks in classifying all labels regions individually even the same regions are belonging to a signal object, therefore the expectation-maximization (EM) algorithm can be used to solve this problem. In literature, the detection of brain tumor by using HMRF have been largely proposed (Zhang et al., 2001), (Richard et al., 2007). One of the widely used methods in image segmentation is threshold method [13] [14] [15] to change a gray level image into a binary image by selecting a single threshold T value. Then, all the gray level above values T will be classified as black (1), and those below T will be white (0). Since threshold is the simple method of image segmentation, it can be used to make binary images from a gray scale images. Therefore, segmentation and estimation of brain tumor volume in MRI images using HMRF-EM can be utilized to overcome all motional limitations.
II. HIDDEN MARKOV RANDOM FIELD MODEL
[5] proposed the HMRF-EM method of MRI segmentation. This method has been successfully applied to tissue segmentation of multi-channel nor-mal-brain MRI images, especially for T1- and T2-weighted images. In this paper, the HMRF-EM method has been developed using threshold in T2-weighted of MRI im-ages segmentation by using a different number and thickness of images. The concept of Hidden Markov Random Field (HMRF) model is derived from Hidden Markov Model (HMM) [2] [5], which is defined as processes generated by a Markov chain whose state sequence cannot be observed directly, only through a sequence of observations. Hidden Markov random field model which is applied into brain T2-weighted MRI image segmentation has particularly proved its efficiency for the problems in medical imaging [20] [11]. HMRF is a graphical probability model in which the true states are not observed but are estimated indirectly through an observation field. In a HMRF model, there is an observable random field y = (y1, . . . , yN) where each yi is the feature value of a pixel. The goal is to infer a hidden random field x = (x1, . . . ,xN) where xi L (Zhang et al., 2001). In the image segmentation context, xi is a configuration of labels and L is the set of all possible labels. HMRF also holds conditional independent between x and y [5] [8] [16].
( ) ( i i) i s P y x P y x
(1)The sites S is related to one another via a neighborhood system N = {Ni,j
S} , where Ni denotes the sites adjacent to pixel i. A stochastic field X is said to be a Markov random field if for all i S is independent from the neighboring pixels gives its neighborhoods. Thus, the joint probability is:(2)
III. ESTIMATING HMRF USING THE EM ALGORITHM An EM algorithm is used to determine the model parameter θ for each pixel and to solve the class label x. This EM algorithm consists of two steps: the first includes the estimation of the unobservable data which is required to form a complete data set and the second includes the maximization of the expected likelihood function for the complete data set. According to the MAP criterion, we seek the labeling x* which satisfies:
(3)
An MRF can equivalently be characterized by a Gibbs distribution:
(4) where Z is a normalization constant and U (x) is a potential function and is defined as:
(5) and the posterior energy is:
(6) IV. THRESHOLD METHOD
Threshold technique is one of the important techniques in image segmentation. It is determined from the whole image f:
(7) where T is the threshold, complete segmentation can be resulted from thresholding in simple scenes. Thresholding is the transformation of an input image f to an output binary image g as follows [13] [16] [17]:
(8)
The process is completed by ending the segmentation in which the image is scanned pixel by pixel with each pixel labeled as object or background. This scan depends on whether the gray level of that pixel is more or less than the value of T. Applying the threshold presents a clear and simple segmentation because it removes the shadows and keeps only the objects in the image. The objects in the subject are darker than the background, that is to say any pixel with a gray level<T is labeled black while the one whose gray level>T is labeled white. 1 2 1 2 1 1 1 1 2 ( , ,..., , , ,...., ) ( ) ( ) ( ) ( ) n n n k k k k k P x x x y y y P y P x y P y y P x y
arg max
(
,
) ( )
xx
P y x
P x
1 ( ) exp x P x Z U
,
i i,
i s U Y X U y x
,
i i,
i s U Y X U y x
TT f
1 ( , ) 0 ( , )( , )
ifif f i jf i j TTg i j
V. VOXEL IN CT SCAN IMAGES
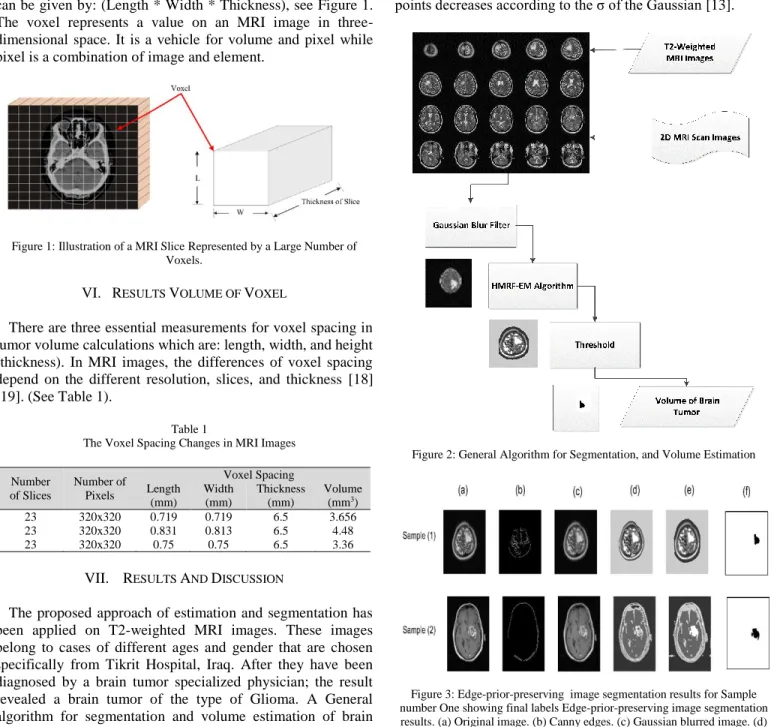
Although the T2-weighted MRI images are represented in 2D formation, it is pos-sible to resample them in a single 3D graph [13] [14]. The voxel is a single pixel that has a thickness and can be given by: (Length * Width * Thickness), see Figure 1. The voxel represents a value on an MRI image in three-dimensional space. It is a vehicle for volume and pixel while pixel is a combination of image and element.
Figure 1:Illustration of a MRI Slice Represented by a Large Number of Voxels.
VI. RESULTS VOLUME OF VOXEL
There are three essential measurements for voxel spacing in tumor volume calculations which are: length, width, and height (thickness). In MRI images, the differences of voxel spacing depend on the different resolution, slices, and thickness [18] [19]. (See Table 1).
Table 1
The Voxel Spacing Changes in MRI Images
Number of Slices Number of Pixels Voxel Spacing Length (mm) Width (mm) Thickness (mm) Volume (mm3) 23 320x320 0.719 0.719 6.5 3.656 23 320x320 0.831 0.813 6.5 4.48 23 320x320 0.75 0.75 6.5 3.36
VII. RESULTS AND DISCUSSION
The proposed approach of estimation and segmentation has been applied on T2-weighted MRI images. These images belong to cases of different ages and gender that are chosen specifically from Tikrit Hospital, Iraq. After they have been diagnosed by a brain tumor specialized physician; the result revealed a brain tumor of the type of Glioma. A General algorithm for segmentation and volume estimation of brain tumor is illustrated in Figure 2.
A. HMRF-EM Algorithm
To get a better result, HMRF-EM needs slightly wide edges of the detected objects in the T2-weighted MRI images and this can be achieved by using Gaussian blur filter. The Gaussian smoothing operator G(x,y) is given by [13].
(9)
The Gaussian smoothing filter si often used; that is because it presents a better smoothing performance than direct average. The advantage of this filter is compared to classical edge operators of small size that is a larger area surrounding the current pixel is taken into account; the influence of more distant points decreases according to the σ of the Gaussian [13].
Figure 2: General Algorithm for Segmentation, and Volume Estimation
Figure 3: Edge-prior-preserving image segmentation results for Sample number One showing final labels Edge-prior-preserving image segmentation results. (a) Original image. (b) Canny edges. (c) Gaussian blurred image. (d) Initial labels obtained by k-means, where k = 5. (e) Final labels obtained by the HMRF - EM algorithm (f) Final tumor region using threshold techniques
figure.
To use the HMRF-EM algorithm for image segmentation, an initial segmentation has to be generated first using k-means clustering on the gray-level intensities of pixels. The initial segmentation provides the initial labels x(0) for the MAP algorithm, and the initial parameters for the EM algorithm [5][20]. The processing of the EM algorithm is then resulted a label configuration x which becomes a refined segmentation. Canny edge detection is applied on the original image in order to get the binary edge map Figure 3-b. Whereas, the Gaussian
2 2 2 2 2 1 ( , ) 2 x y G x y e
blur is applied on the original image to get the observation y Figure 3-c. The obtained results reveals that the initial labels which are resulted from the k-means algorithm have morphological holes, and do not preserve the Canny edges, i.e these labels are not smooth enough Figure 3-d. Thus, the HMRF refines labels overcome all these disadvantages as in Figure 3-e [20]. Th3-elast cons3-equ3-enc3-e of this proc3-ess is r3-epr3-es3-ent3-ed by the production of final labels with 5 classes, 10 EM iterations and 10 MAP iterations (see Figure 3). The proposed HMRF-EM segmentation framework is validated with ROC method, which gives 94% accuracy. The ground truth has been carried out manually.
B. Threshold Method
The basic global thresholding algorithm is based on the concept of computing a global threshold value T, for the entire image, which will be iteratively computed to the level that some criterion is met [14]. The image is then segmented using T to produce two groups G1 and G2. G1 contains pixels with value of gray level greater or less than T and G2 contain pixels with value of gray level equal to T indicating that the G2 group represents a brain tumor area.
The produced image from HMRF-EM includes five classes, i.e. have five values in gray level histograms. Figure 4 shows the different histogram graphs between the produced image and the original image. In the normal case the human's head includes four kinds of tissue, which are skull, white matter(WM), gray matter (GM) and cerebro-spinal fluid (CSF). In case there is a brain tumor, then the total of classes is five, thus we have chosen k=5. There is a difference in intensity between the skull and other kinds of tissue as in Figure 4, that the skull has high intensity while other soft tissues have low intensities. We can specify the range of brain tumor intensity between skull and other kinds of tissue, since it is less than the skull intensity and higher than the other tissues intensity, as in Figure 4.
Figure 4(a) Original Image. (b) Segmented Image (c) Histogram for Original Image (d) Histogram for Segmented Image
C. Estimate and Validate Volume of Brain Tumor
To calculate the volume of the segmented tumor region through the final image which is resulted from the process of
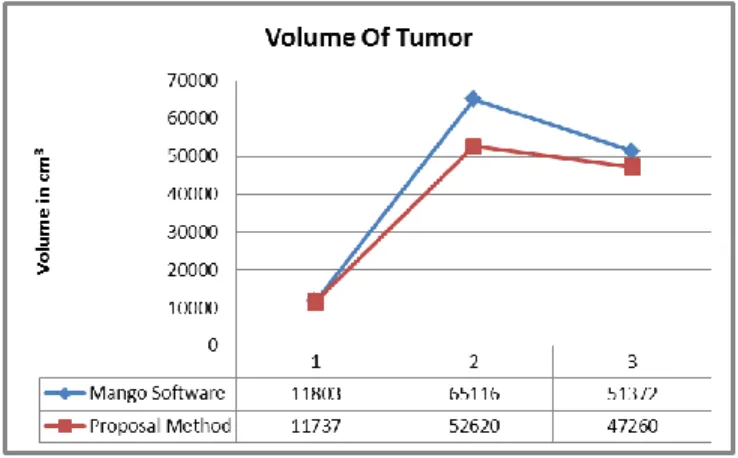
threshold method, the total number of pixels which are located in the region of the tumor can be calculated as well as the value of the area volume using the value of voxel space. The whole size of the tumor can be then calculated by collecting all slices sizes containing the tumor areas. The results show that the volumes of tumors, which have been obtained using the proposed method, are in average (4%) less than the volumes of the manual method using Mango software. This is because the noise or impurities in the proposed method are less than the manual method. For testing and validation, the proposed method has been compared with manual method using Mango software, the comparison is shown in Table 2. It is obvious from Figures 5 that the relationship between the proposed method and Mango software shows that the proposed method has a less number of voxel than Mango software. This is because the Mango software reveals noise after the segmentation process which eventually leads to increase in the number of voxel than the proposed method.
Figure 5: Relationship between the Proposal Method and Mango Program with Volume
Table 2
Result of Volume of Tumor using Propose Method
Name
Proposed Method Mango Software Sum of Voxel Volume in cm3 Sum of Voxel Volume in cm3 Hifa Ahmad Najim 3493 11.737 3515 11.803 Hasna Alwan Umran 7124 52.620 8822 65.116 Rashed Kadhum Alwan 10529 47.260 11438 51.372
VIII. CONCLUSION
This research aims to present a positive contribution approach to facilitate diagnosing the brain tumor throughout T2-weighted MRI images by using a HMRF-EM algorithm, which is carried out then to gain the final labels. Threshold method has been applied to the obtained results out of the HMRF-EM algorithm and is validated with ROC method, which gives 94% accuracy. The range of the (T) value can specify from the brain tumor intensity between skull and other kinds of tissue, since it is less than the skull intensity and higher than the other tissues intensity. The Segmentation of each of 2D images, which have been obtained from T2-weighted MRI
images. The obtained results indicate a high accuracy segmentation of T2-weighted MRI brain tumor images based on the ultimate finding of the whole procedure that is more useful comparing to manual method and gives the possibility of calculating the volume and shape of the brain tumor with respect to the brain. Notably, the physician can apply and execute the proposed approach to detect the tumor accurately and efficiently for successful diagnosis and treatment.
ACKNOWLEDGMENT
This work was supported under the grant No. 1001/PFIZK/811220 of the Universiti Sains Malaysia (USM) and fundamental research grant No. 203/PFIZK/6711349.
REFERENCES
[1] Kaye, A. H. and Laws Jr, E. R., “Brain tumors: an encyclopedic approach”
Elsevier Health Sciences, 2011
[2] Duquette, A. A., Jodoin, P.-M., Bouchot, O. and Lalande, A., “3D segmentation of abdominal aorta from CT-scan and MR images”,
Computerized Medical Imaging and Graphics, vol. 36, pp. 294-303, 2012. [3] Pradhan, S., “Development of Unsupervised Image Segmentation
Schemes for Brain MRI using HMRF model” (2010).
[4] Zivadinov, R. and Pirko, I. (2012). Advances in understanding gray matter pathology in multiple sclerosis: are we ready to redefine disease pathogenesis?. BMC neurology, vol. 12, p. 9.
[5] Zhang, Y., Brady, M., and Smith, S., “Segmentation of brain MR images through a hidden Markov random field model and the expectation-maximization algorithm”, Medical Imaging, IEEE Transactions on, vol. 20, pp. 45-57, 2001.
[6] Wang, Q., “HMRF-EM-image: implementation of the hidden markov random field model and its expectation-maximization algorithm”, 2012a.
arXiv preprint arXiv:1207.3510.
[7] Richard, N., Dojat, M., and Garbay, C., “Distributed Markovian segmentation: Application to MR brain scans”, Pattern Recognition, vol. 40, pp. 3467-3480, 2007.
[8] Nie, J., Xue, Z., Liu, T., Young, G. S., Setayesh, K., Guo, L. ., “Automated brain tumor segmentation using spatial accuracy-weighted hidden
Markov Random Field”, Computerized Medical Imaging and Graphics,
vol. 33, pp. 431-441, 2009.
[9] Solomon, J., Butman, J. A., and Sood, A. (2006) Segmentation of brain tumors in 4D MR images using the hidden Markov model. Computer methods and programs in biomedicine, vol. 84, pp. 76-85
[10] Dwyer, M. G., Bergsland, N. and Zivadinov, R. (2014).Improved longitudinal gray and white matter atrophy assessment via application of a 4-dimensional hidden Markov random field model. Neuroimage, vol. 90, pp. 207-217.
[11] Abdulbaqi, H. S., Mat, M. Z., Omar, A. F., Mustafa, B. , Shahrim, I. and Abood, L. K., “Detecting brain tumor in Magnetic Resonance Images using Hidden Markov Random Fields and Threshold techniques”,
Research and Development (SCOReD), 2014 IEEE Student Conference on, pp. 1-5, 2014a.
[12] Abdulbaqi, H. S., Jafria, M. Z. M., Omar, A. F., Mustafa, I. S. B. and Aboodc, L. K., “Detecting brain tumor in computed tomography images using Markov random fields and fuzzy C-means clustering techniques”,
AIP Conference Proceedings, p. 060004, 2015.
[13] Sonka, M., Hlavac, V., and Boyle, R., “Image processing, analysis, and machine vision: Cengage Learning”, 2014.
[14] Gonzalez, R. and Woods, R. “Digital Image Processing: Pearson Prentice Hall”, Upper Saddle River, NJ, 2008.
[15] Rajinikanth, V. and Couceiro, M., “RGB Histogram Based Color Image Segmentation Using Firefly Algorithm”, Procedia Computer Science,
vol. 46, pp. 1449-1457, 2015.
[16] Al-Amri, S. S. and Kalyankar, N. V., “Image segmentation by using threshold techniques, 2010. arXiv preprint arXiv:1005.4020.
[17] Abdulbaqi, H. S.,. Jafri, M. Z. M, Omar, A. F.. Mustafa, I. S. B., and Abood, L. K., “Detecting Brain Tumor in Computed Tomography Images Using Hybrid Method Hidden Markov Random Fields and Threshold Techniques”, J. Appl. Sci. & Agric, vol. 9, pp. 170-176, 2014b. [18] Cooper, D., Turinsky, A., Sensen, C. and Hallgrimsson, B., “ Effect of
voxel size on 3D micro-CT analysis of cortical bone porosity”, Calcified tissue international, vol. 80, pp. 211-219, 2007.
[19] Zheng, Y., Barbu, A., Georgescu, B., Scheuering, M. and Comaniciu, D., “Four-chamber heart modeling and automatic segmentation for 3-D cardiac CT volumes using marginal space learning and steerable features”, Medical Imaging, IEEE Transactions on, vol. 27, pp. 1668-1681, 2008.
[20] Wang, Q., “GMM-Based Hidden Markov Random Field for Color Image and 3D Volume Segmentation”, 2012b. arXiv preprint arXiv:1212.4527.