Behzad Rouhieh
A Ph.D. Dissertation in
the Department of
Building, Civil and Environmental Engineering
Presented in Partial Fulfillment of the Requirements for the Degree of Doctor of Philosophy (Civil Engineering) at
Concordia University
Montreal, Quebec, Canada
iii Behzad Rouhieh
Concordia University, 2016
Traffic congestion has been one of the major issues that most urban areas are facing and thus, many solutions have been developed and deployed in order to mitigate its negative effects. Advanced Traveler Information Systems (ATIS) have been used over the past two decades to provide travelers with pre-trip or real-time traffic information. Most of the efforts have focused on providing timely traffic information at locations with regularly occurring congestion. ATIS can be used to provide travelers with pre-trip and on-route travel information necessary to improve trip decision making with respect to various criteria (e.g. minimizing delay, constraining travel to specific modes). Many jurisdictions within Canada and the United States have implemented the 511 travel information system that provides traffic information, road conditions and closures, traffic cameras, etc.
Several studies were conducted on vehicle routing optimization methods in ATIS. Most of them consider passenger vehicles as the only transportation mode in their routing algorithm. Others that include two transportation modes are mostly based on shortest path algorithms. However, a probabilistic based route optimization approach could better capture the stochastic characteristic of road traffic conditions. This research investigates an adaptive routing methodology for multi-modal transportation networks. A routing algorithm based on Markov decision processes is proposed to capture short-term traffic characteristics of transportation networks. Graph theory is used to model typical travel behavior within a multimodal network.
iv
predefined timetables. The proposed routing algorithm applies an iterative function to select the optimal transportation mode/route through the network junctions along a given path.
The proposed methodology is applied to several real-world networks of motorized and non-motorized modes located in the central business district in Toronto, Ontario, and Montreal and Longueuil in Quebec. The networks include train, bus, streetcar, subway and bicycle transportation facilities. Microsimulation models of the networks developed in VISSIM and AIMSUN are used to estimate travel times along major arterials, for all transportation modes and for different traffic demands and congestion levels. The simulation models were calibrated using volume and speed data. The developed routing algorithm is applied to several scenarios in order to estimate optimal routes for a hypothetical traveler moving between two arbitrarily selected nodes in the network. The results identify the most efficient combination of transportation modes that the travelers have to use given specific constraints pertaining to traffic and transit service conditions. It is also shown that by applying the proposed algorithm to bus lines, transit agencies can have significant cost savings by rerouting their fleet.
The results of the proposed research have the potential to be integrated into various Intelligent Transportation Systems applications by combining available traveler information services. It can assist travelers in making more informed decisions regarding their travel plans and provide transportation agencies with an overall assessment of the system and its performance. For
vi
Alecsandru, for his continuous motivation, support and invaluable advice throughout my studies. I also gratefully acknowledge my supervising committee: Dr. Saunier, Dr. Zayed, Dr. Li and Dr. Hamza for their knowledgeable advice. This thesis owes an enormous debt to them due to their professional and selflessness guidance.
I am proud to acknowledge that the support for this study was provided through the “Fonds
québécois de la recherche sur la nature et les technologies” scholarship no. 140734. I thankfully
acknowledge that a Paramics model with related traffic data was provided by Prof. Baher Abdulhai of the University of Toronto for research use. I would like to thank Ministère des Transports du Québec, Direction de l'Est-de-la-Montérégie for providing the traffic data and signal timing plans.
I would like to extend my gratitude to my friends, colleagues at Concordia University Transportation lab and CIMA consulting company: Matin Foomani, Siamak Sarhaddi, Reza Omrani, Golnaz Ghafghazi, Pedram Izadpanah, Alireza Hadayeghi, Brian Malone, Chantal Dagenais and Suzanne Demeules for their continuous support. Special thanks are due to Hamid, Soraya and Shahrzad Mobasherfard for their unconditional support and encouragement. I also want to express my deepest gratitude to my girlfriend Glareh Amirjamshidi who supported me during the final, critical months of my dissertation, and made me feel like anything was possible.
Last but not least, I wish to express my warmest appreciation and love to my wonderful parents, Mahvash and Taghi and my trustworthy brother, Behnam and his kind wife Nikoo for their continuous inspiration and support. I am indebted to their unconditional love and encouragement.
viii
ABSTRACT ... iii
TABLE OF CONTENTS... viii
LIST OF TABLES ... xi
LIST OF SYMBOLS ... xii
LIST OF ABBREVIATIONS ... xiii
CHAPTER 1. INTRODUCTION ... 1
1.1 Problem Statement ... 1
1.2 Research Objective ... 2
1.3 Research Methodology ... 3
1.4 Thesis Organization ... 6
CHAPTER 2. LITERATURE REVIEW ... 7
2.1 Passenger Vehicle Routing ... 7
2.2 Transit Routing ... 15
2.3 Multimodal Transportation Network Models ... 22
2.4 Route Choice Models for Transportation Networks ... 29
2.5 Application of Markov Analysis in Transportation ... 32
2.6 Traffic Conditions Prediction Models ... 41
2.7 Concluding Remarks ... 45
CHAPTER 3. METHODOLOGY ... 48
3.1 Network Modeling ... 49
3.2 Routing Algorithm Using Markov Decision Processes (MDP) ... 54
3.3 Evaluation of Traffic Conditions and Transition Probability Matrix in MDP ... 61
3.4 MDP Flowchart to identify Optimal Route ... 62
3.5 Discussion on Transition Probability in Transportation Network ... 93
CHAPTER 4. ANALYSIS AND RESULTS ... 100
4.1 Montreal case study ... 100
ix
4.2 Toronto case study ... 117
4.2.1 Network Model ... 118
4.2.2 Model Calibration ... 123
4.2.3 Traffic Conditions and Transition Probabilities... 127
4.2.4 Public Transit Network ... 132
4.2.5 Routing Constraints... 135
4.2.6 Analysis Results ... 135
4.2.7 Sensitivity Analysis ... 139
4.2.8 Discussion... 141
4.3 Longueuil case study ... 143
4.3.1 Model Calibration ... 146
4.3.2 Experimental Analysis ... 147
4.3.3 Computation Results ... 151
4.3.4 Sensitivity Analysis ... 155
4.3.5 Discussion... 157
CHAPTER 5. CONCLUSION AND RECOMMENDATIONS ... 158
5.1 Conclusion ... 158
5.2 Major Contributions ... 161
5.3 Research Limitations ... 163
5.4 Recommendation and Future Work ... 164
5.4.1 Current study enhancement area ... 164
5.4.2 Current study extension area ... 165
PUBLICATIONS ... Error! Bookmark not defined. REFERENCES ... 167
APPENDIX A: AIMSUN Simulation Results ... 178
APPENDIX B: Public Transit Schedule ... 185
x
Figure 2: Sequence of states, decisions, transitions and penalties for an MDP. ... 58
Figure 3: MDP Flowchart ... 66
Figure 4: Example Network ... 69
Figure 5: Time-Step Threshold Optimization Subroutine ... 96
Figure 6: Plan of study area (Source: Google Maps©) ... 102
Figure 7: Public transportation network within the study area (drawing not to scale) ... 103
Figure 8: Modeled network (nodes/node), Montreal case study ... 109
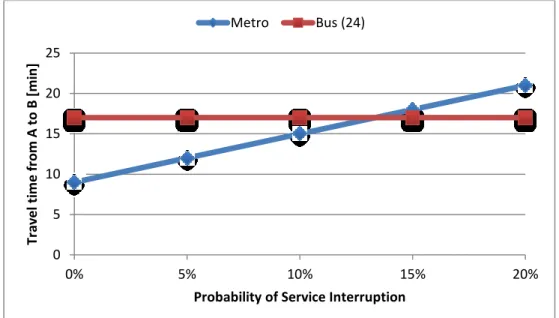
Figure 9: Travel time impact due to different probability values of service interruption at Metro (Departure 4:00 pm) ... 114
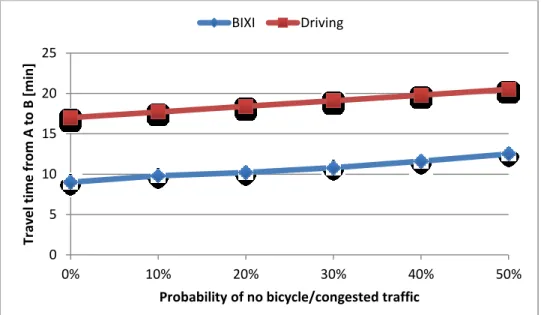
Figure 10: Travel time impact due to different probability values of bicycle unavailability and different probability values of traffic congestion occurrence ... 115
Figure 11: Layout of the study area, roadway network and select transportation modes (Source: Google Earth) ... 117
Figure 12: Schematic model of the nodes/node numbers within the network ... 119
Figure 13: Schematic model of the links/link numbers within the network ... 120
Figure 14: GIS network acquired from LIO and the study area in this project ... 122
Figure 15: Study area modeled in AIMSUN ... 122
Figure 16: GEH Statistics Calculations for the modeled study area ... 126
Figure 17: Speed profile used for calibration – Gardiner Expressway ... 127
Figure 18: Sample of 15-minute interval average speed profile along Dufferin St. (NB) ... 128
Figure 19: Transit network within the study area ... 134
Figure 20: Traveler’s optimal route ... 137
Figure 21: Second alternative route ... 138
Figure 22: Preferred route under normal traffic condition ... 139
Figure 23: Layout of Study Area (Source: Google Maps) ... 144
Figure 24: Alternative scenarios: lane closures in the network ... 145
Figure 25: Bus routes: nodes and links ... 145
xi
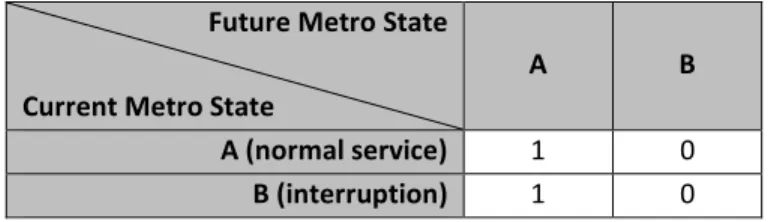
Table 2: Transition Probability Matrix for Metro Network ... 107
Table 3: Transition Probability Matrix for Bixi Network ... 107
Table 4: Sample route/station node parameters for metro and bus modes ... 110
Table 5: Estimated travel times for select modes from A to B – No Service interruption at metro is expected (Departure at 4:00 pm) ... 111
Table 6: Estimated travel times for select modes from A to B – 20% chance of metro service interruption (Departure at 4:00 pm) ... 112
Table 7: Estimated travel times (A to B) for different departure times ... 113
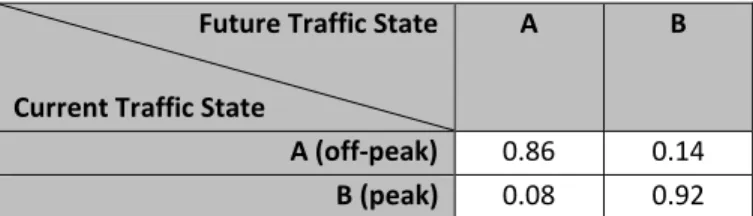
Table 8: Transition Probability Matrix (Arterials) ... 129
Table 9: Transition Probability Matrix (Highway) ... 131
Table 10: Transition Probability Matrix (Study Network) ... 131
Table 11: Initial probability matrix when ... 132
Table 12: Estimated travel times for select routes from A to B ... 136
Table 13: Estimated travel times for select routes from A to B (revised transition probabilities) ... 139
Table 14: Estimated travel times for select routes from A to B (revised transition probabilities) ... 140
Table 15: Estimated travel times for select routes from A to B (Different transition probability Matrices for arterials and highway) ... 141
Table 16: Vehicle input volumes ... 149
Table 17: Results of the t-test analysis for the travel time difference ... 151
Table 18: Average travel time simulation results for select links (see Figure 25) ... 152
Table 19: Sample optimal routing results for the study network... 154
xii
𝑠𝑖 Transit Station 𝑖
𝑟𝑖 Transit Route number 𝑖
𝑧𝑖 Transit mode 𝑖
𝑡𝑟𝑧𝑖 Departure/Arrival time at route number r, for mode 𝑧
𝑖
𝑤𝑟(𝜏) Link weight (travel time) on route r, at time t
𝑃𝑇 One-step transition probability matrix
𝑂 Origin node
𝐷 Destination node
N Number of nodes
𝐼 Number of states
𝑃(𝑛) State probability vector for the 𝑛𝑡ℎ node
𝑒(𝑛) Expected total penalties (travel time/cost) between node 𝑛 and
destination
𝑄𝑛+1(𝑛) Matrix of penalties from node 𝑛 to 𝑛 + 1, in each possible state
R Route list to include all the interconnected nodes that build a route
between the origin and destination
Kn Set of directly connected (adjacent) nodes to node 𝑛
Mj Set of transportation modes related to each node in R
𝑅𝑜𝑝𝑡 Optimal route
𝐸𝑚𝑖𝑛 Expected minimum penalty for the optimal route
xiii AMT Agence Métropolitaine de Transport
APTS Advanced Public Transit Systems ATIS Advanced Traveler Information Systems CBD Central Business District
EB East Bound
GTA Greater Toronto Area
ITS Intelligent Transportation Systems
MDP Markov Decision Process
MTO Ministry of Transportation Ontario MTQ Ministry of Transportation Quebec
NB North Bound
RTL Réseau de transport de Longueuil
SB South Bound
STM Société de Transport de Montréal TTC Toronto Transit Commission
VB Visual Basic
1
CHAPTER 1.
INTRODUCTION
Deployment of Intelligent Transportation Systems (ITS) improves the performance of the transportation system by using modern electronics and communications technologies. Advanced Traveler Information System (ATIS) and Advanced Public Transit Systems (APTS) are two types of ITS user services that aim to ameliorate traffic operations on urban transportation networks. The benefits of ATIS and APTS implementation are more evident under congested traffic conditions, either recurrent (due to morning and afternoon peak travel demand periods) or non-recurrent (e.g. due to incidents that hinder available road capacity).
1.1 Problem Statement
Several studies have shown the benefits of using various ATIS and/or APTS applications to reduce traffic congestion, economic productivity loss and greenhouse gas emissions. Currently, several Canadian agencies have deployed different ITS applications available to the travelling public. For example, up-to-date information about highways is accessible via phone or a dedicated website for several provinces, e.g. 511 Traveler Information Center in Nova Scotia (Road Conditions 511, 2012) and Quebec (Quebec 511, 2012). Moreover, many travel operators provide real time schedule of their services. However, corroborating road traffic conditions with public transportation services and other non-motorized transportation modes information is expected to further enhance the traveling experience by providing more efficient and reliable transportation services. Within large urban agglomerations, this is expected to be beneficial for both the traveling public and transportation operators.
2
ATIS/APTS can be used to provide travelers with pre-trip and/or on-route information concerning traffic conditions, travel options as well as real-time advice on navigating through the transportation network, where travel conditions may change rapidly several times during the course of a typical day. The major benefits of this type of ITS applications, as shown in several studies, are the expected reduction in travel time delay, typically obtained by providing optimal route information. Mostly, this is done based on the online data made available at any time to the travelers who want to plan or make necessary adjustments to minimize their trip travel times. Moreover, transit operators would benefit by managing their fleet more efficiently and by providing passengers with more reliable services. For example, in case of incidents that cause severe traffic congestion, a transit agency would be able to minimize the disruption to the original timetable and reduce the impact on the operating costs by rerouting buses at certain nodes using real-time information about traffic conditions. This research proposes a novel and versatile methodology to provide adaptive routing in multimodal transportation networks. The proposed methodology is applied to real-world test cases to validate its effectiveness.
1.2 Research Objectives
The main objectives of the research presented in this dissertation are:
[1] to advance a novel routing methodology based on graph theory;
[2] to integrate different transportation modes into the methodology;
[3] to demonstrate that the proposed methodology is able to realistically capture the
3
[4] to identify the optimum route within a multi-modal transportation network. This can be
achieved by targeting a specific optimization criterion. For example, one may use the proposed modeling approach in order to minimize the impact of congested traffic conditions on the overall travel time and/or cost for travelers and/or transit agencies.
1.3 Research Methodology
The proposed methodology uses a routing algorithm implemented based on a Markov Chain with Reward model. The optimization criterion used by the developed algorithm seeks to minimize the negative impact of congested traffic conditions on users’ routing. Several real-world case studies are tested to demonstrate the feasibility of the proposed method. To achieve the proposed objectives, the following tasks have been conducted:
1. Defining a generic representation of each physical transportation network
corresponding to different transportation modes (i.e. road, transit and rail). Since public transportation services operate based on a predefined schedule, in order to be able to realistically integrate this type of networks, the developed model accounts for the fixed schedule of public transportation services as well as stochastic variability of the observed travel times.
2. Collecting and processing transportation related data from several sources (e.g.
provincial and municipal transportation authorities, etc.) to integrate in the transportation network model. In this task, several traffic data and information sources were considered depending on the location and the type of the transportation networks used. A set of stochastic properties pertaining to the study networks were investigated
4
- including short-term fluctuation of travel demand, transit schedule and non-recurrent congestions along major arterials. Traffic data (e.g. speed, travel time, etc.) were obtained from transit authorities/agencies.
We have acquired traffic data from the Ministry of Transportation of Quebec. The schedule of the transit services was collected from the Agence Métropolitaine de
Transport (AMT), the Société de Transport de Montréal (STM) and Toronto Transit
Commission (TTC). Additional information about the bicycle sharing services (i.e. BIXI in Montreal and Bike Share in Toronto) was obtained from the transportation departments of Montréal and Toronto. A database was developed in Excel to provide concurrent access to the collected data.
3. Developing and calibrating microscopic simulation models in Vissim and Aimsun to
estimate travel times for major arterials and all transportation modes under several traffic demand and congestion scenarios. The results were used to emulate the lack of available historical traffic data of the real-world transportation networks used in this thesis to test the route optimization algorithm.
4. Developing an optimal route algorithm that can be used in user equilibrium and system
optimal models. The proposed algorithm integrates the time and/or cost (of the trip) constraint into a single performance measure. The algorithm was validated with historical and real-time information about travel conditions in a stochastic and time dependent modeling approach.
5. Developing a traffic state prediction model to better capture the stochastic behavior of
5
traffic condition indicator to predict congestion level. The results were used to estimate the transition probabilities of Markov Chain model.
6. Applying the proposed methodology to several real-world transportation networks to
identify the benefits of developed a routing algorithm. The studied transit network was chosen to investigate the application of the proposed method in on-demand transit re-routing for transportation agencies (e.g. bus line alignment changes with the network traffic). In addition, multimodal networks were built to study travelers’ optimized routing in transit networks in case of congestion or unforeseen delays.
The main thesis contributions are as follows:
This thesis presents a new approach in developing an ITS methodology by combining available services and providing an integrated public and roadway traffic application. Previous route optimization studies consider passenger vehicles as the only transportation mode in their routing algorithm. In this research, a methodology is developed to use Markov process in route optimization algorithm for a multi-modal transportation network. The proposed approach applies probabilistic based methods to better estimate the parameters related to the stochastic nature of traffic parameters in a transportation network.
The proposed route optimization model can benefit various stakeholders, particularly transit operators and users, local transit agencies that provide feeder bus services to regional bus passengers to commute within the suburban communities, government agencies and industries related to the ITS. This methodology can be integrated into end-user products that would be beneficial for both travelers and transportation service providers.
6
For example, transit users would be able to modify their plans and choose other modes of transportation if the current mode experiences delays due to traffic conditions. In regards to transit operators, the proposed method enables them to share information on several transit services and stops/stations and reduce passengers’ wait time and/or transit delay costs, assist planners in revising transit schedules periodically and provide real-time routing guidance to bus drivers.
1.4 Thesis Organization
Chapter 2 presents a literature review on the existing methods adopted by authorities and researched by academics for route optimization in transportation networks. The different approaches are discussed and investigated. Limitations and gaps in each approach are presented. Chapter 3 includes the development of the proposed methodology. It starts by developing the optimization methodology based on Markov Decision Process, followed by the traffic state prediction methodology. In addition, it includes a flowchart explaining the implementation of the proposed methodology. An example is presented to demonstrate the application of the proposed methodology in a small network. The chapter concludes with a discussion on improving the state transition probabilities used within a network. Chapter 4 presents three case studies developed to validate and implement the proposed methodology and prove its application in transportation networks. It also includes the data collection stage, which is an integral part of the research and model development. Finally, Chapter 5 summarizes the research and presents the thesis contributions and identifies future work directions.
7
CHAPTER 2.
LITERATURE REVIEW
Given that traffic conditions on real-world transportation networks show stochastic and time dependent properties (e.g. occurrence and duration of non-recurrent congested conditions, fluctuations in demand for transit usage, etc.) transportation operators and passengers can benefit from deployment of ITS applications such as Advanced Traveler Information System (ATIS) and Advanced Public Transit Systems (APTS). By providing travelers with updated travel time/route information, they will be able to make more informed route choice decisions, mainly to minimize travel delay. ITS deployments provide benefits to the public transportation operators. By incorporating adequate online information, transit authorities will be able to adjust the operations of their fleet to respond more efficiently to various conditions hindering normal operation and, consequently, minimize the negative effects on passengers’ travel time. An overview of recent studies on the vehicle routing is performed and categorized as described here after.
2.1 Passenger Vehicle Routing
In recent years, many studies investigated different network assignment and vehicle routing
algorithms and related ATIS applications.ATIS is intended to improve traveler decision making
by collecting, processing and disseminating information that helps travelers decide when to travel, the mode to choose and the route to take. For example, Huang and Li (2007) presented a traffic equilibrium model to evaluate the effect of ATIS as a travel information service on travel behavior. Their multi-criteria, logit-based model used a trade-off between travel time and travel cost to make route choices based on the value of time for different users. The authors assumed that all users select the routes with minimum perceived travel disutility, which
8
is a linear bi-criteria combination of travel time and monetary travel cost. Two types of users were studied: equipped and non-equipped with ATIS. The authors found that their model had a better estimation of network benefits of ATIS compared to other single-criterion models (i.e. travel time-based or travel cost-based single-criterion models).
Other studies had investigated travel time prediction under ATIS. For example, Abdalla and Abdel-Aty (2006) studied the benefits of ATIS in route choice at microscopic level. The authors used a mixed linear modeling approach to study travel time under ATIS. They used a real world network with 40 links and 25 nodes, and vehicle flows in a travel simulator, where a traveler drives in a simulated environment, to generate dynamic route choice data. Travelers were provided with one of five different levels of information and/or advice, including no information, pre-trip/on-route information with/without advice. The authors analyzed travel time of total of 630 trial trips completed by the 63 travelers. The authors’ study focused only on drivers using passenger cars and concluded that by increasing the level of information (i.e. adding on-route knowledge to pre-trip information) the average travel time decreased.
Bingfeng et al. (2008) presented a bi-level programming model to determine the optimal system performance of traffic network within an ATIS environment. In their model traffic authority is the decision maker in the upper-level problem, and drivers - with or without ATIS, are the decision makers in the lower-level problem. They used a numerical example to demonstrate the application of model and investigated the traffic behaviors under three cases of the ATIS environment: (i) ATIS provides drivers with parking and route information, (ii) ATIS provides drivers with route information only, and (iii) ATIS provides drivers with parking
9
information only. Their findings showed that ATIS with parking information would be most effective when parking demand is reaching capacity, and the roads are not congested.
Yang and Luk (2008) studied the impact of ATIS on the performance of road network. The authors used traffic simulation module to represent the traffic and calculate network delay as the main performance measure. They considered four categories of drivers, based on the level of access to traffic information. The route choice model proposed by the authors categorized drivers into four groups, drivers with i) no traffic information; ii) pre-trip information; iii) real-time traffic information; and iv) displaying messages using variable message sign, respectively. The method was applied to a case study in Singapore consists of express ways and arterials. The authors also conducted an analysis of different percentage of market penetration (i.e. percentage of travelers that have access to driving information system). Their results showed that providing traffic information to drivers can reduce the total network delay by 7.5%. In addition, they found the optimal level of market penetration for each demand, which would result in the performance of a real-time information system to be better than or equal to that of the pre-trip system. Their results were mainly based on simulation and were not validated with real world data.
Another category of studies are those that evaluated different route choice techniques. The reviewed literature shows that most discrete choice models for route choice analysis are based on static and deterministic networks. Examples of such models are Path Size Logit (Ben-Akiva and Ramming, 1998; Ben-Akiva and Bierlaire, 1999) and C-Logit (Cascetta et al., 1996). These models are non-adaptive path choice models because travelers are not allowed to adjust their
10
route choices on-route in response to the revealed traffic conditions. Several studies of path choice models with real-time information, both pre-trip and on-route, and a recent related literature review can be found in Abdel-Aty and Abdalla (2006).
Some models investigate drivers’ behavior to predict the decision to switch from a previously chosen or experienced route and others are route choice models with explicit choice sets of paths. For example, Srinivasan and Mahmassani (2003) studied the effect of observed heterogeneity due to age and gender effects in user decisions under real-time information. Abdel-Aty and Abdalla (2004) investigated drivers’ diversion from their normal routes under different scenarios of providing traffic information (i.e. no information, pre-trip information without and with advice, and on-route information without and with advice). Their study network was located in the area around the University of Central Florida and included 25 nodes and 40 links. In total 630 trial trips by 63 drivers were studied. Their results showed that the travel time of the normal and diverted routes are significant in encouraging drivers to divert from normal routes. Also it was shown that expressway users may divert from the expressway if they are guided to a route with a temporarily less travel time. Bogers et al. (2005) investigated learning, risk attitude under uncertainty, habit and the impacts of advanced travel information service on route choice behavior. The authors developed a conceptual framework to integrate these aspects and used the interactive travel simulator of Delft University of Technology (TSL) to investigate route choice among a given number of paths for travelers. They concluded that people perform best under the most elaborate information scenario and that habit with on-route information plays a major role in on-route choice behaviors.
11
Ukkusuri and Patil (2007) developed a methodology for traffic assignment by accounting for travelers’ recourse actions (opportunity for the traveler to evaluate his or her remaining path when en-route information is available). They applied a methodology based on Logit model and Hyperpaths (i.e. subset of links connecting adjacent nodes with different probabilities). The authors’ methodology includes a utility function based on minimizing the total cost of traveling between the origin and destination nodes. In their model the link cost is a function of traffic flow and has to be recalculated for all the links in each iteration. An iterative stochastic user equilibrium approach is utilized to find the most efficient Hyperpath (minimum cost). The authors applied the proposed method to a test network and achieved convergence in less than 100 iterations. They concluded that the methodology could be efficiently adopted for stochastic user equilibrium with recourse.
Some studies proposed various algorithms to solve different routing policy problems. For example, Gao and Chabini (2006) studied the optimal routing policy (ORP) problem in stochastic networks. The authors reviewed different variations of optimal routing policy problem in the literature. They implemented an ORP algorithm that accounts for stochastic dependency among link travel times and they investigated the role of information in routing decision making. Gao et al. (2008) presented a route choice model to capture travelers’ behavior when adapting to the provided traffic conditions en-route, in a stochastic network. The authors proposed a routing policy to represent drivers’ adaptive behavior. Their routing policy is defined as a decision rule that maps all possible traffic conditions to the next links at a decision node (e.g. Choosing the route between the two traveling points with minimum travel delay). A variable message sign was used to provide information about congestion status on the network links.
12
Their findings showed that between the routing policy model and the non-adaptive path model, where traveler cannot change their path while on-route, there is a significant difference in terms of expected travel time, when the network is more unpredictable (i.e. the probability of an incident is in the medium range).
Nikolova and Karger (2008) presented an optimal solution approach to find an optimal policy that minimized the expected cost of travel for the Canadian Traveler problem. The Canadian traveler problem is a stochastic shortest path problem in which travelers learn the cost of a link only when they arrive at its connecting junction. The authors applied a mix of techniques from algorithm analysis and the theory of Markov Decision Processes to develop algorithms for directed acyclic graphs. The proposed solution was not validated for other types of graphs.
Other studies investigated in-vehicle routing solutions by using real-time information. For example, Du et al. (2013) proposed a coordinated online in-vehicle routing mechanism for smart vehicles with real-time information exchange and portable computation capabilities. This study considered that at a given short time period, there was a group of smart vehicles which need to make route choice decisions among a number of candidate routes, according to the latest real-time traffic information. The authors proposed a coordinated online in-vehicle routing mechanism and modeled it as a mixed strategy routing game, in which the process that smart vehicles decided their own route choice priorities was treated as a negotiation and coordination process among other smart vehicles. In a routing coordination group, each smart vehicle was seeking to find the best online route choice priority, which leads to the probabilities of choosing the candidate paths with minimum expected travel time. The coordinated vehicles
13
iteratively updated and proposed their routing choice priority in responding to their evaluation of near future traffic condition based on shared online traffic information. The negotiation process repeated several iterations until all travelers accepted and would not change their route choice priorities (i.e. an equilibrium route choice priority decision). The transportation network is represented by a directed graph. At each iteration individual vehicle predicted the expected traffic flow based on the latest traffic flow information and other vehicles’ route choice proposals. When new traffic condition becomes available, each smart vehicle computes its new targeting route choice priority through a multinomial logit choice model. The utility function of the model was expected travel time on each path during current iteration. The process of updating traffic condition and proposing new route choice process was repeated until the targeted route distribution was the same as the current route choice priority for all the vehicles (equilibrium routing decision). Authors conducted numerical experiments to demonstrate the performance of their proposed routing mechanism by modeling a sample network of Sioux Falls City. The results showed that by increasing the percentage of smart vehicles, the ratio of average travel times between the proposed and traditional methods became smaller, which indicated shorter travel times under the coordinated routing method. In addition, the authors showed that their method outperformed the traditional routing method, in which each smart vehicle decides its route choice priority independently without coordination.
In another recent study Xiao and Lo (2014) proposed an in-vehicle navigation algorithm based on adaptive control. The proposed algorithm incorporates historical traffic information to minimize the expected on-route travel time. The transportation network is divided into a finite
14
number of nodes or decision points (e.g. intersection) and links (e.g. arterials). The authors assumed a different traffic state at each node and formulated the travel time between two nodes as a function of estimated travel time on the link between two nodes and the uncertainty between actual and estimated travel time. The traffic states were defined as factors that will influence the uncertainty of travel time (e.g. traffic signal) and the travel time was calculated by applying the traffic state vector and the probability of occurrence of each traffic state to the estimated travel times. Ultimately, a cumulative expected travel time from origin to destination was defined and minimized to identify the optimal routing policy. The proposed optimization did not produce a predetermined route for the vehicle. Instead, the next direction to be taken was a function of the arrival state at a node. Therefore, the decision rule was adaptive to the most recent traffic states encountered. The author then compared their methodology with a deterministic algorithm that calculated an instantaneous shortest path and showed that the adaptive routing policy outperformed the instantaneous shortest path algorithm through an example network. Their results showed that, for most of the links, the average path travel times of the proposed routing policy were between 1% and 7% shorter than those of the time-dependent instantaneous shortest paths, particularly when the traffic volume was high. The main limitation of this study is the assumption of conditioning factors that influence traffic state and the variability in travel time. These factors need to be calibrated based on historical data or through several scenarios within simulation models. A more realistic approach to estimate the probability of traffic states should be used. In addition, the authors only considered one single mode (private cars) in their methodology.
15
The above studies reveal different vehicle routing optimization methods in ATIS. However, they only consider a single transportation mode (i.e. passenger vehicles) in their routing algorithm, while many commuters of large urban agglomerations often times used a combination of at least two transportation modes. This research work includes both private and transit modes in optimal travel route calculations. This approach would enable both travelers and transit agencies to benefit a multi-modal route optimization.
2.2 Transit Routing
There are a few studies about dynamic routing in transit networks. Jeremy and Mathew (2011) developed an optimization method for bus transit system design using intelligent agent architecture, which allows for more efficient evaluation of trade-offs between passenger cost and operator cost. The authors applied their method to transit networks in Switzerland and India, which were previously investigated. According to the authors, for both networks the agent optimization system improved on the best of the previous solutions, both in terms of operator cost and passenger utility. Wang et al. (2009) presented a simulation-based optimization method for campus bus routing. The objective of their study was to find the minimum-cost route, while minimizing each passenger’s inconvenience by satisfying their request (fewer complains). The authors used numerical experiments to validate their proposed simulation model. The method was applied to a High-Tech zone in Dalian city in China. The authors conducted a numerical experiment based on the real data from a university campus bus service to evaluate the validity of their proposed model. Their new vehicle routing methodology was tested to divert a bus away from its fixed route in response to a new
16
customer request and was found to be beneficial to high-tech zone campus bus managers by reducing their costs.
Fu and Lam (2014) presented an activity-based network equilibrium model for scheduling daily activity travel patterns in transit networks under uncertainty. The authors uses supernetwork to simultaneously consider individuals’ activity and travel choices (i.e. time and space coordination, activity location, activity sequence and duration, and route/mode choices). They assumed the activity utilities to be time-dependent and stochastic in relation to the activity types and modeled activities with different durations or different start times as different activity links. The authors proposed a route searching algorithm based on method of successive average to solve for equilibrium. The objective was to maximize a daily activity utility function by considering value of time and link travel costs. The studied network consisted of one subway line and two bus lines. The results of their study showed that individuals’ travel choices were affected by travel dis-utilities of different transit lines. For example, when the network was not congested (i.e. low population), the dis-utilities of different transit lines were all quite small and therefore, the percentages of people choosing different lines are almost equal. As the population increased, they found a significant difference between the demands for two bus lines until the network became extremely congested where the individuals had little preference towards two bus lines. This network only included transit (not road network). The authors used a very small network to apply their proposed methodology and their results were not calibrated with real data. Moreover, the effect of road congestion and variations in travel times was not considered in the analysis.
17
Crainic et al. (2008) used a demand adaptive model to capture the behavior of transit systems with mandatory and optional stops (i.e stops requested by passengers and that may lead to changes in the default bus route). The authors suggested that a master schedule has to be developed based on time windows associated with mandatory stops. The authors employed a particular sampling technique to solve a master schedule problem for a single bus line. The efficiency of the proposed methodology was tested using various lengths and scenarios of the hypothetical transit line.
In a different study, Panou (2012) investigated the optimization of public transport (PT) information services that are provided on mobile devices, for travelers of PT means, through their personalization. The author proposed an algorithm along with the necessary parameters (dynamic and semi-dynamic) that supported a holistic personalization, based on each user specific profile and the history of their previous selections. The dynamic parameters were calculated automatically by the system and included: Walking distance, preferred transit mode, Number of changes between transport modes, distance and cost of each route. Semi-dynamic parameter was chosen each time the traveler used the application and included the reason for travelling (Tourist, Commuter, Recreational or Emergency). During the learning process of user preferences, the selected parameters were monitored and the corresponding values were stored based on the selected route, each time the user makes use of the system. The history of user preferences was used for future route recommendations. The author tested the proposed model with 10 users and evaluated its performance by providing users with a questionnaire and asking for their feedback. By using an average scoring value for the questions, the author concluded that the users had a positive opinion for the application of personalized routes
18
provided. This study showed the possibility of providing beneficial information about travelers routes/modes via mobile tools. However, only the scheduled travel time of transit modes are used for analysis.
Lin and Bertini (2004) proposed a Markov chain model for bus arrival time prediction that captures the behavior of bus operators in putting delayed or ahead of schedule buses back on their predefined schedule. They used a link-node representation of the bus network. The proposed methodology is demonstrated for a hypothetical case of equally spaced bus stops and a possible solution for more realistic bus lines is discussed. They suggested using three performance measures to evaluate the effectiveness of their prediction algorithm: overall performance (minimum total prediction error), robustness (minimize the occurrence of large deviations) and Stability (prediction of travel time does not fluctuate from time to time). The transition probability in the proposed model represented the conditional probability of a bus being delayed at downstream stop, given the delay at current stop. The authors suggested integrating the proposed model to a bus arrival prediction algorithm. There are several limitation in this study. The authors assumed that bus tops are uniformly spaced. The effectiveness of this algorithm was not tested with actual data from transit operators. Moreover, the authors did not use real data to calibrate their transition probability matrix.
In another study, Wong (2009) developed a dynamic mathematical model to estimate regional bus journey time using Artificial Neural Networks (ANN). The model updates bus arrival time using real-time Global Positioning System (GPS) information and also real-time highway loop detector data of volume, speed and occupancy. The ANN model was used for predicting arrival
19
time of one bus route within Toronto and was compared to two other forecasting methods, historical average and linear regression, and outperformed them by an average of 35 and 26 seconds in travel time calculations respectively. The author reports overestimation of arrival time in their model, which could result in passengers missing the bus. This study only predicts the bus travel time travelling mainly along EB direction of Gardiner Expressway in Toronto and does not consider other bus lines travelling on parallel arterials. Also, due to limited available data, the time period used in this covers only morning period: 5:30 till noon and does not consider Toronto’s rush hour traffic during PM peak.
Polyviou (2011) proposed a simulation-based model capable of modeling the details of bus and traffic incidents (SIBUFEM) in order to assess the impact of incidents on overall bus performance and suggest potential fleet management strategies for improved efficiency. The author considered three key performance measures to evaluate the effect of incidents: (i) average bus journey time, (ii) average bus speed and (iii) average excess waiting time. The author used data from the Portswood corridor bus route in Southampton, UK to calibrate and test the model. The results showed that the higher the severity (capacity reduction) of a traffic incident, the higher is the expected impact of the event on the overall bus performance. Their finding showed that 25% and 40% reduction of capacity caused 0.25 and 0.54 minutes average increase in travel time respectively. Also, the author concluded that a longer duration of a traffic incident causes more severe effects on the overall bus performance: i.e. similar incidents lasting for 20, 40 or 60 minutes, caused 0.1%, 1.3% and 2.8% increase in the average bus travel time. The authors suggested that the travel time results of SIBUFEM could be used for further evaluation of the impact of the incidents on bus patronage (ridership) levels. This study
20
quantifies the expected delay for one bus line during limited number of scenarios however, it does not provide any re-routing solution via alternative route. Moreover, There are other limitations in the simulation model: the computer model was not calibrated for vehicular traffic and the traffic signals were not coded and their effect was replaced by an additional delay. In addition, the severity of incidents is coded as a reduction in the road capacity, while a microsimulation model that simulates different lane closures and interactions between vehicles trying to change lane, could provide better and more realistic results.
Wang and Cheng (2012) proposed an allocation method for increasing the Public Transit (PT) level of service in an urban network. Their proposed method is based on Hub-Spoke structure that integrates PT lines with transfer hubs. Their approach focused on planning bus rapid transport (BRT) and regular bus lines. The authors did not include other transit modes (e.g. subway) nor transfer hubs (i.e. terminals or transfer stations) in the optimization process. They used an objective function for BRT line to maximize the operating efficiency (ratio of passenger
person kilometers to total kilometers traveled by all buses over a day) within the network.
Similarly, for bus lines, their objective function was to maximize the density of nonstop passenger volume (the ratio of the nonstop passenger volume of the bus line divided by the length, i.e. distance, of the bus line). Nonstop passenger was referred to a traveler who would not get off the bus until the final stop. They applied the proposed method to a PT network with 16 Traffic Analysis Zone (TAZ) in the City of Fuzhou in China. Operating efficiencies of feasible bus lines between two transfer hubs were calculated and the path with maximum efficiency was selected as the optimal BRT/bus line for that path. The authors proposed their methodology could be used in PT line planning. This study has some limitations. The solution
21
method and the constraints used for the analysis need validation. Any modification to the network size has a large effect on the solution time.
Other studies have addressed public transit schedule reliability and system efficiency issues. For example, Teklu et al. (2007) evaluated the transit assignment of systems characterized by small capacity buses (12-20 passengers) and stochastic headways (no timetables). Particularly, the authors proposed a composite frequency-based and schedule-based Markov process model for capacity constraint transit networks. Their model included bus and passengers’ simulator and a random utility model for transit route choice. Their approach assumed passengers’ routes were defined by a sequence of transfer stops connected by alternative route-sections to represent the attractive lines passengers could choose to travel on. Their generalized cost function consisted of in-vehicle travel cost, waiting cost and transit fares. A multinomial Probit route choice model that considers the cost correlations between alternative routes was used to model passengers route choice. The authors applied their model to a small network with 4 bus stops and 2 bus lines. Their results showed that passengers on relatively congested sections of the network experienced higher cost variability, due to the additional stochasticity associated with finding spare seats in the buses. The authors concluded that their model could be applied for network where transit vehicles are small and not operating to timetables to represent the variability in flows and costs and enable planners make more informed decisions.
The above literature shows applications of route choice models in evaluation of performance and schedule reliability and estimation of arrival time in public transit network. These studies mainly consider one transit mode models which can be further developed by including other
22
transportation modes (i.e. private and other public transit modes). By including several transit modes, travelers would be able to modify their plans and choose other modes of transportation if their current mode experiences delays due to traffic conditions. Moreover, commuters using their own vehicles could have a better planning for their trips if the option of switching between car and transit is available to them.
2.3 Multimodal Transportation Network Models
Multimodal transportation involves the usage of at least two modes of transportation to complete a single trip. Common modes of urban transport today mainly include car, bus, rail, motorcycle, bicycle and walking. Multimodal networks inherently offer redundancy and flexibility by offering multiple choices and routes, while mitigating the negative effects of traffic congestion. On the other hand, transfers between different modes carry a certain overhead in terms of waiting time and convenience and sometimes are a key factor in the decision of making a specific multimodal trip. Modeling multimodal transport requires identifying the availability of various transportation modes at specific locations and the ability and reliability of transfers between these different modes.
A limited number of studies attempted to model multimodal transportation networks that include both private and public transportation vehicles. Nagurney and Smith (2003) proposed to represent this type of networks as a supernetwork. Supernetwork framework allows one to formalize the alternatives available to decision-makers, to model their individual behavior and to compute the flows on the supernetwork, which may consist of travelers between origins and destinations as well as the associated costs. The supernetwork has the advantage that it can
23
model simultaneously multiple physical networks while accounting simultaneously for different trip features (e.g. route choice, transfer/waiting time, cost of transfers, etc.). The authors presented an overview of development and application of the supernetwork concept in transportation and decision-making concepts. The authors did not provide any specific case study or real world example of such modeling approach.
Zhang et al. (2011) presented a generic multimodal transportation network model for ATIS application to be used for large-scale transportation systems. The authors proposed using a supernetwork framework that integrates individual networks representing different transportation modes. Their model included dynamic travel times and timetable of public transportation services. The authors used the basic Dijkstra algorithm for routing purposes and they used the travel time as the performance measure for best route choice. Their results indicated that the model could be used to find optimal routes in short computation time for realistic networks. The main limitation of their model was long computation time to read and compile the integrated network, which depending on the size of network may take several hours.
Casey et al. (2013) presented an analysis of the computational performance of two shortest path algorithms for a multimodal multiobjective trip planner tool. The authors used Graph theory to create the road and public transport networks where a set of nodes and links that connect neighboring nodes together. They compared the performance of two shortest path algorithms: simple Dijkstra and A* heuristic, which improves upon Dijkstra’s algorithm. Dijkstra’s algorithm only considers the cost to travel from the origin node to the candidate
24
nodes and sorts candidate nodes in the order of their cost from the origin node. However, the A* heuristic method estimates of the cost to travel from the candidate node to the destination node, plus the calculated cost from the origin node to the candidate node, and orders the nodes based on total origin-destination cost. They applied the proposed methodology to an area of suburbs (as origins) and major destinations (e.g. CBD and airport) in the South East Queensland region in Australia. A set of constraints were set for the analysis which included: maximum number of transfers and maximum walking/transfer distance. The travel time value was used as the performance measure. The authors concluded for road only network, A* outperformed Dijkstra’s algorithm while for public transport and/or multimodal networks, using Dijkstra as the shortest-path algorithm produces adequate results, with the average search completing within 5-10 seconds compared to minimum 15 seconds in the A* method. This study did not include any real time information and cannot be implemented in time dependent networks.
Meng et al. (2014) presented a dynamic traffic assignment model for urban multi-modal transportation network by constructing a mesoscopic simulation model. The authors used MesoTS simulation laboratory previously developed by Yang (1997). The proposed model updates the path travel time at the beginning of each iterative phase, finds the shortest path with the k-shortest path algorithm, and finally assigns the traffic flow based on a C-Logit model. Travel utility function was used to calculate the updated link travel times at the beginning of each iteration. The k-shortest path algorithm is an extension of the typical Dijkstra algorithm with the possibility to calculate a set of shortest travel time paths, and determine the distinct set of the shortest path numbers according to different criteria. The authors applied their
25
proposed model to an area in the Chaoyang district in Beijing. The network consists of 5 subway lines with 39 stations, 18 bus lines with 51 stations and 188 road links with 122 nodes. The authors conducted several experiments to study the effect of different factors (e.g. increase in demand, parking fees and car ownership) on the percentage of car and transit (bus/subway) travel trips. In one of the conducted experiments, they examined the effect of traffic information on the travel mode choice. The results showed that when the car transfer information was not provided, (drivers had no opportunity to transfer to other modes) the private car trip increased from 61.5% to 86.5%. Similarly, when the transit transfer information was not provided, the one transit line trip increased from 3.9% to 6.2% (lower number of mode changes due to lack of transfer information). In both cases the average travel time increased by 1-2%. Finally, when no transfer information was provided, most of the travelers chose the private car trip, and the average travel time increased as the traffic congestion aggravates. Authors reported slow computation process for the time-dependent shortest path algorithm. In addition, this methodology does not account for real-time traffic information and changes in traffic conditions.
Arentze and Timmermans (2004) developed a network representation of multimodal transportation systems that allows the modeling of multi-activity, multimode routes by means of a standard least-cost path finding method. A case study was tested along the Almere– Amsterdam corridor in the Netherlands. The purpose of their study was to assess the sensitivity of activity-travel choice behavior on the travel time and cost from Almere to Amesterdam. The authors implemented a two-activity program (working and shopping) under various specifications of cost functions (e.g. value of time, transit tickets, parking fees and
26
penalty for inconvenience of transferring to another mode). Their results showed that key choices such as main mode, access station, activity location and making an intermediate trip home were strongly interrelated and fairly sensitive to prices, search times, activity–location preferences and the activity program. The authors found that a secondary activity during the trip might work in favor of transit use because of extra costs generated for cars related to parking. Their model identifies least cost path based on several assumed parameters that need to be calibrated with real data. The proposed methodology does not account for changes in travel speed/link cost during the trip.
Abdalla and Abdel-Aty (2006) studied travelers’ mode/route choice behavior under different levels of Advanced Traveler Information System (ATIS). ATIS is a group of services that provide travelers with information that will facilitate their decisions concerning route choice, departure time, trip delay or elimination, and mode of transportation. The authors recruited 65 subjects and instructed them about the experiment, they combined a travel simulator with real network and traffic data in order to model five mode/route choices under ATIS: i) travelers’ mode choice (Car vs. bus); ii) drivers’ diversion from the normal route; iii) drivers’ compliance with pre-trip advised route; iv) driver’s compliance with on-route short-term traffic information choice; and v) drivers’ long-term route choices. The authors showed that travel time and familiarity with devices that provide the information are the factors that have significant effects on drivers’ behavior. They also found that qualitative information (e.g. showing congestion level by using different colors) is more beneficial than quantitative information (e.g. travel time of roads) to drivers in assisting their on-route short-term choices. In addition, a high number of traffic signals on a route increased the probability of diversion. The authors suggested that their
27
findings could be used to enhance ATIS devices and incorporated in dynamic network assignment models.
Arentze (2013) proposed a Bayesian method to incorporate the learning of users’ personal travel preferences in a multimodal routing system. The proposed method learns the preference profile of a user (as parameters of link costs functions) incrementally from observations of preferred travel options (routes) in choice situations. The author applied multinomial-logit framework to model the choice behavior as a function of preference parameters/route attributes (e.g. travel time, walking time, travel/parking cost). The data were obtained from a travel choice experiment where 438 individuals were presented travel alternatives and indicated their choice for a trip of approximately 20km. The choice alternatives presented to individuals consisted of using car for the entire trip, using public transport for the entire trip and using a combination of public transport and car. The application of logit model for route choice evaluation in a multi-modal transportation network in this study is based on predefined link travel time/costs.
Khani et al (2012) proposed an algorithm to find the optimal path in an intermodal urban transportation network with multiple modes (auto, bus, rail, walk, etc.). Their proposed method found the optimal path according to the generalized cost, including private-side (travelers), public-side (transit agencies) and transfer related travel costs. The authors applied a trip-based transit shortest path algorithm and a label-correcting algorithm using park-and-ride facilities to find the best transfer location (i.e., park-and-ride) from the origin, considering the cost for the transit part of the trip. Optimal path was chosen based on the time-dependent shortest path
28
algorithm for cars and transit and mode change links (access and egress links between nodes in the auto network/transit stops). To reduce the number of iterations/complexity of transit network, the authors only considered transfer stops as the eligible alighting nodes to be scanned during the process. The results of their study showed that applying the proposed shortest path algorithm to both car and transit routes could improve the computational performance by 75%. Nassir et al. (2012) applied the proposed algorithm by Khani et al (2012) to find the intermodal optimal tour (origin to origin) in time-dependent transportation networks for a traveler with a sequence of destinations to visit. The authors proposed a methodology to identify the best combination of modes and park-and-ride (transfer) locations to allow traveler visiting a sequence of destinations, as well as the optimal path for each segment of trip. Their proposed mathematical approach minimizes objective function with the following decision variables: i) availability of link from the current node to adjacent node that serves destination, ii) waiting time before departure, and iii) time of arrival to current node. Authors applied the proposed method to the Rancho Cordova bimodal network in Sacramento with 447 nodes, 850 links in the auto network, 163 bus stops, 6 bus routes and Two park-and-ride facilities that connect the auto network to the transit network. The optimal path found for selected origin and destination was 62 min long and uses auto-only mode, vs 71 and 78 minutes for the two alternative routes that used one of the two available park-and-ride nodes. The above studies improved the computational time for evaluating optimal route, with minimum travel time, in multimodal network, however, they did not consider the stochastic attribute of traffic flow (variable traffic condition/travel time).
29
The above literature review reveals a limited number of studies on route optimization in multi-modal transportation networks. Among them, mainly a simple Dijkstra Shortest Path (DSP) algorithm or a routing policy based on DSP was used to identify optimal routing, while optimization constraints are very basic. The optimization used in these studies mainly included the shortest distance or travel time based on a constant speed/traffic condition.
Due to the stochastic nature of traffic congestion and travel time/delay parameters in a transportation network, several authors proposed probabilistic modeling of different ATIS applications (e.g. estimation of expected freeway travel time, bus arrival time prediction, transit network assignment). The next section provides an overview of different route choice models used in transportation followed by a brief explanation of one of the frequently used probabilistic method, i.e. Markov Chain.
2.4 Route Choice Models for Transportation Networks
In this section an overview of the models used to generate routes for navigation within transportation network are presented. Traditionally traffic assignment models assumed very simple route choice that assumed drivers behave as if they have perfect knowledge of route cost/travel time. The most common route optimization method is the shortest path algorithm, such as the Dijkstra algorithm (Dijkstra 1959). Dijkstra's original variant found the shortest path between two nodes but a more common variant fixed a single node as the source node and finds shortest paths from the source to all other nodes in the graph, producing a shortest path tree. Attempts to improve the computational speed of the Dijkstra algorithm were reviewed by Wagner and Willhalm (2007) which can be broadly classified into two classical techniques, i.e.,
30
the bidirectional search and the goal-directed search, which is more commonly known as the A* algorithm proposed by Hart et al. (1968). Basically, these algorithms maintain two node lists, i.e., an open list from which a potential successor node is selected and a closed list of nodes that have been already selected.
The assumption of perfect knowledge of travel cost for drivers had been long considered inadequate for travel behavior. Consequently, probabilistic route choice models were developed in which drivers were assumed to minimize their perceived costs given a set of routes. An important extension of the simple shortest path approach is the generation of alternative paths, such as the k-shortest path approach by Eppstein (1999). The k-shortest paths algorithm lists the k paths connecting a given source-destination pair with minimum total length. Bell (2009) modified the classical A* shortest path algorithm to generate a set of attractive paths, which are called hyperpaths with a min-max exposure to delay strategy, leading to a link use probability inversely proportional to maximum link delay for attractive links leaving a given node. The advantage of hyperpaths is that multi-paths can be generated to accommodate drivers’ preferences.
Several route choice models in the context of Stochastic User Equilibrium (SUE) were also developed. The ‘stochastic’ term is related to the probabilistic route choice model, instead of simply assuming the shortest path as in the deterministic user equilibrium model. SUE route choice models are generally derived from utility theory. The utility function cannot be measured directly. Therefore, to take into account the effects of unobserved attributes and characteristics, the utility of an individual is assumed to have a deterministic (or observable)