University of Massachusetts Amherst University of Massachusetts Amherst
ScholarWorks@UMass Amherst
ScholarWorks@UMass Amherst
Doctoral Dissertations Dissertations and Theses
November 2016
Multi-Classifier Fusion Strategy for Activity and Intent Recognition
Multi-Classifier Fusion Strategy for Activity and Intent Recognition
of Torso Movements
of Torso Movements
Abhijit KadrolkarFollow this and additional works at: https://scholarworks.umass.edu/dissertations_2
Part of the Acoustics, Dynamics, and Controls Commons, Bioelectrical and Neuroengineering Commons, Biomechanical Engineering Commons, Biomechanics and Biotransport Commons, Electro-Mechanical Systems Commons, Kinesiotherapy Commons, Orthotics and Prosthetics Commons, Robotics Commons, and the Signal Processing Commons
Recommended Citation Recommended Citation
Kadrolkar, Abhijit, "Multi-Classifier Fusion Strategy for Activity and Intent Recognition of Torso Movements" (2016). Doctoral Dissertations. 773.
https://scholarworks.umass.edu/dissertations_2/773
This Open Access Dissertation is brought to you for free and open access by the Dissertations and Theses at ScholarWorks@UMass Amherst. It has been accepted for inclusion in Doctoral Dissertations by an authorized administrator of ScholarWorks@UMass Amherst. For more information, please contact
MULTI-CLASSIFIER FUSION STRATEGY FOR ACTIVITY AND INTENT RECOGNITION OF TORSO MOVEMENTS
A Dissertation Presented by
ABHIJIT KADROLKAR
Submitted to the Graduate School of the
University of Massachusetts Amherst in partial fulfillment of the requirements for the degree of
DOCTOR OF PHILOSOPHY September 2016
© Copyright by Abhijit Kadrolkar 2016 All Rights Reserved
MULTI-CLASSIFIER FUSION STRATEGY FOR ACTIVITY AND INTENT RECOGNITION OF TORSO MOVEMENTS
A Dissertation Presented by
ABHIJIT KADROLKAR
Approved as to style and content by:
_______________________________________ Frank C. Sup IV, Chair
_______________________________________ Yossi Chait, Member
_______________________________________ Kourosh Danai, Member
_______________________________________ Brian R. Umberger, Member
____________________________________ Sundar Krishnamurty, Department Head Department of Mechanical and Industrial Engineering
DEDICATION
v
ACKNOWLEDGMENTS
I would like to thank my advisor Prof. Frank Sup, for his insightful and patient, guidance, support and encouragement for all these years that I have been working with him. His depth of knowledge and ability to glean insights from very little information have been very helpful in me completing this dissertation. I would also like to extend my gratitude to the members of my dissertation committee, Prof. Yossi Chait, Prof. Kourosh Danai and Prof. Brian Umberger, for their invaluable advice and feedback.
All the data used in this dissertation was collected in the Biomechanics Lab, and I will be forever grateful to Prof. Brian Umberger and his colleagues at the Biomechanics Lab, for extending to me the use of his lab and equipment. Also, thanks to Dr. Ulvi Baspinar for being a steady and insightful collaborator.
Working at MRRL has been a very special time and I would like to extend my appreciation to all the members of MRRL who have made this journey fun, interesting and worthwhile. During the time I spent in the Amherst area, I have been fortunate to have formed a small number of very close friendships, and I would like to extend a heartfelt thank you to all my friends.
I would be remiss if I didn’t mention my gratitude to my parents, who have been unflinching in their love, support and encouragement. Throughout my time in grad school, my parents were a constant, unwavering source of encouragement. Their love and steadfast support has been immensely instrumental to the completion of this dissertation, and for this I am eternally grateful.
vi
ABSTRACT
MULTI-CLASSIFIER FUSION STRATEGY FOR ACTIVITY AND INTENT RECOGNITION OF TORSO MOVEMENTS
SEPTEMBER 2016 ABHIJIT KADROLKAR,
B.E., VISVESWARAYA TECHNOLOGICAL UNIVERSITY, INDIA M.S., UNIVERSITY OF MASSACHUSETTS AMHERST Ph.D., UNIVERSITY OF MASSACHUSETTS AMHERST
Directed by: Professor Frank C. Sup IV
As assistive, wearable robotic devices are being developed to physically assist their users, it has become crucial to develop safe, reliable methods to coordinate the device with the intentions and motions of the wearer. This dissertation investigates the recognition of user intent during flexion and extension of the human torso in the sagittal plane to be used for control of an assistive exoskeleton for the human torso. A multi-sensor intent recognition approach is developed that combines information from surface electromyogram (sEMG) signals from the user’s muscles and inertial sensors mounted on the user’s body. Intent recognition is implemented by following a pattern classification approach, wherein a linear discriminant analysis (LDA) based method of pattern classification is utilized. This method of classification builds on a traditional LDA by utilizing multiple classifiers from multiple sensors that are combined together using a majority voting based classifier fusion scheme, to deliver improved classification performance. Additionally, there is a focus on identification of suitable features for
vii
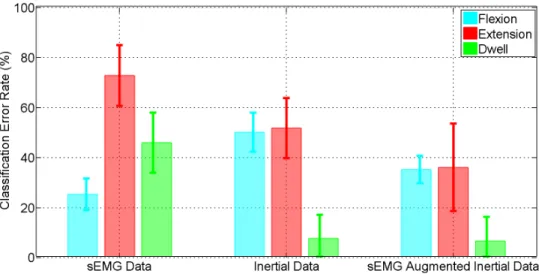
classification. Extraction of features in the time, frequency and time-frequency domains is discussed. Wavelet transform methods are employed for targeted extraction of nonlinear time-frequency domain features, and the effectiveness of these features in improving classification performance is emphasized. Experimental results using sEMG and inertial signals recorded from human subjects, to evaluate the pattern classification and feature extraction methods are presented. Results show that a combined sensor approach that utilizes both inertial and sEMG data leads to a 70% improvement in classification performance. Results also show that the use of multiple time-frequency domain features in conjunction with majority voting based classifier-fusion leads to an additional 75% improvement in classification performance, with a best case of up to 97% accuracy in recognizing user intent. This research has provided an effective demonstration of leveraging nonlinear time-frequency domain features with linear methods of classification to deliver accurate and computationally efficient intent recognition. In addition, the research effort has also developed a library of features that can serve as a starting point for future efforts in classifying torso motions.
viii TABLE OF CONTENTS Page ACKNOWLEDGMENTS ...v ABSTRACT ... vi LIST OF TABLES ...x LIST OF FIGURES ... xi CHAPTER 1: INTRODUCTION ...1 1.1 Motivation ...2 1.2 Review of Literature ...3
1.2.1 Actuation of Torso Motion ...3
1.2.2 Electromyography (EMG) ...3
1.2.3 Intent Recognition ...7
1.3 Scope and Summary of Research ...13
1.4 Organization ...14
2: INTENT RECOGNITION DATASET ...16
2.1 Experimental Design ...17
2.2 Experimental Protocol ...21
2.3 Pre-Processing...22
2.4 Data Segmentation ...22
3: MULTI-CLASSIFIER FUSION APPROACH ...24
3.1 Theoretical Background ...24
3.1.1 Pattern Classification for Intent Recognition ...24
3.1.2 Feature Extraction ...27
3.2 Methods...30
ix
3.2.2 Classification...33
3.2.3 Classifier Performance ...37
4: EVALUATION OF MULTI-CLASSIFIER FUSION APPROACH ...40
4.1 Time-Domain and Frequency Domain Features ...41
4.2 Time-Frequency Domain Features ...43
4.2.1 One-Classifier LDA, sEMG data ...44
4.2.2 Two-Classifier Majority voting combination ...48
4.2.3 Three-classifier Majority voting combination ...51
4.2.4 Three-classifier Weighted Classifier Combination ...53
4.3 Comparison with Nonlinear Classifiers ...56
4.3.1 Comparison of feature domains. ...58
4.3.2 Comparison of Classification Methods ...59
4.4 Chapter Summary ...63
5: CONCLUSION AND FUTURE DIRECTIONS ...65
APPENDICES A: PROTOCOL OF EXPERIMENTS ...69
B: TWO-CLASS CLASSIFICATION ...72
x
LIST OF TABLES
Table Page
2.1: Physical Characteristics of Study Participants. ...17
2.2: sEMG Electrode Mounting Locations. ...18
2.3: Experimental Protocol. ...22
3.1: List of Mother Wavelets and corresponding Feature Statistics. ...33
4.1: Classification Error Rates for Single Classifier. ...41
4.2: Classification Error Rates for Multiple Classifiers. ...42
4.3: Features and Weights for Weighted Classifier Combination. ...51
4.4: Comparison of Feature Domains. ...59
4.5: Comparison of Classification Methods, Subject #1...60
4.6: Comparison of Classification Methods, Subject #2...61
4.7: Comparison of Classification Methods, Subject #3...61
B.1: Two-class Classification; sEMG signals. ...74
B.2: Two-class Classification; Inertial signals. ...74
xi
LIST OF FIGURES
Figure Page
1.1: Structural organization of muscle [10]. ...4
1.2: Motor Unit: Motoneuron, motor axon, muscle fibers [10]. ...5
1.3: Photographs and schematic of WPAS [42]. ...8
1.4: Photographs of Power Assist Suit in use [36]...9
1.5: Intent recognition of arm movements using 4-channel sEMG [28]. ...10
1.6: Intent recognition for transfemoral prosthesis using sEMG and inertial sensors [4]. ...11
2.1: Electrode mounting sites. ...18
2.2: Channels 1-4 of sEMG data; 60s recording of flexion and extension motions. ...18
2.3: Channels 5-8 of sEMG data; 60s recording of flexion and extension motions. ...19
2.4: Channels 9-12 of sEMG data; 60s recording of flexion and extension motions. ...19
2.5: Optical Marker Placement for Emulating Inertial Sensors. ...21
3.1: Flow diagram illustrating methods employed in this analysis. ...31
3.2: Flowchart depicting multi-classifier strategy. ...34
3.3: Data segmentation for feature selection. ...37
3.4: Schematic diagram of 10-fold cross validation. ...39
4.1: Classification performance - single classifier; Time-domain and frequency-domain...42
4.2: Classification performance - multiple classifiers; time-domain and frequency-domain...43
4.3: Classification performance of individual sEMG features with 1-Classifier LDA; Subject #1. ...45
4.4: Classification performance of individual inertial features with 1-Classifier LDA; Subject #1. ...45
xii
4.5: Classification performance of individual sEMG features with 1-Classifier
LDA; Subject #2. ...46
4.6: Classification performance of individual inertial features with 1-Classifier LDA; Subject #2. ...46
4.7: Classification performance of individual sEMG features with 1-Classifier LDA; Subject #3. ...47
4.8: Classification performance of individual inertial features with 1-Classifier LDA; Subject #3. ...47
4.9: Classification performance of sEMG feature pairs with 2-Classifier LDA; Subject #1...49
4.10: Classification performance of sEMG feature pairs with 2-Classifier LDA; Subject #2...49
4.11: Classification performance of sEMG feature pairs with 2-Classifier LDA; Subject #3...50
4.12: Classification performance of 3-Classifier LDA – 2 sEMG + 1 Inertial features; Subject #1. ...52
4.13: Classification performance of 3-Classifier LDA – 2 sEMG + 1 Inertial features; Subject #2. ...52
4.14: Classification performance of 3-Classifier LDA – 2 sEMG + 1 Inertial features; Subject #3. ...53
4.15: Classification performance of weighted 3-Classifier LDA. ...54
4.16: Variation of classifier performance with speed of activity used for generating classifiers. ...55
4.17: Classification performance of weighted 3-classifier LDA on continuous activity stream. ...55
4.18: Effect of feature domain on classification performance for three subjects. ...59
4.19: Comparison of classification methods, Subject #1. ...60
4.20: Comparison of classification methods, Subject #2. ...62
4.21: Comparison of classification methods, Subject #3. ...62
B.1: Two-class classification performance of separate sEMG signals and inertial signals. ...73
xiii
B.2: Two-class classification performance of combined sEMG and inertial
1
CHAPTER 1
1. INTRODUCTION
Intent recognition, and recognition of activities and motions performed is an open research problem in the field of bio-robotics, wearable sensing, robotic prostheses and assistive devices [1]–[3]. In such applications, intent recognition is usually driven by physiological sensor measurements recorded from the user’s body [4], [5]. The problem of recognizing intent from physiological sensor data becomes problems of extraction, identification and classification of patterns occurring in the sensor data [6].
Machine learning based methods of pattern classification are among the most useful tools available for addressing such problems. The available methods of pattern classification can be broadly classified into linear and non-linear methods [7]. Linear methods are generally preferable owing to their inherent computational efficiency, ease of implementation, relative insusceptibility to overfitting, and reduced sensitivity to noise. However, the need to extract and classify complex spatial and temporal patterns from noisy, multidimensional time-series data obtained from physiological measurements cannot be easily satisfied by linear methods. On the other hand, non-linear methods, although powerful in extracting and classifying complex patterns have inherent issues related to computational complexity, susceptibility to overfitting, and sensitivity to noise [8].
This dissertation explores the combination of these two domains by utilizing non-linear features in conjunction with non-linear methods of classification, in order to obtain classification accuracy that is similar to that of non-linear methods, without being subject
2
to the negative aspects of non-linear classification. As part of this exploration this dissertation investigates methods of feature extraction suitable for representing complex spatial and temporal patterns in time-series data, and methods for combining these features with simple, linear methods of classification.
The abovementioned exploration is carried out by studying a representative problem of intent recognition of human torso movements. The study of intent recognition of torso movements finds applicability in assistive devices for the upper body, and is a currently nascent field of research.
1.1 Motivation
The study of an intent recognition system for torso movements is motivated in part by the need for a safe, efficient, and reliable control and interface system for a powered, assistive device for the back and upper body. The design of such a device was introduced by the author and colleagues in a previous publication, and research on realizing the device is ongoing [9]. The device is intended to provide strength augmentation and injury protection to healthy users, to help carry heavy loads. In addition, the device is also intended to have healthcare applications, such as restoring mobility and motion after stroke or spinal cord injury.
The emphasis on linear methods of classification is driven by the need for a computationally efficient real-time implementation of the method of intent recognition, and the drive to explore non-linear features is motivated by the need for achieving linear separability in the feature space so that linear methods of classification would be sufficiently effective.
3
1.2 Review of Literature
1.2.1 Actuation of Torso Motion
All human motion is the result of biomechanical interactions between muscles, the skeletal frame and the environment, with muscles being the primary actuators [10]. Muscular actuation of the torso is achieved by a combination of ‘local’ and ‘global’ muscles [10]. The global muscles perform gross motions like controlling the overall posture, and transferring loads from the thoracic cage to the spine and from the spine to the pelvis [10]–[12]. The global muscles include the erector spinae, the obliques and abdominal muscles [10], [13]. The local muscles control the stiffness and curvature of individual spine segments [12], [14], [15]. The prominent muscles that make up the set of local muscles are the interspinal, intertransverse and multifidus muscles [10], [13]. In addition to being part of a biomechanical system that causes motion, muscles are also part of an electrical system that comprises of the central nervous system (CNS) of the body. The electrical activity of this electrical system can be measured as a voltage. This voltage measurement is called an electromyogram, and provides a measure of the intent for locomotion [16].
1.2.2 Electromyography (EMG)
An electromyogram (EMG) is a recording of the electrical activity in a muscle. In the case of muscles that are attached to the skeleton and are primary actuators during locomotion, it contains information about the neural control of the underlying musculature. This is due to the fact that human intent for locomotion is communicated to the muscles through electrical transmissions generated by the central nervous system (CNS).
4
Transmissions from the CNS to muscles and other end effectors are carried by transient electrical impulses that begin in neurons and propagate towards their target cells at velocities between 0.3 m/s and 100 m/s [17]. Muscular actuation happens at the cellular level due to the relative motion between actin and myosin filaments. Repeating ordered arrangements of these filaments form a myofibril. A network of such myofibrils forms a muscle fiber, which is a multi-nucleated cell. These muscle fibers are bundled to form fascicles and bundles of these fascicles form a complete muscle. A graphical representation of this muscular organization is shown in Fig. 1.1.
Figure 1.1: Structural organization of muscle [10].
The muscle fiber is the structural unit of a muscle. A group of muscle fibers is controlled (innervated) by a single neuron, called a motoneuron. These muscle fibers are connected to the motoneuron via motor axons and this assembly of a motoneuron, the motor axon, and the muscle fibers innervated by that neuron is called a motor unit [10], [17]. A motor unit is the functional unit of a muscle and is the primary unit of control in
5
the neuromuscular system [16]. As can be seen in the motor unit in Fig. 1.2, multiple muscle fibers are innervated by a single motoneuron. Therefore, the firing of a single motoneuron results in multiple muscle fibers discharging almost simultaneously. The aggregate activity of all these muscle fibers results in the generation of a motor unit action potential, which can be recorded by EMG [13], [16].
Figure 1.2: Motor Unit: Motoneuron, motor axon, muscle fibers [10].
Movement and muscular force output is a result of the activation of motor units. The central nervous system responds to the requirement for additional force either by activating additional motor units or by increasing the frequency of activation of motor units. The motor units to be activated are selected (or recruited) in increasing order of size, with the smallest motor units being recruited first and larger motor units recruited according to force requirements. The choice of motor units and their rates and times of discharge are made by the central nervous system, based on the extant intention [17].
This motor unit activity recorded as an electrical signal in the form of an EMG recording, gives an aggregate of the electrical contributions made by active motor units
6
[18]. The EMG can be usually measured using conductive metal electrodes. Two primarily different types of electrodes (and concepts) exist to record EMG signals. These two types are surface electrodes and indwelling or needle electrodes [16]. Needle electrodes are inserted into the muscle through the skin, while surface electrodes are placed on the skin directly over the muscle. Motor unit activity recorded using surface electrodes is termed surface electromyogram (sEMG) and possesses distinct advantages over motor unit activity recorded from indwelling electrodes. The advantages of sEMG recordings include safety, ease of operation and most importantly a non-invasive method of recording muscle activity [13].
The primary avenues for analyzing sEMG are studying the amplitude of the sEMG and spectral analysis of the sEMG [18]. The amplitude of sEMG is related to the recruitment and discharge rate of active motor units and early research efforts used sEMG activation as a reflection of the level of activation. However, sEMG amplitude is affected by a number of factors, prominent among which are the electrode location, thickness of skin and underlying tissues, distribution of motor unit conduction velocities, etc. These factors lead to a mismatch between the output of the CNS and the sEMG amplitude [19], [20]. Spectral analysis has been widely used to study changes in motor unit recruitment and muscle fatigue in the past. However, the generation and discharge of motor unit potentials is a transient phenomenon and as such, sEMG recordings are non-stationary in nature. The ability of spectral methods to analyze and glean useful information from non-stationary signals is at best limited. This has led to the increasing use of time-frequency methods of analysis to study sEMG signals. The efficacy of time-frequency domain methods to detect transient peaks in lower back muscles has been demonstrated in [21]. In
7
addition, the ability to distinguish movement and intensity from EMG data using time-frequency methods was shown in [22], [23], and the utility of the wavelet transform in effectively distinguishing motor unit action potentials was demonstrated in [24], [25].
1.2.3 Intent Recognition
Intent recognition is defined as the observation of actions, inference of goals and prediction of future actions, and is a fundamental capability required for human-machine interaction [1]. From the perspective of prostheses or assistive devices, intent recognition is defined as the recognition of a user's intent to perform a particular motion [26], and as these devices grow more technologically advanced and complex, intent recognition is increasingly becoming an integral part of the control scheme of prosthetic or assistive devices [5]. Intent recognition for prostheses and for most assistive devices predominantly utilizes surface electromyogram (sEMG) signals from the user’s body [27]–[30]. Surface EMG signals are well suited for such intent recognition because the electrical potentials in muscles that correspond to muscular activity are generated 20 ms to 100 ms before activity occurs, and provide information regarding impending motion [16], [31]–[33]. With signals obtained from a user’s body, implementing an intent recognition system essentially involves running a pattern classification scheme [34], [35], to classify and interpret patterns in the signals that correspond to intent and motion.
In addition to sEMG signals, the inclusion of other types of sensors used, the classification methods employed, and the signal processing techniques have an important bearing on any implementation of intent recognition. The next four subsections will take a closer look at intent recognition implementations in literature, specifically intent
8
recognition of the torso, intent recognition of assistive devices in general, and the classification methods and features used for intent recognition.
Intent Recognition of Back and Torso
Intent recognition of the upper body, back and torso primarily finds applicability in assistive devices for the torso [36]–[42]. Most of the available literature in this field generally touches upon the need for intent recognition or mentions implementation very briefly. However, detailed information on intent recognition of the upper body is found to be lacking in the existing literature. To the best of the author’s knowledge, only two instances were found in the literature that provided any appreciable detail on this topic. The first of these two instances is an assistive device for the upper back called the Wearable Power Assist Suit (WPAS) [42], [43]. Photographs and a schematic of the device are shown in Fig. 1.3.
Figure 1.3: Photographs and schematic of WPAS [42].
The device shown in Fig. 3 is a five link device that spans the back of the torso and legs, with a single motor for actuation. To infer user intent, the device uses surface electromyogram (sEMG) sensors on the arms and legs, and position sensors on the torso
9
and limb joints. One of the related publications mentions an artificial neural network (ANN) was used for classification of sEMG data [43], however details or information about accuracy are not available.
Figure 1.4: Photographs of Power Assist Suit in use [36].
The second device is called the Power Assist Suit, and is intended for providing assistance during lifting tasks encountered by nursing professionals [36], [44]. Two views of the device in use during a lifting task can be seen in Fig 1.4. The device is designed to provide assistance to the arms and torso and is pneumatically actuated. For inferring intent, the device uses muscles stiffness sensors and position sensors on the arms, legs and back. The muscle stiffness sensors are essentially contact pressure sensors mounted in contact with the muscles and function as a mechanical analogue of an electromyogram. It should however be noted that no information about the classification method used, or the accuracy of intent recognition is presented.
10
Intent recognition in general
In the wider world of intent recognition for other body segments such as arms, legs or prostheses, the available research literature is well developed and informative, and presents a wide variety of information about the sensors used and the classification methods employed [3], [27], [45]. An exemplary case of intent recognition for arm motion is shown in Fig. 1.5 [28].
Figure 1.5: Intent recognition of arm movements using 4-channel sEMG [28].
Figure 1.5 shows a four-channel sEMG sensing setup on the forearm, to detect flexion/extension, radial deviation/ulnar deviation, and pronation/supination motions of the wrist. The paper presented a nonlinear classifier and demonstrated classification accuracy ranging from 75% to 90%. Another example intent recognition system for a transfemoral prosthesis is shown in Fig. 1.6 [4]. The sensing suite included six sEMG sensors, position sensors, and inertial sensors. The approach employed linear and Bayesian classifiers to classify flexion/extension, radial/ulnar deviation and pronation/supination motions of the wrist, and demonstrated classification accuracies up to 96%.
11
Figure 1.6: Intent recognition for transfemoral prosthesis using sEMG and inertial sensors [4].
Further survey of the current literature points to a preponderance of sEMG sensors used for detecting user intent [20], [28]–[30], [34], [46]–[50], followed by inertial sensors [2], [3], [5], [6], [51]. Some of the works have highlighted the limitations of solely using sEMG sensors and have presented approaches using a combination of sEMG and inertial sensors [4], [52], [53]. These publications have pointed out that using only sEMG delivers limited accuracy in classification, and have also shown that a combination of sEMG sensors with inertial sensors improves accuracy and reliability of classification. In all three of these publications, up to 12% improvement in classification accuracies was demonstrated as a result of combining sEMG and inertial sensors.
Classification Methods
In addition to sensors and sensing strategies, information about the methods used for classification of human activity and intent data is also available in the literature. The use of Bayesian decision theory and Bayesian parameter estimation methods was demonstrated with up to 96% classification accuracy in [45], [54], [55]. The use of linear methods such as linear discriminant analysis for classifying human physiological data to infer intent, was demonstrated in [5], [27], [47], [56], with classification accuracies
12
ranging from 82%-92%. Among nonlinear methods of classification, support vector machines (SVM) are currently very popular for classifying human activity and intent data, and instances with up to 98% classification accuracy can be seen in [35], [46], [57], [58]. In addition, multilayer neural networks, which have been the most popular nonlinear classifiers, have also been used with up to 98% classification accuracy, as evident in [28], [54], [57], [59], [60].
Of the classification approaches listed above, Bayesian methods require prior information about the probability distribution of the signals [37]. For an entirely new set of physiological data, this information is not available, and therefore Bayesian methods largely out of the scope of a data driven study such as the one described by this dissertation. Sample based linear methods such as perceptrons or linear discriminant analysis have been shown to be computationally efficient and mostly unsusceptible to overfitting [7], [8]. Moreover, projection based methods such as linear discriminant analysis have been shown to be able to classify multiple classes in a single-step, and are among the generally preferred linear classifiers [53]. On the other hand, nonlinear methods such as support vector machines and neural networks are notorious for being computationally complex and prone to overfitting [8].
Feature Extraction
Closely associated with the classification methods are the features used for extracting patterns from sEMG and other sensor data. Signals sampled from a physical system in the form of a time-series do not always reflect the entire information content of the measurement. Particularly, discriminating information that displays a large degree of separability between two measurements corresponding to two different states is not always
13
easily accessible from the raw data, and needs to be teased out from the mathematical and statistical properties of the signal data. Feature extraction is the most domain dependent aspect of a classification system, and it makes it possible to closely tailor a solution to a particular problem through the use of targeted, domain specific features [7], [61]. Traditionally, time-domain and frequency-domain were the most commonly used features [30], [62]. However, the advent and increasing accepting of time-frequency domain methods of analyses has led to wider adoption of time-frequency domain features extracted using the wavelet transform [25], [63], [64]. Of particular interest to this dissertation, is the selection of suitable wavelets for time-frequency domain feature extraction. Among the many families of wavelets the Daubechies family of wavelets has been found to be particular effective in analyzing sEMG recordings [35], [65], [64], [66], [67]. Multiple studies have pointed to the utility and effectiveness of multiple Daubechies wavelets from db-2 to db-8, and all the way up to db-20 [24], [25], [63], [68]. In addition, the use to feature statistics to reduce extracted features can also be seen in literature. Specifically, the use of mean absolute value, waveform length, zero crossings and sum of coefficients has been shown to be effective in reducing wavelet coefficients in [62], [69], [70].
1.3 Scope and Summary of Research
This work in this dissertation has three objectives that stem from the exploration of the space between linear and non-linear methods of classification. These objectives are to: (1) investigate and evaluate a set of non-linear features that can represent complex spatiotemporal patterns in time-series data; (2) identify and evaluate a suitable linear method of pattern classification, and establish a methodology to combine the features and method of classification; and (3) evaluate the performance of the combination of linear
14
classification and non-linear features in terms of classification accuracy, and benchmark the results against non-linear methods of classification.
In order to address the first objective, time-frequency domain features were investigated for representing spatiotemporal variations in physiological data. Specifically, the wavelet transform was employed to investigate and establish a targeted set of features for this purpose. To address the second objective, linear discriminant analysis (LDA) was selected as the method of classification. This is because it is computationally efficient and a data driven, sample based linear method of classification that makes minimal assumptions about the data. In addition a method of combining multiple features with LDA using a multi-classifier combination scheme is also presented. Furthermore, a method of fine tuning the classification performance through a weighted classifier combination is presented. To address the third objective, the combined classification, feature extraction and classifier combination methods were tested on a physiological data collected from three human subjects, and a classification accuracy of 97% was demonstrated. In order to benchmark these results, the performance of the multi-classifier LDA using nonlinear features was compared against the performance of nonlinear support vector machine classifiers, and the classification performance was shown to be comparable to that of non-linear methods of classification.
1.4 Organization
This dissertation is organized into five chapters. Chapter 1 presents the introduction, motivation, review of literature and scope of this project. To address the objectives listed in the scope and evaluate the performance of the proposed method of classification, a physiological dataset was assembled. Chapter 2 outlines the experimental
15
design and collection of the dataset used. Chapter 3 presents the extraction of nonlinear features from the physiological data, the theoretical background and methodology involved in implementation of a multi-classifier LDA, and the combination of multiple features. Before these methods were established, a preliminary study of a two-class LDA was conducted on a subset of the data. The results of this two-class study are detailed in Appendix B. Chapter 4 evaluates the performance of the combination of linear classification and non-linear features in terms of classification accuracy, and benchmarks the results against non-linear methods of classification. Finally, Chapter 5 presents the conclusions and future directions.
16
CHAPTER 2
2. INTENT RECOGNITION DATASET
To enable the development of the proposed methods of nonlinear feature extraction, linear classification and classifier combination, and to evaluate the performance of the proposed methods, a physiological dataset was assembled, by collecting data from three human subjects. In order to closely represent the motivating problem and to tightly focus on one set of motions, this dataset consisted of data corresponding to only flexion and extension motions of the torso in the sagittal plane.
It would be necessary for the physiological data input to the activity and intent recognition system, to encompass information that can help predict impending activity to recognize intent, and information about the kinematic state to recognize activity. Knowing that sEMG voltage appears in muscles about 20 ms – 100 ms before activity occurs [16], it becomes possible to access information that can help predict impending motion by reading sEMG activity from muscles. Moreover, state information and information needed for activity recognition can be acquired by employing inertial sensors (accelerometers and gyroscopes) on the body.
In order to analyze flexion and extension motions in the sagittal plane, the focus of this study is limited to muscle groups that are directly causal to this motion. These muscle groups correspond to flexor and extensor muscles of the back and abdomen. Moreover, muscle activity is recorded in a non-invasive manner at the surface of the skin and the readings are logged as surface electromyogram (sEMG) signals. Furthermore, inertial signals are recorded from multiple sensor locations on the back.
17
2.1 Experimental Design
An experimental study was designed to collect the required sEMG and inertial signals. The study involved human participants and was approved by the University of Massachusetts – Institutional Review Board (IRB). A listing of the participants’ physical characteristics is shown in Table 2.1.
Table 2.1: Physical Characteristics of Study Participants.
Participant Age Height Weight
Participant 1 24 years 1.71 m 61 kg
Participant 2 24 years 1.67 m 60 kg
Participant 3 25 years 1.75 m 63 kg
The sEMG signals were recorded from the flexor and extensor muscles of the back and abdomen using a commercial sEMG measurement system (Delsys™). The measurement system uses 12 electrodes (10 mm spacing; Ag-AgCl) sampled at 1.2 kHz to record muscle activity. Eight electrodes were placed on the back and four were placed on the abdomen.
Electrode mounting sites corresponded to multiple locations on the erector spinae (L1, L3, T9 levels) and latissimus dorsi on the back, and the rectus abdominis and external obliques on the abdomen. The electrode mounting sites were decided based on input from literature related to EMG measurement [13], [71], [72], and are listed in Table 2.2. A photograph of the sEMG sites, with the electrodes attached to a test participant can be seen in Fig. 2.1. A 60s plot of the 12 sEMG channels is shown in Figs. 2.2, 2.3 and 2.4.
18
Table 2.2: sEMG Electrode Mounting Locations.
Sensor Number Muscle Location
1, 2 Erector Spinae, L3 (Left, Right)
3, 4 Erector Spinae, L1 (Left, Right)
5, 6 Erector Spinae, T9 (Left, Right)
7, 8 Latissimus Dorsi (Left, Right)
9, 10 Rectus Abdominis (Right, Left)
11, 12 External Obliques (Right, Left)
Figure 2.1: Electrode mounting sites.
Figure 2.2: Channels 1-4 of sEMG data; 60s recording of flexion and extension motions.
0 10 20 30 40 50 60 -1 0 1 Time (s) Nor m A m pl itu de Channel #1 0 10 20 30 40 50 60 -1 0 1 Time (s) No rm A m plit ud e Channel #2 0 10 20 30 40 50 60 -1 0 1 Time (s) No rm A m pli tu de Channel #3 0 10 20 30 40 50 60 -1 0 1 Time (s) N or m A mpl itud e Channel #4 Erector Spinae – L3 Erector Spinae – T9 Latissimus Dorsi Erector Spinae – L1 Rectus Abdominis External Obliques
19
Figure 2.3: Channels 5-8 of sEMG data; 60s recording of flexion and extension motions.
Figure 2.4: Channels 9-12 of sEMG data; 60s recording of flexion and extension motions.
0 10 20 30 40 50 60 -1 0 1 Time (s) No rm A m pli tu de Channel #5 0 10 20 30 40 50 60 -1 0 1 Time (s) No rm A m pl itu de Channel #6 0 10 20 30 40 50 60 -1 0 1 Time (s) No rm A m plit ud e Channel #7 0 10 20 30 40 50 60 -1 0 1 Time (s) No rm A m plit ud e Channel #8 0 10 20 30 40 50 60 -1 0 1 Time (s) N or m A m pl itu de Channel #9 0 10 20 30 40 50 60 -1 0 1 Time (s) N orm A m pl itu de Channel #10 0 10 20 30 40 50 60 -1 0 1 Time (s) N orm A m pl itu de Channel #11 0 10 20 30 40 50 60 -1 0 1 Time (s) N or m A m pl itu de Channel #12
20
Kinematics were obtained by using a high-speed motion capture system (Qualisys™ – Oqus), which was synchronized with the sEMG measurement in order to ensure a common time-stamp on all the recordings. The motion capture system sampled motion at 240 Hz and used groups of reflective markers placed at anatomical locations on the participant’s body, to define points of interest. Principal marker placement was at the sacrum, and at the L1, T7, T4 and C7 vertebrae. These vertebral locations were used to divide the back into four distinct segments that were assumed to be rigid body segments for the purpose of studying motion [16]. The lumbar segment was defined from the sacrum to the L1 vertebra, the region between the L1 and T7 vertebrae was designated the lower thoracic segment, the region between the T7 and T4 vertebrae was designated the mid-thoracic segment, and the T4 and C7 vertebrae demarcated the upper mid-thoracic segment.
In this dissertation, data from inertial measurements have been emulated using motion capture data. Rigid planar clusters of markers, as shown in Fig. 2.5, were placed on each of the segments to accurately define and track the motion of each segment. These clusters were used to emulate inertial sensors: the first derivative of the angular deflection of a cluster emulates the ‘rate’ output of a gyroscope, and the linear acceleration of the centroid of each cluster is analogous to the output of an inertial accelerometer.
21
Figure 2.5: Optical Marker Placement for Emulating Inertial Sensors.
2.2 Experimental Protocol
The sEMG electrodes and reflective markers were affixed to the body of a research participant, who performed specific movements of the torso. The movements studied were flexion and extension in the sagittal plane. Starting from a normal standing position, the participant was asked to bend forward such that the torso made a roughly 90° angle with the coronal plane. This constituted the flexion movement, and the return from the bent position to the standing position constituted the extension movement. These movements were performed for different speeds to complete one flexion-extension movement, over a number of tests. A metronome was used to set the speed for each trial. A listing of the experimental protocol is shown in Table 2.3. This protocol is a subset of a larger study to collect data for a wider variety of motions. Details of the larger study can be found in Appendix A.
22
Table 2.3: Experimental Protocol.
Activity Speed Duration
1) Stand in neutral position - 30 s
2) Flexion/Extension – Bend
forward and stand back up 60 bpm 120 s
3) Flexion/Extension – Bend
forward and stand back up 120 bpm 120 s
4) Stand in neutral position - 30 s
5) Flexion/Extension – Bend
forward and stand back up
184 bpm 120 s
6) Flexion/Extension – Bend
forward and stand back up 208 bpm 120 s
7) Flex forward 30° and hold
position
- 60 s
8) Flex forward 60° and hold
position - 60 s
9) Hyper-extend 5° and hold
position
- 60 s
10) Hyper-extend 15° and hold
position - 30 s
11) Stand in neutral - 30 s
2.3 Pre-Processing
The sEMG signals recorded from the system corresponded to a bandwidth of 20 Hz – 450 Hz. These preprocessing for these signals included subtracting any offset from the signals and normalizing the signals in magnitude, by dividing the signal amplitude by the largest magnitude observed. No additional filtering operations were performed. The inertial signals were bandpass filtered between 5 Hz – 30 Hz, detrended to eliminate offset, and inclinations were calculated from the inertial measurements.
2.4 Data Segmentation
To enable classifier generation (training) and testing the pre-processed signals were partitioned into activities of interest. As mentioned earlier, the activities of interest for this study are flexion and extension in the sagittal plane. These activities correspond to the
23
states or classes that will be used to define and generate classifiers. In addition to these two states, another state referred to as ‘dwell’, has been defined to represent inactivity.
While collecting data, a set of motion capture cameras were continuously monitoring the motions of the subjects. From this motion capture feed, it was possible to accurately localize the commencement and conclusion of each activity. Accordingly, segments of the pre-processed signals corresponding to the commencement and conclusion of each activity and the interim period of inactivity (flexion, extension and dwell), were isolated into separate chunks of data that were subsequently used for classifier generation and testing.
The resulting dataset consisted of 12 sEMG signals and 4 inertial signals, from each of the three subjects. For classifier generation, segmented and labelled data corresponding to one of three states – flexion, extension and inactivity was made available. The classifiers so generated were tested on segmented data, as well as on a simulated real-time stream of data that represented continuous real life activity.
24
CHAPTER 3
3. MULTI-CLASSIFIER FUSION APPROACH
This chapter presents a multi-sensor, multi-classifier intent recognition approach that uses Linear Discriminant Analysis (LDA) for pattern classification. Critical to the performance of any linear classification method like LDA, are the features that are used to obtain separability in the data to enable classification. The use of targeted non-linear features with a linear classification method, to deliver improved classification accuracy is also discussed. Specifically, the identification and extraction of time-frequency domain features using wavelet transform methods, that can help deliver improved classification performance is discussed.
Building upon traditional LDA, a multi-classifier method of classification is presented, which utilizes multiple classifiers combined together using a majority voting classifier fusion scheme. In addition a weighted multi-classifier combination method for combining outputs of multiple classifiers to deliver improved classification accuracy is also presented.
3.1 Theoretical Background
3.1.1 Pattern Classification for Intent Recognition
As mentioned earlier, the problem of recognizing intent from sensor data is essentially one of classifying patterns occurring in sensor data. In this scenario, pattern classification primarily pertains to assigning pre-defined labels to objects [61] in a data-set. The objects themselves can be defined by a set of measurements, attributes or features,
25
and the objective here is to construct a discriminant or prediction rule for assigning labels to objects [73]. Such a discriminant rule is generally a projection method that looks to maximize the separability between different objects in a data set.
Among the various discriminant analysis methods, sample-based linear methods are appealing because of their simplicity of implementation. Some additional advantages of following sample-based, linear methods of discriminant analysis are that they can be purely data driven, do not require any prior information about the data, and allow minimum assumptions to be made about the nature of the data.
Linear Discriminant Analysis
Fisher’s Linear Discriminant Analysis is one such linear method of generating discriminants that seeks to project data in a manner such that separability between different objects in a dataset is maximized. In addition, while seeking maximum separability it also seeks a projection that minimizes the variance of a particular feature within the dataset.
This discriminant is constructed by seeking a function w, that projects data x, consisting of a number of classes n, onto (n-1) lines y, such that maximum separation is achieved between the classes [74], as shown in (1).
T
yw x (1)
The measure used to separate the classes is the mean of the classes, μi, shown in (2), where Ni is the number of samples in each class.
1 i x i x N
(2)This separation is achieved by maximizing a function w, which represents the difference between the means of the classes normalized by the variance in the classes. This
26
maximization can be solved as an eigenvalue problem dependent on the scatter within the classes SW, and the scatter between the classes SB. This is an eigenvalue problem that
essentially reduces to the expression in (3).
1
W B w
S S w (3)
The variance of each class can be quantified by the scatter of the class, defined in (4) below.
i i i T x i S x x
(4)The summation of the scatter of all classes gives the ‘within-class scatter’ SW,
expressed in (5) below.
W i
i
S
S (5)The variance between the classes is quantified by the ‘between-class scatter’ SB.
For data that contains m classes, it is expressed as in (6).
1 B i i i i m T S N
(6)The eigenvectors obtained from (3) yield the projections w, which are the classifiers used to separate the data. This projection is called Fisher’s linear discriminant and gives the directions for projecting the data such that maximum separation is achieved between classes.
Multiple Classifiers
The accuracy of classification obtained from LDA can be improved by using multiple classifiers. The advantages of using multiple classifiers are threefold [61]. From the statistical point of view, combining multiple classifiers helps to average the outputs of
27
multiple classifiers and avoid having to select a single best classifier that might not be adequate by itself. From the computational viewpoint, combining multiple classifiers can help avoid possible local optima. Thirdly, from the representational point of view, there is a possibility that the solution space of a particular problem might not encapsulate the optimal classifier. In such a case, multiple classifiers can possibly approximate the solution more accurately. Multiple classifiers can be combined using two major strategies. These are classifier fusion and classifier selection. Classifier fusion utilizes approaches such as averaging or majority voting to obtain classification accuracy that is better than that can be obtained from the individual classifiers. Classifier selection involves choosing the best classifier out of a set of multiple classifiers. When it comes to biomechanical signals, it has been shown that fusion based approaches deliver better results with a combined accuracy far better than any single classifier [75], [76]. Therefore the adoption of a fusion based approach, specifically majority voting based fusion is proposed to improve upon the classification performance of traditional LDA.
3.1.2 Feature Extraction
Signals sampled from a physical system in the form of a time-series do not always reflect the entire information content of the measurement. Particularly, discriminating information that displays a large degree of separability between two measurements corresponding to two different states is not always easily accessible from the raw data, and needs to be teased out from the mathematical and statistical properties of the signal data.
28
Time Domain and Frequency Domain Features
Traditionally, time-domain and frequency-domain features were commonly employed for extracting discriminating information from sensor generated signals, and a previous study by the author of this dissertation has also investigated these features [53]. These features are commonly used as a starting point in similar studies, and are listed here to serve as a point of comparison against subsequent studies. The features extracted were the mean absolute value, the variance, the signal length, the spectral energy and the three most prominent frequency components, and are explained below [30], [62].
1) Mean Absolute Value
The Mean Absolute Value (MAV), is the average of the absolute value of a signal
xi, in a window of n samples and is expressed in (7). It provides a quantifiable measure of
muscle contraction levels and is therefore a principal feature in processing sEMG data.
1 1 n i i MAV x n
(7) 2) VarianceThe variance var, provides a measure of the signal power. It is expressed in (8) below.
2 1 1 1 i n i var x x n
(8) 3) Waveform LengthThe waveform length WL, shown in (9) is representative of the complexity in the signal, and is defined as the cumulative length of the signal over a time segment. It possesses information about amplitude and frequency of the signal.
29 1 1 i i n i WL x x
(9) 4) Spectral EnergyThe spectral energy ES, helps identify the periodicity in the signal, and is calculated
from Fourier transform components Xk, that are calculated from the signal xn, as shown in
(10) and (11). 1 2 0 1 S n N k E X N
(10) 1 2 0 N i n N k k n n X x e
(11) 5) Frequency ComponentsThe frequency components ak, are calculated from Fourier series coefficients as
shown in (12). The first three coefficients in order of decreasing absolute magnitude are selected as features. 1 2 0 1 N i n n N k k n a x e N
(12)Time-Frequency Domain Features
Knowing that human motion and sEMG data are non-stationary in nature, the major focus of this study is on frequency domain features. Implementation of time-frequency domain feature extraction is achieved by using the wavelet transform. Previous research on the applicability and use of wavelets in analyzing sEMG data and for feature extraction has generated a substantial amount of literature, as has been listed in the review of literature. This abundant research record is useful in selecting operating parameters such as wavelet bases, the method of wavelet decomposition, and other nuances of feature
30
extraction. The applicability of wavelet transform feature extraction to classification problems involving sEMG and other related signals is evident in a number of research efforts [21], [25], [29], [34], [49], [50]. On a narrower level, a number of studies have highlighted the utility of the Daubechies family of wavelets in representing sEMG waveform [22], [49], [63]. Another interesting aspect of wavelet transform based extraction methods is the use of statistical moments calculated from wavelet coefficients, which were introduced in [65]. These research studies help inform our choice of wavelet bases and feature statistics, for use in the current study.
3.2 Methods
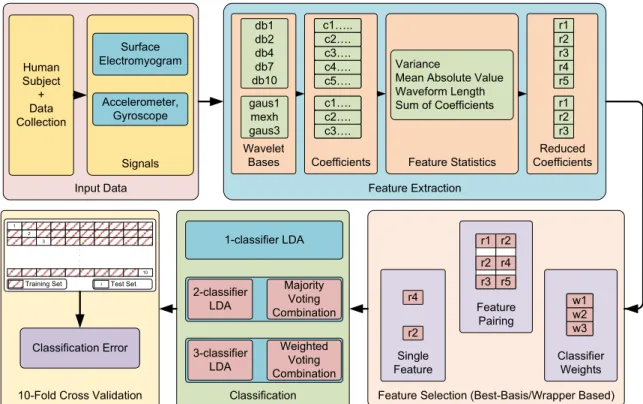
The proposed multi-sensor, multi-classifier approach towards intent recognition is made up of a number of different methods. This section discusses the methods employed in this study. An overview of the methods used in this approach is shown in Fig. 3.1.
The workflow starts with the collection of physiological data from human subjects performing flexion and extension motions in the sagittal plane, which was presented in the previous chapter. The next step discusses extraction of features, where wavelet bases are employed to elicit time-varying properties from signals, and feature statistics are run over the coefficients to reduce the dimensionality of feature vectors. The next stage deals with selecting the best subset of features, from the total set of features obtained from the feature extraction stage. This is followed by classification, where three different approaches are discussed.
31
Figure 3.1: Flow diagram illustrating methods employed in this analysis.
3.2.1 Feature Extraction
As mentioned earlier, the wavelet transform has been employed to extract targeted time-frequency domain features from the input data. Specifically, a coarse-grained form of the continuous wavelet transform (CWT) have been employed to extract features from the data. The mathematical expression for a general CWT is shown in (13) below.
* 1 ( ) t b C x t dt a a
(13)In the equation above, ψ* is the mother wavelet, b is the translation parameter, a is the scaling parameter, and C is the set of coefficients generated from the wavelet decomposition. To this equation, coarse graining is applied such that the usual fine resolution of the frequency scales is avoided by using exponential scales with a base equal to 2 in the scaling parameter a, as shown in (14).
Feature Extraction Wavelet Bases db1 db2 db4 db7 db10 gaus1 mexh gaus3 Coefficients db1 db2 db4 db7 db10 Feature Statistics c5…. c4…. c3…. c2…. c1….. gaus1 mexh gaus3c3…. c2…. c1…. Reduced Coefficients Variance
Mean Absolute Value Waveform Length Sum of Coefficients r5 r4 r3 r2 r1 r3 r2 r1 Input Data Signals Surface Electromyogram Accelerometer, Gyroscope Human Subject + Data Collection
10-Fold Cross Validation
. . . .
Feature Selection (Best-Basis/Wrapper Based) Single Feature Feature Pairing Classifier Weights w3 w2 w1 r4 r2 r3 r2 r1 r5 r4 r2 Classification 1-classifier LDA 2-classifier LDA Majority Voting Combination 3-classifier LDA Weighted Voting Combination Classification Error 1 2 10 3
32
2 ;k [1, 2,...7]
a k (14)
Due to the coarse graining of the frequency scales, finer frequency resolution is traded off for faster computation time. This is a viable trade-off because we are interested in discriminating features in a broad region of interest that spans 37.5 Hz – 150 Hz for the sEMG data and 1 Hz – 10 Hz for the inertial data. The erector spinae muscles are known to have EMG activity in a broad range of frequencies from 70 Hz to 120 Hz [77]. These choice of two adjacent wavelet space frequency bands, from 37.5 Hz – 75 Hz and 75 Hz – 150 Hz encompasses the frequency range of the muscles and helps to obtain a targeted feature space for the muscles.
During implementation, sliding windows of width 512 samples (426 ms) were used for the wavelet decomposition described in (13). In other words, a 512-point wavelet decomposition was carried out at every stage. After every decomposition, the sliding window was shifted by 24 samples (20 ms) to capture data for the next stage.
The selection of wavelet bases ψ*, in (13) is primarily informed by available literature, but at the same time knowing that wavelet representation is an exercise in template matching, wavelets that match the shapes of the waveforms shown in figures 9-11 are desirable. Accordingly, for the sEMG signals, five bases from the Daubechies family of wavelets were used as basis functions, and for the inertial signals the Gaussian and its derivative wavelets were used as basis functions. Studies have shown that erector spinae activity occurs within a 75 Hz – 90 Hz range [77], and accordingly the 75 Hz – 150 Hz and its adjacent 37.5 Hz – 75 Hz frequency sub-bands were selected for extracting coefficients. Moreover, the coefficient arrays obtained from (13) were further consolidated into a single
33
‘feature statistic’. A listing of the wavelet bases and associated feature statistics is shown in Table 3.1.
Table 3.1: List of Mother Wavelets and corresponding Feature Statistics. Feature
Number Wavelet Name (Symbol) Feature Statistic Frequency Sub-band
sEMG
Features 1 Daubechies-1 (db1) Sum of absolute coefficients 75 Hz – 150 Hz
2 Daubechies-1 (db1) Waveform length 75 Hz – 150 Hz
3 Daubechies-2 (db2) Variance 75 Hz – 150 Hz
4 Daubechies-4 (db4) Sum of absolute
coefficients 37.5 Hz – 75 Hz
5 Daubechies-4 (db4) Sum of absolute
coefficients
75 Hz – 150 Hz
6 Daubechies-4 (db4) Mean absolute
value 37.5 Hz – 75 Hz
7 Daubechies-7 (db7) Sum of absolute
coefficients
37.5 Hz – 75 Hz
8 Daubechies-7 (db7) Mean absolute
value 37.5 Hz – 75 Hz
9 Daubechies-10 (db10) Waveform length 37.5 Hz – 75 Hz
Inertial Features
10 Gaussian (gaus1) Sum of coefficients 0 Hz – 9.375 Hz
11 Mexican Hat (mexh) Sum of coefficients 0 Hz – 9.375 Hz
12 Second derivative of Gaussian
(gaus3) Sum of coefficients 0 Hz – 9.375 Hz
13 Fourth derivative of Gaussian
(gaus5)
Sum of coefficients 0 Hz – 9.375 Hz
3.2.2 Classification
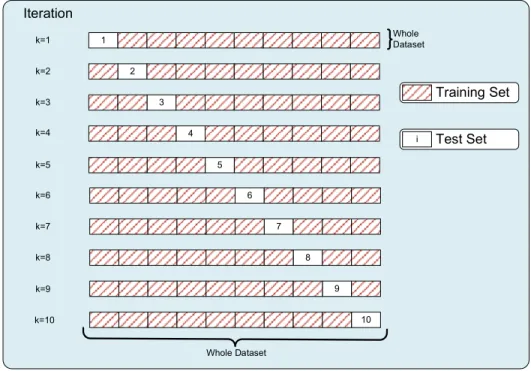
The features obtained from the feature extraction stage were used in the generation and testing of classifiers. Initially, a single classifier was generated through a 3-class LDA. The three classes were defined as a) Flexion in the sagittal plane, b) Extension in the sagittal plane, c) Dwell, or inactivity. Features were extracted every 20 ms using a 512 ms overlapping time window, and fed to an LDA routine. For a 3-class LDA, eqn. (3) generates two Eigen vectors, and the Eigen vector corresponding to the larger Eigen value is chosen as the LDA projection, w. The classification performance of the classifier generated from this analysis was evaluated using an iterated ten-fold cross validation method. After the
34
single-classifier LDA was tested, a multi-class classifier as detailed below was implemented and evaluated.
Multi-Classifier Strategy
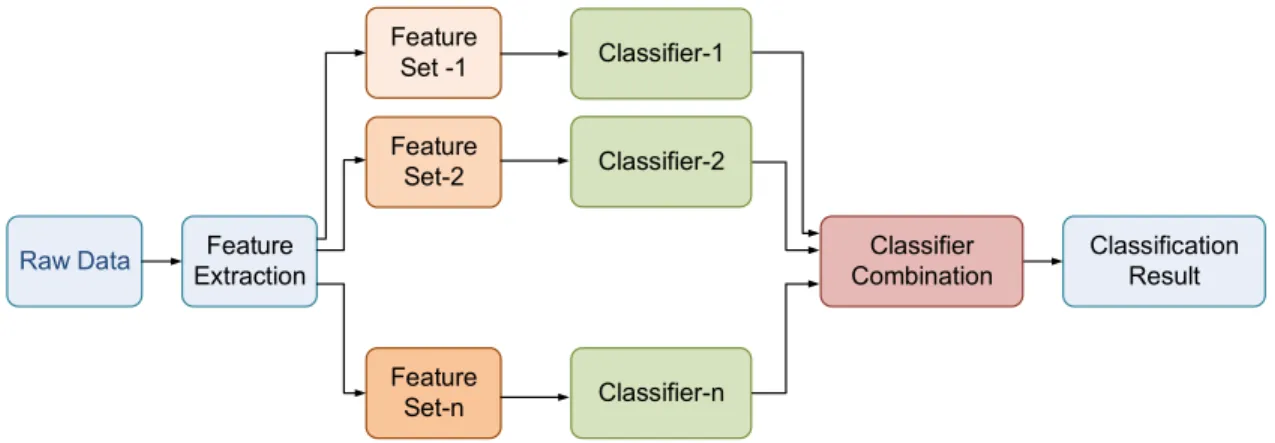
In order to improve upon the performance afforded by a single classifier, a multi-classifier combination strategy has been adopted. This approach is based on the idea that combining the opinions of an ensemble of individual classifiers can possibly result in a better opinion [61], [78]. The basic premise of the strategy employed in this paper, can be encapsulated in the flowchart shown in Fig. 3.2. As seen in the figure, multiple features are extracted from the sensor data, and individual classifiers are generated from each feature. The class labels generated by all the classifiers are subsequently combined to generate a final classification result that is informed by the contributions of all the classifiers involved. Specifically, each of the 9 sEMG features were paired up individually with every one of the rest, to generate 36 possible pairs of features. After studying these pairs or 2-classifier combinations, every one of the pairs was then combined with a single inertial feature, to generate 36 3-classifier combinations.
Figure 3.2: Flowchart depicting multi-classifier strategy.
Raw Data Feature
Extraction Feature Set-2 Feature Set -1 Feature Set-n Classifier-n Classification Result Classifier-1 Classifier-2 Classifier Combination
35
Classifier Combination
To combine the multiple classifiers mentioned in the immediate previous section, two kinds of combination methodologies were investigated. These are defined in the following equations.
Simple majority voting fusion
This is a simple plurality voting scheme, where a simple summation of the class labels is used to implement classifier combination.
1 1 , maxN m i n i n i k k
(15)In the equation above, k is the class label, m is the number of classes and N is the number of classifiers.
Weighted majority voting fusion
If classifiers in a group are not of identical accuracy, then it is reasonable to bias/weight the classifiers in a manner such that more accurate classifiers can have more of a say in the final result. This can be implemented according to (16) below.
1 1 , max i n m N n i i i k b d
(16)In (4), d is the initial (individual) class label, k is the final (resulting) class label, m
is the number of classes, N is the number of classifiers, and b is a numerical weight assigned to the classifier.
In practice, a 3-dimensional quantity has been designed to accompany every classifier output. The classifier output itself is a numerical label that identifies the class,
36
and the 3-dimensional quantity is the weight assigned to that particular classifier. This weight w, can be expressed as shown in (17) below.
w i j k (17)
In (17), i, j, k, are numerical values (0i j k, , 1 ) that represent the confidence of the classifier in predicting a class. When outputs from multiple classifiers are obtained, they are combined via summation of the columns of the matrix shown in (18).
1 1 1 2 2 2 3 3 3 i j k w i j k i j k
(18)After summation of the columns, the three values are compared and the maximum of the three resulting values is then designated as the combined classifier output. The individual weights are designed such that the maximum possible sum of a column is 1.
Model Selection
The preceding three sections have discussed features, feature groupings and weights for combining features/classifiers. The selection of features, feature sets and their respective weights is treated as a model selection problem, guided by a variant of a Local Discriminant Bases algorithm based on the Best-Basis Paradigm [79], [80]. The Best-Basis Paradigm is a three step process that involves 1) establishing a collection of features or bases 2) sorting the features by a property relevant to the problem 3) selecting the best surviving feature.
For a classification algorithm such as LDA, the defining property is the separation between different classes in a recorded data stream. Generally, a measure known as the cross entropy or relative entropy, which is calculated from the probability distribution of
37
each class, is used as a defining property. In the absence of any probability information, the next best measure of separation is the classification performance of the feature on a subset of data. Accordingly, a wrapper based selection method [81], where a collection of features was evaluated for classification performance on a subset of the data, was adopted. The available data was segmented into a training set, two validation sets and a test set, as shown in Fig. 3.3. The classifiers generated from the training set were tested on the first validation (Valn-1) set to select the best feature set, and subsequently tested on the second validation set (Valn-2) to select the best weighted feature set. The performance of the resulting classifier was finally evaluated on the final test set.
Figure 3.3: Data segmentation for feature selection.
3.2.3 Classifier Performance
The performance of the features and classifiers discussed above needs to be evaluated in order to ensure that they can classify new, but similar data. This performance is quantified in terms of the classification error and classification accuracy. The classification error is defined as the ratio of the number of data points misclassified to the total number of data points in the test set. The error, when multiplied by 100 gives the ‘error rate’, which is expressed as a percentage. The classification accuracy is obtained by subtracting the percent error rate from 100%, and is also expressed as a percentage. While
![Figure 1.1: Structural organization of muscle [10].](https://thumb-us.123doks.com/thumbv2/123dok_us/782122.2598910/18.918.295.678.455.787/figure-structural-organization-of-muscle.webp)
![Figure 1.2: Motor Unit: Motoneuron, motor axon, muscle fibers [10].](https://thumb-us.123doks.com/thumbv2/123dok_us/782122.2598910/19.918.310.663.340.617/figure-motor-unit-motoneuron-motor-axon-muscle-fibers.webp)
![Figure 1.3: Photographs and schematic of WPAS [42].](https://thumb-us.123doks.com/thumbv2/123dok_us/782122.2598910/22.918.201.771.653.880/figure-photographs-schematic-wpas.webp)
![Figure 1.4: Photographs of Power Assist Suit in use [36].](https://thumb-us.123doks.com/thumbv2/123dok_us/782122.2598910/23.918.312.654.250.550/figure-photographs-power-assist-suit-use.webp)