The Four Pillars
Upon Which the Failure
of Math Education Rests
(and what to do about them)
Copyright © 2011 by Matthew A. Brenner
This work is licensed under the Creative Commons Attribution-NonCommercial-NoDerivs 3.0 Unported License. See creativecommons.org/licenses/by-nc-nd/3.0/
Rev. 6.7 (7/20/2011)
CAAMPSTM is a trademark of Matthew A. Brenner
For information contact: [email protected]
Electronic copies of this executive summary are freely available from:
http://www.k12math.org/doc.php?doc=4pillars-s1
Electronic copies of the full-length essay are freely available from:This essay, and the pilot I hope it will spawn, are for the countless millions of children whose minds have been numbed, curiosity diminished,
and learning made joyless
About the Author
Matt Brenner taught computer science to high school students at Phillips Exeter Academy (Exeter, NH) and to high school and middle school students at Sidwell Friends School (Washington, DC). He studied computer science and economics at Duke University and holds an Ed.M. from the Harvard Graduate School of Education.
At Sidwell, he was unexpectedly assigned to teach an algebra class. That first and only experience teaching math drove him from the classroom to unravel the mysteries of the widespread failure of math education. The result is a new, modern, and rigorous approach—a Computationally Augmented Approach to Math and Problem Solving (CAAMPS)—that draws heavily on scientific research while focusing relentlessly on students' understanding and explicit metacognitive skills development.
The greatest challenge is stating the problem in a way that will allow a solution.
Bertrand Russell
Why this essay?
Math education in the U.S. cannot be made worse. The most closely watched international test of student achievement in mathematics, PISA (Program for International Student Assessment), shows that there isn't a single country the U.S. competes with, in any meaningful way, where students perform worse in math than our own. This situation is not new.
I came to math education unexpectedly and entirely by accident. What I saw when I taught my first (and only) math class (9th grade algebra) was a
bunch of nice kids dispirited by their previous eight years of math education. For almost all of those children, math education had ground down their curiosity, diminished their interest, and left them resigned to four more years of mindless, mechanical procedures they didn't even hope to understand. Understanding, a chief goal of every intellectual endeavor, is an uninvited stranger in math education. Without understanding, however, all of K-12 math education is much less valuable than a four-function calculator from the Dollar Store.
When I began teaching that math class, I was already (if I may say) an experienced and skillful teacher of computer science. Throughout that year, I made a sustained effort to grasp the ways, means, and ends of my colleagues in the math department. I also devoted much thought to the many differences between the values, practices and goals I perceived in math education and those I brought with me from teaching computer science. They were worlds apart. At the end of that year I left the classroom determined to unravel the mysteries of the failure of math education and to develop a realistic and practical approach that can be applied widely and with a significant likelihood of greater success.
From that effort came this essay, which I write for two reasons:
1. to set forth the fundamental problems of math education and a new approach likely to produce better outcomes
2. to attract a public school district interested in conducting a pilot program to evaluate and refine the approach set forth herein
I hope some innovative superintendent, disappointed with the outcomes of math education in his or her schools, will realize there is vast opportunity for improvement, at little cost, if tradition and momentum can be restrained long enough to give knowledge, reason, and understanding a try.
Table of Contents
1. Math Education: It Isn't Working 1
Increasing Importance of Math Education...3
Good News...4
Teaching Math...4
Trauma...4
Teaching Computer Science vs. Teaching Math...5
Momentum...6
Teachers Teach as They Were Taught...6
Popular Textbooks...7
Masking Failure...8
The Bar is Never Set...10
Delusion...12
A Nation at Risk...13
No Child Left Behind...13
Is the Progress Real?...15
National Assessment of Educational Progress...16
No Child Left Behind Cannot Work...19
Race to the Top (more of the same)...21
Aren't Teachers Responsible for Educational Outcomes?...24
Conclusion on Delusion...26
Outcomes...26
What Do Other Nations Do?...28
2. What Science Says About Learning and Teaching 33 Summary of Findings...34
3. The 4 Pillars 37 Pillar 1: The Approach (not content) of Math Education is Too Abstract and Decontextualized...38
Math Education Begins Concretely but Soon Becomes Abstract...38
Children Need Context...39
Math Without Context...40
From the Concrete to the Abstract...40
Context at Odds with Experience and Reason...43
Meaningless Contexts...45
Missing Context...47
Pillar 2: Math Education Conveys Rituals and Procedures But Not Understanding...49
Math Student Rituals...49
The Ritual of Graphing...50
The Naming Ritual...51
Procedure After Procedure, Without Understanding...53
Pet Tricks...55
Ready... Set... Ready... Set... Ready... Set... (but never Go!)...56
Endless Practice in Mechanics...57
Understanding Reduces Dependence on Memory...59
Pillar 3: Metacognitive Activity is Absent in Math Education...60
Improving Metacognition...61
Metacognition and Intellectual Ability...62
Teaching Metacognition...63
Pillar 4: Sociolinguistic Obstacles to Success in Mathematics...65
Dominant Culture...66
Literacy in a Speech Community...67
An Achievement Gap...67
If This Seems Like Nonsense...68
Preferred Narrative Form...68
What Has This to do with Mathematics?...70
4. What to do... 73
10 General Curricular Requirements...73
1. Understanding Must be Central in Math Education...73
2. Textbooks Must Not be Allowed to Undermine Math Education.73 3. Teachers Must Stop Teaching Math as They Learned It...74
4. Curricula Must be Coherent and Cumulative...74
5. Worked Examples Must be Emphasized for New Material...75
6. Curricula Must Include Examples of Excellent Performance...75
7. Assignments Must Draw on the Old and the New...75
8. Content Must be Meaningful and Contexts Must be Rich...75
9. Metacognitive Activity Must Pervade Mathematical Activity...76
10. Language Must be Taught, Used and Evaluated Fairly...76
Selecting Goals...76
Widespread Agreement on Arithmetic...77
Agreement on Content Only...78
My 5 Goals for Math Education...79
What is Algorithmic Thinking and Why is it Important?...80
The Emerging Importance of Algorithmic Thinking ...81
Integrating Algorithmic Thinking into Math Education...82
Thinking Tools...84
The Millennium of Glass...85
Most Important Thinking Tool of the New Millennium...86
How Will Math Education be Improved with Computation?...89
1. Many Problems Can be Approached Computationally First...90
2. Abstract Math Concepts Become Concrete in Computing...93
Functions...93
Inverse Functions...97
Sets, Arrays, Matrices...99
Number Systems...100
Recursion...101
Multiple Representations...101
Assignment vs. Relationship...102
Relationships of Equality and Inequality...104
Operators, Precedence, and Overloading...105
4. Thinking with Symbols Becomes Routine...105
5. Parametric Thinking Becomes Routine...106
6. An Infusion of the Practical...110
7. Habits of Mind...111
The Need to Understand...111
If I Can't Solve a Problem in 5 or 10 Minutes...112
Logic and Reasoning...113
Noticing Errors...115
Iterative, Metacognitive Activity...115
8. A Less Uneven Playing Field...116
9. Work can be Divided and Shared...117
Pedagogy and Content or Approach with Goals...117
The “Math Wars”...117
What Students Do is Vital...119
Implementing a CAAMPS Curriculum...120
Starting in Middle School...120
Which Middle Schools?...121
Measuring Efficacy...122
Curricular Materials and Teacher Support for CAAMPS...122
Preparing Teachers for CAAMPS...123
The Next Step...123
5. Research Findings 125 5.1 - Memory...125
5.1.1 - Working Memory...126
5.1.2 - Importance of Meaning...127
5.1.3 - Importance of Processing...127
5.1.4 - Abstracting Experience into Schemas...128
5.1.5 - Another View...130
5.1.6 - Effects of Practice on Performance...131
5.1.7 - How the Volume of Information Affects Memory...132
5.1.8 - Inference...132
5.1.9 - Memory Errors or Signs of Intelligence?...133
5.2 - Problem Solving...134
5.2.1 - Instruction and Examples...134
5.2.2 - Mental Blocks...135
5.3 - Proficiency...135
5.4 - Cognitive Load Theory (CLT)...136
5.4.1 - Means-end Analysis...137
5.5 - Representation...139
5.6 - Language...142
5.7 - Problem Solving vs. Worked Examples...145
1
Insanity: doing the same thing over and over and expecting different results. Albert Einstein
1. Math Education: It Isn't Working
Math Education:
It Isn't Working
We, in the U.S., had one of the best K-12 school systems in the world. Today, a great many nations have school systems better than our own. We react not by improving our system of education, not even by ignoring this alarming reality, but instead by working hard to delude ourselves into believing we are actively improving it while we do nothing of the sort.
This is an important matter for several reasons. First, in an increasingly complex and competitive world it is a shame to see our society being left behind. The days of well-paid manufacturing jobs, ones that afford workers a spot in the middle class without acquiring even a shadow of a good education, are far behind us. In the world before us, those who are uneducated are at great risk of being unproductive too. They will pay, individually, in reduced wages, worse health, and the likelihood of finding less fulfillment and satisfaction in their lives. All will pay the high costs of a widespread and preventable failure to develop our human capital: higher unemployment, greater health care costs, lost creativity and invention, increased poverty, greater conflict, and needless suffering. Second, 10 or 12 years of educational failure are followed by 50 or 60 years of consequences. Kids who fall through the K-12 cracks will not get another chance at education. If children do not make a connection between themselves and intellectual activity in their school years—no matter the reasons—some of their potential is lost forever.
Third, in 2008, even before our current recession, 21% of U.S. children (under 18) were living in poverty (National Poverty Center, n.d.). For those15.5 million children there is only one certain path to the middle class: education. The chances of winning a lottery, entering professional sports, or striking a big record deal are infinitesimal. Only education works every 1
2 Math Education: It Isn't Working
single time. Education doesn't guarantee success or happiness but it does cure poverty. Our ineffective system of education least serves those who need it most.
Fourth, widespread educational failure is a tragedy because it is avoidable. The fault of our educational failure is not in our stars, not even in ourselves, it is mostly the result of inertia and inattention. Not a single American wants a fourth-rate education system, but that is what we have. The Organization of Economic Cooperation and Development (OECD), a group of 34 industrialized countries, cooperates in many areas including the measurement of educational outcomes. Students in only five OECD nations (Greece, Israel, Turkey, Chile and Mexico) score (statistically significantly) lower than our own (OECD, 2010). This is not the fault of teachers or their unions. It is not because we lack choice or accountability, nor because the marketplace for education needs to be more competitive. It is not due to the disintegration of communities and the nuclear family. It is due to the inertia of an enormous, change-resistant educational system and inattention to the ever-increasing mismatch between this system and a world of accelerating change.
Educational efforts began well enough in the United States. From 1852 - 1918 every state created a compulsory public school system. Every goal of public education has been laudable from the earliest days until today: widespread literacy and numeracy, learning our own history and geography, understanding the world around us affectively through art and literature, conceptually and physically through math and science, etc. Public education is by far the most visible institution in America. Ninety percent of U.S. children attend K-12 public schools. We have 99,000 public schools, enrolling 50 million students, employing over 3 million teachers and another 3 million non-teachers (administrators, support staff, etc.), using 475,000 school buses (distinctively painted in National School Bus Glossy Yellow). Public schools are everywhere. By comparison, the postal service (second most visible institution?) has 33,000 post offices, 600,000 employees, and 220,000 vehicles.
Schools are the bedrock of communities. We trust them with our children. Beyond their fundamental role of education, they are gathering points—like no other—for sporting events, plays, community meetings, guest speakers, bake sales, emergency shelters and clinics, and voting. It is in and about schools where children and parents make friends, find common ground, and cooperate for their own and the greater good. In a come-and-go world of unpredictable and accelerating change, schools remain ever-present and unchanging across generations. The very scale and permanence of schools has endowed them with enormous inertia. We don't want our schools to change because they have no substitute—so they don't.
The single most important educational activity in schools is developing literacy, so, appropriately, literacy gets the most time and attention. Literacy aside, far more time is devoted to math than any other subject. Yet, our math
The 4 Pillars Upon Which the Failure of Math Ed. Rests 3
students rank in the bottom quarter among our peer nations. There is no educational endeavor in the U.S. that is less successful (actually harmful, I will argue) than math education, the topic of this essay. Math education wasn't much different, or any better, 60 years ago. The difference is that the world has become more crowded and more competitive, and by not moving forward in math education we are slipping behind.
Increasing Importance of Math Education
No doubt, math education should develop numeracy and basic arithmetic skills in all students and support science education. Shouldn't it also help, if possible, to develop more general habits of mind and thinking skills? We live in a pivotal time. We are being swept by great forces in the direction of an ethical, economic, cultural, and even biological, abyss:
•journalism is in a state of collapse
•shame is dead, so leaders of all stripes speak in self-service and without regard for truth
•we Americans have a deep-seated, pervasive, and unreasoned faith in technology
•marketing has been perfected to shape our culture and direct our resources
•it is easy to emigrate from the real world into countless virtual ones •concentrations of wealth are at an all-time high in our land
•statistical arguments are increasingly important in public policy debates
•our planet and its ecosystems are in crisis
•human experiences are increasingly indirect and mediated by technologies or marketeers
All of the underlying forces, sweeping us this way or that, act most powerfully and with least opposition when we are ignorant of them. Individuals are better able to recognize and actively navigate them when each can:
•think clearly, critically and abstractly •understand statistical inference •evaluate the quality of evidence
•construct well-reasoned arguments and recognize poorly-reasoned ones
Developing these habits of mind and thinking skills can and should be developed as part of math education. They will yield benefits in
4 Math Education: It Isn't Working
mathematical and other contexts too.
In this four-part essay on math education I will:
1. describe the current, poor state of math education and the macro forces that make it very resistant to change
2. present findings from cognitive psychology and neuroscience about what promotes and impedes learning
3. identify the “Four Pillars Upon Which the Failure of Math Education Rests”
4. prescribe how to align math education with our present needs and students, bring math education into the twenty-first century, and make it more effective
Good News
Lest you fear that this essay will present gloom without hope, I tell you now, I have good news: it is simple to fix math education in our schools. Not easy, but simple. I don't want to close any schools. I don't want to restaff them. I don't want to run them like businesses. I don't want to eliminate any of their many functions. I don't care to do those things because the steady efforts to apply those solutions over the last 10 years have entirely failed to improve outcomes. The fundamental problems lie elsewhere.
Teaching Math
I taught computer science (CS) at Phillips Exeter Academy (Exeter, NH) for six years. While there, I persuaded the faculty to require the study of CS, designed an appropriate curriculum, quadrupled enrollment, and brought perfect gender (and other) balance to a discipline notorious for the underrepresentation of female students and students of color. Then I joined Sidwell Friends School (Washington, DC) to grow their high school CS program and develop one for their middle school. At Sidwell, I was unexpectedly assigned to teach a 9th grade algebra class: 18 kids, five times
per week, for a year. I never intended to teach math and had never thought about how to teach it. The experience was shocking, deeply troubling, and prompted me to write this essay.
Trauma
From the moment I met my math students I was struck by something terrible. For two weeks I struggled for words to help me understand what I
The 4 Pillars Upon Which the Failure of Math Ed. Rests 5
was feeling. The kids were charming, full of energy, and dazzled by being in high school as only 9th graders can be. But it was also clear that most of
them were intellectually scarred. They had been traumatized by their experiences of math education.
During the first weeks of class many of my students asked me, always indirectly, how “hard” was I going to be? They weren't at all asking how hard the math would be; they had long concluded there was no hope for the math. The only question was whether there was any hope for me: would I be a hard grader or an easy one?
My word search ended when it struck me that this trauma already has a name: math anxiety. I had heard the term countless times, but never saw it up-close or, more likely, hadn't noticed it. The term always seemed hyperbolic and kind of silly to me, blowing a small thing entirely out of proportion. Now, I find the term under-powering, wholly inadequate to describe the long-term, chronic frustration and shame inflicted on countless millions of students for years on end in the name of math education. How many disciplines have been granted their very own category of suffering?
Teaching Computer Science vs. Teaching Math
When I arrived at Exeter, CS classes were entirely elective. Every student in every CS class wanted to be there. By the time I left, with a CS requirement in place, the great majority of students in CS classes were there to satisfy the requirement. The same thing, of course, brings most kids to math classes, but there remains a fundamental difference.Students taking an introductory CS course start from scratch. There is no assumption of prior knowledge or experience in CS, and the curriculum can be flexible. It starts at one of many possible beginnings and goes until the term runs out, without any required destination. With merely a one-course requirement most students will not take a second course, so there is no conceivable reason to rush; better to develop genuine understandings of fewer important ideas and techniques than to leave students confused about more.
In contrast, a 9th grade math class must fit between the 8th and 10th grade
ones. This may seem obvious and insignificant, but it is profound. Each year of math is like a piece of pavement in a road; it must connect the prior year to the next. Also, in high school each year of math is an over-stuffed grab bag of disconnected topics. The sheer volume of topics is so great that teachers must move at a pace far too fast to allow most students to develop any deep understandings. It is flatly impossible to “cover” all the required topics and also devote the time students need to understand them, so the goal of understanding is abandoned. Once understanding is displaced as the central goal in math education, the sky's the limit, and any quantity of topics can be covered. The faster the race through topics, the greater the
6 Math Education: It Isn't Working
momentum, and it is momentum—not reasoned thought, or educational efficacy, or outcomes—that drives the entire enterprise of math education.
Momentum
The momentum of math education makes it awfully difficult to change. Sure, there is always a bit of tinkering around the edges by individual teachers doing some things in unique ways. When noticed, they are regarded as gifted teachers or eccentric cranks depending on their methods. Their work, however, never alters the course of math education. They retire or leave teaching, and their methods go with them. Math education is a runaway train driven by the enormous momentum of its self-sustaining status quo:
1. teachers teaching the way they were taught
2. ill-conceived textbooks in print for generations without change 3. procedures and testing methods that mask failure at every level
Teachers Teach as They Were Taught
It is my assertion that 15% of humans are just “good at math.” Math comes easily to them, in the same way that drawing, singing, or foreign languages come easily to some. I can't find any published research on this point, so this estimate of 15% is entirely my own. Perhaps the “correct” percentage is somewhat lower or higher, but the notion that some people are naturally “good at math” while most people are not rings true for most everyone. Let me add that I am emphatically not saying anything about who can and cannot learn math, merely that it comes easily to a relatively small portion of humans. Most everyone who works hard at most anything can develop basic competence.
I don't worry about the 15% of students who learn math easily. Those students deserve to be nurtured and well-guided to help them reach their full potential. But let's be clear: if chimpanzees lead their math classes those kids will learn math—they can't help it. It's the 85% of students, the ones who don't find math easy, that I worry about. I will argue that no student should be taught math as it is currently taught, but for the 85% who must work at math to develop understandings the current methods cannot be made worse.
Now, consider math teachers (teachers who teach only math) as a group. They're smart. They work hard. Like all teachers, they want to help kids succeed in their subject. Just about 100% of math teachers are from the 15%. They are good at math and learned it in the same way they teach it. It is perfectly natural for them to believe, “I'm good at math. This is how I learned math. This is how everyone else who is good at math learned it.
The 4 Pillars Upon Which the Failure of Math Ed. Rests 7
This is how everyone should learn it.” Of course, everyone who is gripped by math anxiety, or has been mathematically crippled by her math education, or is terrible at math, or hates math to his core also learned math that way—and outnumber them too.
Popular Textbooks
Few teachers have the time or specialized skills necessary to create their own teaching materials in whole or even in large part. In math classes, most teachers produce handouts and worksheets of various sorts but rely very heavily on their textbooks. The textbook provides sequence (which teachers routinely tweak), detailed explanations, examples, in-class problems, homework problems, and review sections. Teachers fill in and around the textbook. They identify difficulties students have understanding the text and provide clarification, but the textbook is central in math education.
These textbooks don't change over time. It's impossible to tell—even by checking the copyright notice—when any of them were written. For example, the algebra textbook in use at Sidwell when I was there, “Algebra and Trigonometry: Structure and Method” (2004 printing of Brown, Dolciani, Sorgenfrey, & Kane, 2000), showed copyright dates of 2000, 1997, 1994, 1992 and 1990. One of the authors (Dolciani) died in 1985, even before the first edition. In the 1960s, however, she began writing a series of high school textbooks called, “Structure and Method,” so it seems apparent the book I used has roots that go back far beyond 1990. There is a 1973 book with nearly the same title and two of the same authors (Sorgenfrey, Dolciani, & Wooten, 1973).
Also, the textbook I used includes many computer programming assignments, and assumes the use of a programming language called BASIC. In the teacher's edition of this textbook it says, “There are many versions of BASIC. They are similar enough so that, generally, programs in this book run on all machines” (Brown, et al., 2000, p. 80). The book also includes many short programs written in BASIC. Such versions of BASIC were, indeed, common on all early home computers (late 1970s) and remained common into the 1980s but disappeared from use before any of the kids in my class were born. For two decades, at least, none of those programs could readily run on any computer available to any student, yet they remain in the textbook.
There is little difference between popular textbooks and, as the number of textbook publishers dwindles, the choices become even fewer. One of the things they all have in common is that there are more topics and chapters than can possibly be covered in a course. The books are enormous and contain more material than any teacher will even consider undertaking. This contributes to a feeling among math teachers that there is a great deal that
should be covered and, however fast they are moving through the material, they really should be moving faster. The casualty, of course, is
8 Math Education: It Isn't Working
understanding.
Why do book publisher produce such books? It's not a plot to ruin math education. They just want to sell their books to every school system in the country (or at least to Texas, California, and New York). They won't risk leaving out something that is required in any school system today or in the future, so they include every topic from every school system, along with every topic that might find its way into the target course in the future. The result is enormous textbooks, updated as infrequently as possible, that never undergo significant changes, with far more topics than can possibly be covered in the courses for which their use is intended.
Masking Failure
Try to imagine what it's like to teach math. Here's what happens: a newly minted math teacher takes her first job and arrives at her new school. Schools, like all communities, have cultures and K-12 school cultures are quite different from the new teacher's recent one in college, graduate school, or the workplace. Culture shock is a certainty. By the way, 40% - 50% of those who enter teaching (in the U.S.) leave the field within five years (Ingersoll & Smith, 2003), and the first two years of teaching are especially difficult as teachers struggle to find their footing. Learning to manage a classroom, prepare and present lessons, assign and grade homework, and write tests are all challenging, but it is grading tests that requires math teachers to overhaul their thinking about teaching and shoves them down a harmful (for students) path from which there is no return.
Two weeks into the term, the new math teacher will give a test, take it home, and grade it. The result is always the same: the new teacher can't believe how poorly her students did. But there's something very odd about the grades too. For new teachers, the distribution of grades never looks like the expected “bell” curve,
Figure 1.1
where the most student scores are clustered around some average score, with fewer-and-fewer scores farther-and-farther away from that average. It always looks like this:
N um be r of S tu de nt s Score
The 4 Pillars Upon Which the Failure of Math Ed. Rests 9
Figure 1.2
with a small cluster of high scores and a large cluster of low scores. Oh, and the cluster of low ones is below the passing grade for the department. That is, a huge number of students fail the new teacher's first exam.
So, two weeks into a new career, while the new teacher is experiencing enormous stress and culture shock on many levels, still trying to figure out where to get classroom supplies and find the bathrooms, she discovers the dirty little secret of math education: half the kids have absolutely no idea what they are doing in math. Obviously, this is not the fault of the new teacher; she's only been with these kids for two weeks, and every term begins with a period of review. Whatever knowledge and understandings the kids lack, they lacked when school ended last spring, before the new teacher actually entered the profession.
What does the new teacher do with the test grades? Well, she certainly won't write them in red ink atop the tests and hand them back. What would happen if she did? The kids who failed would blanch at the sight of their grades. Next, they would look around to find out how their friends did. Not the few who are good at math but the many, like themselves, who have absolutely no idea what they are doing in math. Quickly, they would discover a trend: all the kids who have absolutely no idea what they are doing in math failed the exam. How can that be? It's never happened before. If half the kids fail a test there must be something wrong with the test, right?
They'll go home and tell their parents that it's not their fault they failed the test; it was too hard. They'll point out that half the kids in the class failed, and that can't happen on a fair test. There must be something wrong with the new and inexperienced teacher. If this is a “good” school (i.e. affluent families) the parents will call or e-mail the teacher, the department head, the principal, or all three and demand to know why half the kids failed the test. There are three possible outcomes:
1. a fair and careful analysis of the test and the curricula from previous years could be performed. The results would surely show that the test was fine, and half the students failed because they have absolutely no idea what they are doing in math
2. the teacher could be humiliated and made to change the grades Score N um be r of S tu de nt s
10 Math Education: It Isn't Working
3. the grades could stand and the teacher “mentored” to learn how to write an exam that produces a “bell” shaped grade distribution with a suitable average
The first choice is simply off the table. Were it officially recognized that half the kids in this class have absolutely no idea what they are doing in math then an unavoidable question must arise: “How could all of those kids who have absolutely no idea what they are doing in math have passed their math classes of last year?”
The dirty little secret of math education would be out in the open, and shame would shift from students who have absolutely no idea what they are doing in math to math teachers and the charade of math education.
Choosing between (2) and (3) is a matter of administrative style. In either case, the teacher must learn how to write a test that won't make the phones ring. It takes a little thought, but once you figure it out (or someone shows you) it's not hard to do; more than 200,000 K-12 math teachers across the country do it every week or two.
As already stated, the teacher won't hand out the grades the kids actually scored on the test. No other K-12 teacher in the school (or state or nation) is failing half her students. Even with only two weeks of immersion in this new culture she'll know that if she is failing half her kids nobody is going to throw her a life preserver. She won't just lose her job, she'll need to find a new career. Instead, she will decide to “curve” the test. No matter that the bimodal distribution doesn't curve easily, she will find a way. She already has enough problems juggling classroom management, lesson preparation, the relentless and mind-numbing grading of utterly trivial math homework, and coming to grips with the hideous reality that half of her students have absolutely no idea what they are doing in math. Her test scores will be lower than the average in her department for a while, but the kids who have absolutely no idea what they are doing in math will be safely warehoused for another year of math education.
The Bar is Never Set
Setting a bar is a risky business if you have a stake in the outcome. In track and field competitions the high jump and the pole vault are fun to watch. The bar gets set and reset, higher and higher, until all of the contestants fail. The officials have no stake in the outcome. Their only interest is in accuracy of measure and equal treatment for all. Whether it's a high school event or the Olympics there is no shame. The levels of achievement are different, but all good effort is cheered, and the bar gets set out in the open for everyone to see. Without an accurate and honest bar there can be no measure of achievement.
We've already seen that there is enormous pressure on teachers not to set the bar but rather to move it wherever it needs to be to hide the reality that
The 4 Pillars Upon Which the Failure of Math Ed. Rests 11
half of the kids have absolutely no idea what they are doing in math. There are two widely used approaches to manipulating the bar. Both are interesting and neither admits to moving it. The passing grade remains constant, say 70. Not 70% or 70 correct, or 70 of any other unit. Just 70. Let's look at each approach to manipulating the testing bar.
Along the way, let's suppose high jump became a required course in school, and the “passing grade” for high jump is 72. Without a lot of training and natural ability it's absolutely impossible to jump over a 72 inch bar. As we look at the techniques for manipulating the testing bar, let's also imagine an analogy in high jump.
The first approach is the one we saw the new teacher use. She curved the test, giving kids points, as necessary, simply to raise nominal scores. Couldn't be easier. Almost every student scores 75 or more (passes) by being given 50, 60, or 70. It's like digging a 3', 4', or 5' trench for the high jump bar-stands to rest in, so the bar remains 6' above the base of the stands, but only 3, 2, or 1 foot above the ground. If digging a trench is too much work, the same result can be achieved with a ladder: let the high jumper stand on a 5' ladder to leap over a 6' bar.
The second approach is much newer and hasn't found its way into the classroom yet. It is, however, becoming popular at the city and state levels. New York State uses this technique in scoring their Regents examinations. Public schools in New York cannot award an unconditional high school diploma to any student who scores less than 65 on any of the Regents exams. Once upon a time, scoring 65 meant earning 65% of the possible points on the exam. Not anymore.
The approach used by the New York State Education Department [NYSED] was to change the calculation and also the meaning, of 65. Presently, there are 87 possible points on the Integrated Algebra Regents exam, so the “raw” score can range from 0 to 87 (with no fractional points). Raw scores are used to calculate “final examination scores” using a table with 88 rows of two columns, where the left column contains each possible raw score (0 – 87) and the right column contains the corresponding final exam scores (NYSED, n.d.).
There's nothing wrong with that except that the “translation” from raw to final scores isn't even close to honest (linear). That is, the 87 raw points don't get spread out evenly onto 100 final points (with 1.15 “final score” points for each “raw” point). As you can see (linear translation in Diagram 1.3, actual Regents translation in Diagram 1.4) low raw scores get a big boost, and a very broad swath of scores (54 - 75) get squeezed into final scores in the 80s (to achieve an appealing distribution). Using this technique, but without moving the bar from 65, a mere 30 raw points wins a brass ring. Earning 34.5% of possible points is enough to pass with a 65. Keep in mind that on a multiple-choice test, with four choices per question, one should expect a strategy of pure guessing to earn 25% of possible points for a final score of 59.
12 Math Education: It Isn't Working
Diagram 1.3 Diagram 1.4 Linear “Honest” Translation (2010) Actual Translation (2010)
What's the high jump equivalent? Let's set the bar at 72. Not enough students will clear this bar so here's the trick: get rid of the bar stands with 100 marks spaced 1 inch apart, and replace them with bar stands that have 100 marks spaced ¼ inch apart. Just make sure you still set the bar at 72. Now anyone who can jump 18 inches can score a 72.
Also, please note that the values for the Regents translation table aren't set until after students take the exams and all the raw scores have been calculated. In New York State they don't set the bar and then wait to see how the students do, they wait until after they see exactly how the students did and then set the bar.
How does New York State's adjustment of the Regents bar affect the passage rate? Complete data is available for 2008: the table used to translate raw scores into final ones and raw score distributions (NYSED 2008; NYSED, n.d.). In 2008, 73% of students passed the Integrated Algebra Regents exam. That is, 73% of students were able to earn at least 34.5% (30 points) of the 87 possible points. If students actually needed to earn 65% of possible points (a raw score of 57) then only 27% of students would have passed the 2008 Regents exam in Integrated Algebra.
Delusion
Nobody likes bad news. Occasional bad news is bad enough. Repeated, endless bad news is a different matter. It makes people and whole communities delusional. When we find daily life so randomly dangerous or find ourselves forced to act in ways that directly make others uncomfortable or unhappy, and not even for their own good, our minds come to the rescue by putting reason to sleep and letting us create, accept and share delusions. The delusions let us fool ourselves into believing the terrible thing before us is actually normal.
The 4 Pillars Upon Which the Failure of Math Ed. Rests 13
There can be no doubt that in the U.S. we are delusional about math education. We have a system that doesn't do what it is intended to do. It produces outcomes in the bottom quartile among our peer nations. But that's just evidence of failure not delusion. To see and understand the nature, causes, and scale of our delusions we should look at how we have responded to alarms, sounding for decades, about the decline in our quality of education. Let's start is 1983.
A Nation at Risk
In 1983, the National Commission on Excellence in Education (NCEE) produced a report entitled: A Nation at Risk: The Imperative for Educational Reform (NCEE, 1983). It begins:
Our Nation is at risk... We report to the American people that while we can take justifiable pride in what our schools and colleges have historically accomplished and contributed to the United States and the well-being of its people, the educational foundations of our society are presently being eroded by a rising tide of mediocrity that threatens our very future as a Nation and a people.
The second paragraph begins with this well-known call to action:
If an unfriendly foreign power had attempted to impose on America the mediocre educational performance that exists today, we might well have viewed it as an act of war. We have, in effect, been committing an act of unthinking, unilateral educational disarmament.
This was shocking stuff. No matter whether one agreed with the recommendations of the report or not, the bold, sweeping language attracted enormous public attention. Almost 30 years later, nobody can say that things have gotten better (at least not honestly and with a straight face). A much stronger case can be made that things have gotten worse.
No Child Left Behind
In the decades after A Nation at Risk the news about education remained bad. When all news is bad news, it is human nature to become delusional, tune it out, and then ignore it—exactly as we did. We would be ignoring it still but for the election of George W. Bush. Only days after his inauguration, on January 23, 2001, he set forth an educational agenda which he called No Child Left Behind (NCLB).
When he presented his new plan, he said his focus would be on, “making sure that every child is educated... [and that] no child will be left behind—not one single child” (Ravitch, 2010, p. 94). Such rhetoric is fine and well, but the NCLB legislation included an accountability plan that
14 Math Education: It Isn't Working
requires all states to achieve math and reading proficiency in 100% of their public school students by 2013-2014.
Does 100% seem like a nice goal? Sure. Does it seem realistic or even possible? Isn't this exactly the same as setting a goal of 100% tax compliance for the IRS? Or setting a goal of eliminating 100% of all water and air pollution for the EPA? Or requiring police to prevent 100% of all crimes, fire departments to save 100% of lives and property, prisons to rehabilitate 100% of all inmates, or politicians to solve 100% of all societal problems? Okay, so the requirement is preposterous and no similarly impossible requirement has ever been set for any other institution. What about consequences? If it's a law without teeth then the requirement will be both impossible to achieve and also ignored. But this law has fangs 10 feet long.
NCLB requires annual testing in math and reading (grades three to eight). Evaluation of student performance and progress is measured only by the scores on these math and reading tests. Teachers, schools, school districts, and states are also evaluated only using these test scores. In addition to the 2013-2014 goal of 100% proficiency, schools must make
Adequate Yearly Progress (AYP). That is, if they have not yet achieved 100% proficiency they must improve according to their AYP goals every single year. Schools that don't meet their goals can be closed. Teachers whose students are not performing adequately are presumed to be responsible for these failures and risk humiliation (as when they are identified in newspapers as failing teachers) and even losing their jobs.
Each state sets AYP goals for its own schools. Since they realize that 100% proficiency is unattainable, they tend to set very low and (possibly) achievable AYP targets for the early years and leave enormous AYP goals for the last years. This postpones the day of reckoning (and keeps their schools open).
It's important to note that NCLB sets no national standard and leaves all testing and standards to the states. A national plan with no national standard? Wow! So, each state gets to make its own test, set its own standard, and manipulate its own bar using the techniques already described or others. NCLB provides strong incentives for exactly the behaviors now seen on a wide scale:
•narrowing of curricula; dropping (or reducing time on) art, history, science, etc. because AYP depends only on reading and math results •teaching to tests, training students in test-taking techniques, and
taking practice exams
•schools that are able (e.g. charter schools) turn away, suspend for exam days, or expel the students they fear will not pass the tests (Ravitch, 2010, pp. 134, 156)
•school districts and states adjust and readjust their bars to show their progress toward 100% proficiency
The 4 Pillars Upon Which the Failure of Math Ed. Rests 15
Also, there is now cheating of a type and on a scale that has never been seen before. Now it's not students who cheat, it's the adults. Far beyond teaching to the test, there are many verified reports of teachers preparing students for their high-stakes tests by quizzing students using actual test questions and sometimes giving complete sets of test answers to students. There are also many verified reports—in California, Georgia, Illinois, Indiana, Maryland, Massachusetts, Michigan, New Jersey, New York, Nevada, Texas, and Virginia—of modifying exams after students take them: filling in the correct answer on unanswered questions and erasing wrong answer to fill in correct ones (Asimov, 2007; Fessenden, 2007; Gabriel, 2010; Judd & Vogell, 2011; Wilgoren, 2001).
Go to the Internet and visit the web site of your state's Department of Education. If you poke around a bit, you'll be able to find aggregated test results for your state and probably even results for individual schools.
Is the Progress Real?
No. In every case during the last decade where an educational “miracle” was claimed, a careful look has revealed that the miraculous gains were entirely the result of nothing more or less than manipulating the testing bar. We've already seen how New York State manipulates the bar for the Regents exam.
President Bush's NCLB plan was based on the supposed success in Texas (under his governorship) that testing and accountability provided. Later analysis revealed that the soaring test scores were directly attributable to a soaring dropout rate (Klein, Hamilton, McCaffrey and Stecher, 2000); the worst-performing students dropped out, didn't take the tests, and didn't weight down the test score average. Also, while high-stakes test scores were showing great gains in Texas, other standardized tests showed no gains (SAT scores, National Assessment of Educational Progress scores, the Texas state test for college readiness).
In 2009, New York City announced, based on improvements in test scores, that 84% of all elementary and middle schools had achieved a school rating of A. Only a year earlier just 38% had an A rating. In 2009, more than 97% of schools had ratings of A or B. These claims were so absurd they were ridiculed in the city's local newspapers, and it quickly came out that New York City was manipulating the bar (“Stupid,” 2009).
In Chicago, school officials (including their superintendent who is now our national Secretary of Education) claimed that from 2004 to 2008, the portion of eighth-graders meeting the state standards in math had risen from 33% to 70%. A 2009 study revealed that the gains reflected only changes to tests and testing procedures and did not reflect any student improvement (Civic Committee of The Commercial Club of Chicago, 2009).
None of this should be surprising. The amazing test gains in Texas and Chicago have been called “miracles.” If there were, in fact, any real
16 Math Education: It Isn't Working
improvement in educational outcomes it would be truly miraculous— without any earthly explanation. What has changed since NCLB? The buildings are the same, the yearly and daily schedules are the same, the students and parents are the same, the textbooks are the same, the teachers and administrators are the same, and the curricula are the same. We have more charter schools now, but the evidence is overwhelming that, on average, charter school performance is significantly (in the statistical sense) worse than that of traditional public schools1. The only things that have
actually changed are the manipulation of the bar and a lot of wishing, hoping, and threats to fire teachers and close schools. These threats imply that if teachers will just try harder—while teaching the same students, using the same pedagogy, books, schedule, and methods—the problems of education will disappear.
National Assessment of Educational Progress
Presently, each of our 50 states (and the District of Columbia) gets to design its own tests, score them as they wish, and change the scoring as they please. Every such test should be disqualified from any consideration in evaluating educational success, yet these tests are used as the sole
measure of each state's educational success. Is there no alternative? Of course there is.
There is an important nationwide test of student achievement called the National Assessment of Educational Progress (NAEP). From the web site of the National Center for Educational Statistics (NCES-a, n.d.):
The National Assessment of Educational Progress (NAEP) is the largest nationally representative and continuing assessment of what America's students know and can do in various subject areas. Assessments are conducted periodically in mathematics, reading, science, writing, the arts, civics, economics, geography, and U.S. history.
Since NAEP assessments are administered uniformly using the same sets of test booklets across the nation, NAEP results serve as a common metric for all states and selected urban districts. The assessment stays essentially the same from year to year, with only carefully documented changes. This permits NAEP to provide a clear picture of student academic progress over time.
From the same web page:
1 a large, well-conducted 2009 study of 2,043 charter schools in 15 states (and D.C.) by the Center for Research on Education Outcomes (2009) found that for every charter school performing significantly better than the local public school there were two performing significantly worse. The lead researcher concluded, “This study reveals in unmistakable terms that, in the aggregate, charter students are not faring as well as their TPS (traditional public school) counterparts.”
The 4 Pillars Upon Which the Failure of Math Ed. Rests 17
The National Assessment Governing Board, appointed by the Secretary of Education but independent of the Department, sets policy for NAEP and is responsible for developing the framework and test specifications that serve as the blueprint for the assessments. The Governing Board is a bipartisan group whose members include governors, state legislators, local and state school officials, educators, business representatives, and members of the general public.
NAEP assesses students in grades four, eight and twelve.
NCES, part of the U.S. Department of Education, is responsible for carrying out the NAEP project. It is highly regarded for its excellence of testing and statistical methods and its non-partisanship. NCES has been conducting the NAEP since 1969 and provides NAEP data in multiple dimensions to help researchers and the public see differences between various groups of students and changes and trends over time. It aggregates data in many ways, including by state. It works for the public, and all of its work is freely available.
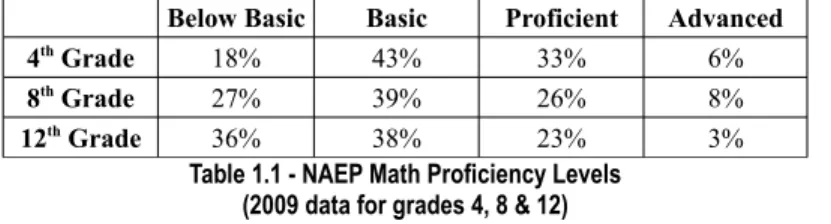
The term “proficiency” is widely used in testing. State after state is claiming ever increasing levels of student proficiency in accord with their AYP plans and the requirements of NCLB. The NAEP assessments recognize three levels of achievement (NAEP, 2009):
Advanced represents superior performance
Proficient represents solid academic performance. Students reaching this level have demonstrated competency over challenging subject matter
Basic denotes partial mastery of prerequisite knowledge and skills that are fundamental for proficient work at each grade.
NAEP Achievement Categories
Here are 2009 NAEP results for public school students (NAEP-b, n.d.): Below Basic Basic Proficient Advanced
4th Grade 18% 43% 33% 6%
8th Grade 27% 39% 26% 8%
12th Grade 36% 38% 23% 3%
Table 1.1 - NAEP Math Proficiency Levels (2009 data for grades 4, 8 & 12)
It seems the longer we subject children to math education the less proficient they become. The results go from bad to worse to dreadful as the mathematics becomes increasingly abstract.
The trend in NAEP math scores has been very slowly and slightly upward over a long period, though the rate of increase has declined during the period of NCLB (NAEP-c, 2009).
(S-O-18 Math Education: It Isn't Working
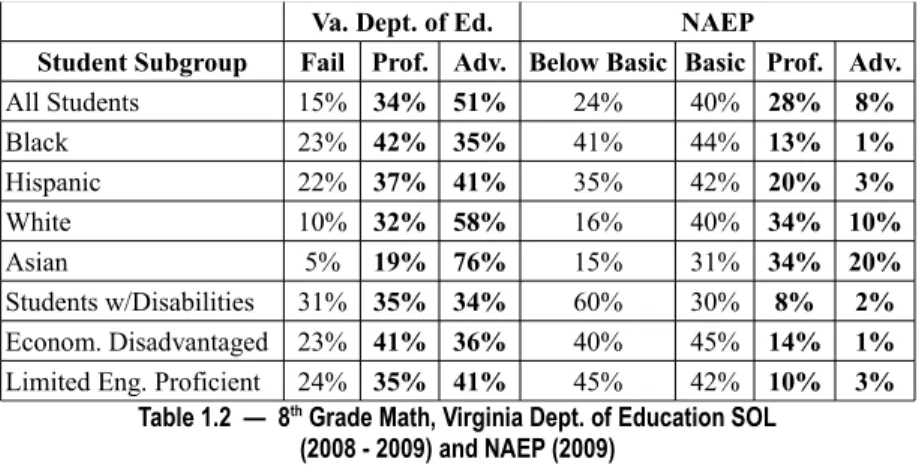
L) curricular guidelines and tests. Below are the results for Virginia's 8th
graders for 2008 – 2009, alongside 8th grade NAEP results for Virginia for
the same year (NAEP-b, n.d.; Virginia Department of Education, n.d.):
Va. Dept. of Ed. NAEP
Student Subgroup Fail Prof. Adv. Below Basic Basic Prof. Adv.
All Students 15% 34% 51% 24% 40% 28% 8% Black 23% 42% 35% 41% 44% 13% 1% Hispanic 22% 37% 41% 35% 42% 20% 3% White 10% 32% 58% 16% 40% 34% 10% Asian 5% 19% 76% 15% 31% 34% 20% Students w/Disabilities 31% 35% 34% 60% 30% 8% 2% Econom. Disadvantaged 23% 41% 36% 40% 45% 14% 1%
Limited Eng. Proficient 24% 35% 41% 45% 42% 10% 3%
Table 1.2 — 8th Grade Math, Virginia Dept. of Education SOL (2008 - 2009) and NAEP (2009)
According to the bar used in Virginia, 7/8 of 8th grade student are at least
proficient and more than 1/2 are advanced. What a pretty picture! Using the NAEP bar, however, only 1/3 are at least proficient and less than 1/12 are
advanced. In Virginia we hear so much about S-O-Ls, but, long before they coined the term and borrowed the acronym, S-O-L was commonly used to mean, “[plumb] Outta Luck.” That's what I think of every time I hear S-O-L and think of the kids wasting enormous amounts of their school time preparing for and taking these educationally useless tests.
I certainly don't mean to pick on my own state of Virginia. Here is a sampling of math proficiency claims from other states (Arizona Department of Education, n.d.; California Department of Education, n.d.; Massachusetts Department of Elementary and Secondary Education, n.d.; Minnesota Department of Education, n.d.; Mississippi Department of Education., n.d.; Texas Education Agency, n.d.; Virginia Department of Education, n.d.):
Students at least Proficient
State NAEP Assessment Self Assessment Overstatement
Arizona 29% 63% 117% California 23% 40% 74% Massachusetts 52% 60% 15% Minnesota 47% 58% 23% Mississippi 15% 54% 260% Texas 36% 79% 119% Virginia 36% 85% 136%
Table 1.3 - State Self-Assessments vs. NAEP Assessments Grade 8 Math (2008 – 2009 State Data, 2009 NAEP data)
The 4 Pillars Upon Which the Failure of Math Ed. Rests 19
Clearly, we in Virginia overstate our performance very well, but we'll have to get up even earlier in the morning to outdo Mississippi. Only Massachusetts (the nation's highest performer on NAEP) makes a claim even close to its NAEP performance.
No Child Left Behind Cannot Work
The architects of NCLB brought a pure market mentality to the Department of Education that remains to this day. They paid no attention to, cared not a whit about, the two fundamental questions of education: what to teach and how to teach it. Instead, they look only at nearly meaningless state test score numbers, and AYP numbers, and the numbers they can construct from those numbers. They study, compare and construct their numbers while they wait for the “magic of the market” to magically improve educational outcomes. This wait will never end.
The forces of competitive, free markets are incredibly powerful motivators for the creation and refinement of certain kinds of goods and services. Those same forces are perfectly powerless to prompt the creation and delivery of other kinds of goods and services. Where,
•goods or services are commodities
•many substitutable alternatives are available •quality is easily and accurately measurable
•relevant information is readily and cheaply available
markets work their magic. Consumer electronics, restaurants, automobiles, communication technologies, haircuts, superstores of all variety, and traditional commodities like grain are all examples of goods and services that are produced or delivered very efficiently and at low prices by the magic of the market.
There is another class of goods and service, ones economists call public goods, which competitive, free markets always supply in too small quantities or not at all. These are goods like national defense, lighthouses, parks, roadways, bridges, justice systems, fire and police departments, clean air and water, and, of course, public schools. The classic example of a public good is a lighthouse. Once a lighthouse gets built, every passing ship receives its full benefit. That is, the important characteristic of a lighthouse, light, is not consumed or diminished by its users. Any quantity of other people can see the light from the lighthouse without reducing its visibility to any other.
Free markets fail to produce public goods because people tend to understate the extent to which they value them. If an entrepreneur thought to build a lighthouse, he would begin by contacting the ship owners likely to benefit. He would ask each of them how much they will pay toward the construction of a lighthouse. It seems to be human nature to understate the
20 Math Education: It Isn't Working
actual worth because, once the lighthouse gets built, even those who paid nothing will be able to see the light (and receive the full benefit). The typical result is that not enough funds are offered. This explains why lighthouses don't get built by entrepreneurs.
In the case of national defense, another public good, there is no way to defend only the people willing to pay, as nobody is prepared to tell our enemies they may freely attack the citizens who refuse to pay. Similarly, as a practical matter, fire and police protection must be provided to a whole region, not just to those within the region who are willing to pay.
Free markets don't produce (or significantly under produce) public goods. This is widely recognized by economists as a “market failure.” A fundamental role of governments is to finance and provide important public goods that will otherwise inadequately provide.
No free market in the history of the world ever produced anything like K-12 public schools. It is governments, around the world, that build and finance public schools. The idea that market forces can be used to rescue public schools is nutty. Even the need for public schools is invisible to market forces. The four elements that are necessary for free markets to work their magic do not—and will not—exist for public schools,
First, K-12 education is not a commodity. We divide it up into annual grades but that's entirely artificial. Until high school, at least, children don't decide what to study, who will teach them, what quantities of which subjects (products?) they will consume, or much of anything else. School is a place children go and have experiences. Public school education is no more a commodity than sleep or conversation are commodities.
Second, what about choice? Those who can afford to send their children to private schools, arguably, have choices. Those who can't, don't. But let's be clear about the nature of school choice. School is not a uniform experience for all of the children in attendance. If a child is being bullied, it is a terrible experience whether the school is public or private, “good” or “bad.” When a student is lucky enough to get a good teacher, with whom he also has good chemistry, it also doesn't matter if the school is public, private, charter or parochial. Even within a school, there is no child who doesn't have better experiences some years than others, and the swings from year to year are frequently enormous. There is, generally, more variation within schools than between them. There is remarkably little meaningful choice.
Third, is school quality readily measurable? Just for a moment, put aside all conventional wisdom and consider how you would evaluate the quality of educational services a public school provides, if you were starting from scratch. Would you rate the quality of a school, or the quality of the education your child receives at that school, only by analyzing the results of a single multiple-choice test in math each year and another in reading? Even if those tests were well-constructed and administered, with no manipulation of the bar, it would be irresponsible to evaluate students, teachers,
The 4 Pillars Upon Which the Failure of Math Ed. Rests 21
administrators and schools on nothing more. If we really want to know how good a school is, don't we have to look at more than math and reading? Shouldn't we follow its students and see how they do after they graduate? Wouldn't we want to try and discover the lasting impacts, negative and positive, that the school has on its students, their families, and the community? I'm not saying any of this is easy. Perhaps it isn't all possible. But what kind of fool would look at nothing more than a pair of half-baked, highly manipulated, multiple-choice tests and claim to be able to assess student learning, teacher effectiveness, and school quality?
Fourth, there is no easy access to relevant information. In the case of commodities like consumer electronics, relevant information includes product features, specifications, price, durability, suitability for specific applications, and the like. A school is bigger, more complex, and more highly-faceted than a flat screen television or a digital camera. Also, when purchasing a tangible product, one usually understands one's own needs. This is generally not so with education. Even well-educated parents tend to know remarkably little about education. So, relevant information about public schools is hard to obtain, and most parents don't even know what information is relevant. Also, when little or no choice is available, relevant information is less valuable because it is not very useful.
Public school education, just like other public goods, is not produced by market forces. Charter schools, initially envisioned for a different purpose, have been put to use as part of a misguided attempt to manufacture a market force, an attempt to inject competition where little or none exists. We have already seen that, on average, they perform somewhat worse than traditional public schools (TPS), with two charter schools performing significantly worse than their corresponding TPS for each one performing better.
Market forces, so powerful under the right circumstances, are powerless in the domain of public goods. Relying on the magic of the market to reshape public education is like relying on magnets, no matter how powerful, to move wood.
Race to the Top (more of the same)
Barack Obama's contribution to educational improvement is called Race to the Top (RttT). It was announced on July 24, 2009, and it is cut from exactly the same cloth as NCLB. What RttT adds to NCLB are incentives to encourage states to move even further in the directions of high-stakes testing and charter schools. Also, while NCLB ignored all matters of what to teach and how to teach it, RttT calls for developing elements that could emerge as approximations of national curricula in math and reading, the
Common Core State Standards (CCSS-a, n.d.) and provides incentives for states to adopt them.
RttT is a $4.35 billion multi-year program in a country that spends about $600 billion annually on K-12 public education (USCB, 2011, p. xi). How
22 Math Education: It Isn't Working
can such a (relatively) small program produce more than just a ripple in the waters of public school education? RttT leverages its modest funds by allowing states to submit proposals; if states want RttT dollars they must compete for them. Proposals are scored and the states with the highest-scoring proposals win funding. Proposals earn points by aligning state laws and policies with federal goals and guidelines. The competition for RttT dollars achieves funding leverage by prompting states to make changes
before they find out if their proposals will be funded. RttT enjoys the additional leverage of economic desperation, by offering cash to states during the worst economic times since the Great Depression.
RttT has been effecting change: states with laws limiting the number of charter schools are ineligible for RttT funding, as are states which prohibit using high-stakes student test results for evaluating teachers and principals. The lure of RttT funding has induced states with such laws to eliminate them (Dillon, 2010).
Is this leverage a good thing? The answer must depend on the wisdom and efficacy of the policies and practices RttT promotes. RttT funding promotes charter schools. RttT has also induced 42 states (plus U.S. Virgin Islands and District of Columbia) to adopt the Common Core State Standards (CCSS-b, n.d.), even though the Standards are not yet fully specified. This underscores the likelihood that states will have considerable latitude in how they interpret them. There is not even a suggestion that states will be held accountable for their implementations of the Standards because the federal Elementary and Secondary Education Act (ESEA, n.d.), of 1965, explicitly prohibits the establishment of a national curriculum. The very name of these standards, Common Core State Standards, raises doubt about them being any more than federal suggestions. It seems likely that standards, like high-stakes testing, will be left to the states.
RttT provides strong support for the use of high-stakes student tests to evaluate teachers and principals. This is being done using a statistical approach called value-added modeling (VAM) or value-added assessment. VAM starts from the premise that the year-to-year change in each student's scores on her high-stakes tests depends principally on the quality of the teachers who have taught that student. Whether a student earns a high score or a low one isn’t the central concern. What matters is whether a student's percentile ranking increases or decreases from one high-stakes test to the next and by how much. It is this change for which teachers are assumed to be individually responsible. This change is the “value-added” by the teacher. The underlying belief is that the purpose of teaching is to raise high-stakes test scores, and that the quality of teaching is captured entirely in individual students' year-to-year scores on these tests. VAM folks are a bit vague about how to measure the quality of teachers who don't teach math or reading (high-stakes testing is only required in math and reading), but there are much bigger concerns.