VALUE STREAM ANALYSIS OF CONSTRUCTION
SUPPLY CHAINS: CASE STUDY ON PIPE
SUPPORTS USED IN POWER PLANTS
Roberto J. Arbulu1 and Iris D. Tommelein2
ABSTRACT
Waste is omnipresent in construction supply chains. It often occurs at the interface between processes, disciplines, or organizations. To illustrate several causes of waste, this paper focuses on a case study that documents the most common configuration of the supply chain for pipe supports used in the power plant industry. Using value-stream mapping across organizational boundaries, this paper illustrates how work flows throughout the design, procurement, and fabrication phases of pipe supports. Industry data obtained through tens of interviews helps to evaluate value-added and non-value-added times, batch sizes, and lead times for this particular supply chain configuration. The paper provides considerations for eliminating waste in order to reduce the total delivery lead time of pipe supports and thereby improve supply chain performance. It concludes by summarizing the case study findings and identifying additional research opportunities to achieve further improvement.
KEY WORDS
Supply chain management, construction supply chain, waste, value-stream mapping, value-added time, non-value-added time, lead time, batch size, multi-tasking, pipe support, power plant.
1 Master of Engineering, Construction Engineering and Management Program, Civil and Environmental
Engineering Department, University of California, Berkeley, USA, [email protected]
2 Professor, Construction Engineering and Management Program, Civil and Environmental Engineering
Department, 215-A McLaughlin Hall, University of California, Berkeley, CA 94720-1712, TEL: 510/643-8678, FAX: 510/643-8919, [email protected]
INTRODUCTION
Construction supply chains are networks of interrelated processes designed to satisfy end-customer needs. Many supply chains have been established for a multitude of commercial and practical reasons, resulting in a whole that is far from optimal. The problem is that individual processes in-and-by themselves, but also the handoffs between processes, disciplines, and organizations, all are subject to effects of dependence and variation (e.g., Crichton 1966) which may cause waste in the system. Elimination of this waste will contribute to improving supply chain performance. Doing so also is an objective of lean construction, which advocates the systematic eradication of waste and the promotion of flow for value creation throughout so-called ‘value streams.’
To illustrate the presence of waste in a construction supply chain, this paper focuses on a case study based on pipe supports used in power plants. The goal of the case study was to document value added and non-value-added times along this supply chain as well as to identify possible causes of waste. Identification and qualification of waste are starting points for reducing the total lead time required to design, procure, and fabricate made-to-order catalogued and engineered pipe supports. To achieve this goal, this paper details and analyzes the supply-chain configuration that is most commonly used to deliver pipe supports to power plant projects. This configuration reflects the engineering firm in charge of designing pipe supports, and the supplier in charge of detailing and fabricating pipe supports. Arbulu and Tommelein (2002) compare and contrast alternative configurations of this supply chain in a companion IGLC-10 paper.
This paper reviews the concept of waste and its application to construction supply chains. It uses value stream analysis (VSA) as a tool to determine the amount of waste in the supply chain of pipe supports, and then identifies the most relevant causes of waste for this supply chain in particular. It also presents considerations for achieving performance improvement based on a flow perspective rather than an activity-based perspective on the supply chain. Finally, the paper identifies additional research opportunities to achieve further SC performance improvements.
WASTE IN CONSTRUCTION SUPPLY CHAINS
Simply put, waste refers to all efforts that do not add value to the final product from the point of view of the client. Eliminating waste is part of the six flow principles proposed by Lauri Koskela (2000 p. 56): (1) reduce the share of non-value-adding activities (waste), (2) reduce lead time, (3) reduce variability, (4) simplify by minimizing the number of steps, parts, and linkages, (5) increase flexibility, and (6) increase transparency. He also highlights that reducing the share of non-value-adding activities is a fundamental source of improvement. This paper illustrates one example of this.
Taiichi Ohno (1988), an engineer and developer of the Toyota Production System that led John Krafcik to coin the term ‘lean production’ (Womack et al. 1990), identified seven sources of waste related to (1) defects in products, (2) overproduction of goods, (3) excess inventories, (4) unnecessary processing, (5) unnecessary movement of people, (6) unnecessary transport of goods, and (7) waiting time. Later, Womack and Jones (1996) established as an additional source of waste: (8) design of goods and services that fail to meet the user's needs.
Early efforts at identifying waste and its causes focused on achieving in-plant process performance improvements. In order to reap even greater benefits, the manufacturing
industry then moved from an in-plant perspective to a more global view of its supply chains, including not only first-tier but also second- and higher-tier suppliers and customers up and down the chain. Despite best efforts, today’s practices of supply chain management in many industries are still restricted to achieving more optimal performance across only a few tiers of their supply chains and few efforts - if any - span the entire length of any one supply chain. Nevertheless, a more global view of supply chains is gradually being adopted in different economic sectors including the construction industry.
Research studies have shown that waste is omnipresent in construction supply chains (e.g., Vrijhoef and Koskela 2000; Luhtala et al. 1994). It often occurs at the interface between processes, disciplines, or organizations. Eliminating waste in construction supply chains, then, must be a goal for supply chain participants who wish to provide better customer service.
Supply-chain lead time depends on various factors such as the complexity of a product as this affects the time required to make and inspect it. Supply-chain lead times comprise four elements (e.g., Koskela 2000 p. 58): (1) processing time, (2) inspection time, (3) wait time, and (4) move time. One particular contributor to wait time is decision-making time (Arbulu 2002), which may be critical especially when several participants interact, playing different roles for different organizations. Due to the lack of decision making, information may await processing for days or even weeks. Therefore, identifying and eliminating this wait time is essential to compressing lead time.
Benefits of supply-chain lead time compression are (after Koskela 2000 p. 60): (1) faster delivery of the product or service to the customer, (2) reduced need to forecast future demand, (3) less opportunity for disruption in the supply chain due to design changes, (4) greater possibility that participants will interact in a timely fashion with other supply chain participants, (5) easier synchronization of one supply chain with others, and (6) less opportunity for products to become obsolete. It is possible to directly attack the most visible waste just by flowcharting the process, then pinpointing and measuring non-value-added activities (Koskela 1992 p. 18). This is exactly what this paper illustrates through the application of VSA.
VALUE STREAM ANALYSIS (VSA)
After determining what value a product or service has for a customer—which is not easy to do!—the transformation of an organization’s current practices to become more lean will include eliminating waste from the system of interdependent activities and operations that are executed to bring that product or service to market. This set of activities, operations, and associated information make up the value stream. A value stream perspective should look across individual functions, activities, departments, and organizations, and focus on system efficiency rather than local efficiency within any one of these.
Value streams are mapped and analyzed using a tool known as Value Stream Mapping (VSM). VSM was created by practitioners at Toyota to “make sustainable progress in the war against muda” (‘muda’ is the Japanese word for ‘waste’)(Rother and Shook 1998). VSM includes creating a map of the flow of material through production and the flow of information from the customer back to each production process. A current-state map of in-plant value streams then serves as the basis for developing future-state maps that leave out wasted steps while pulling resources through the system and smoothing flow. The difference between the current state and potential future states provides a road map to start the implementation of performance improvements. This paper presents a current state
map and considerations for supply chain performance improvement. The development of potential future state maps was not within the scope of the case study.
Rother and Shook (1996) first choose a product family and then map its current-state value stream before analyzing production data and metrics. In contrast, the maps presented here do not pertain to any single product family. We did not set out to characterize pipe support diversity in this way and we anticipated difficulty in obtaining data for any one pipe support family in particular. Accordingly, the VSA presented here provides approximate durations (obtained from industry practitioners) for each supply chain task. Some tasks contain ranges of durations instead of only one predetermined value. Note that durations shown in Figure 2 do not exactly match those shown in Figure 4. The reason is that data was obtained through several interviews with practitioners, each one having their own mental model of the supply chain, developed based on their experience. The use of more objective data (e.g., measured and written data) in future studies, rather than interview or survey data, should help to alleviate such mismatches.
The scope of many VSMs has been restricted to remain within the boundaries of a single organization. Recent efforts (e.g., Jones and Womack 2002) apply VSM on a macro scale, considering the supply chain upstream and downstream of a specific organization. Adopting such a view is most appropriate in the highly fragmented AEC industry.
CASE STUDY OF PIPE SUPPORTS
SUPPLY CHAIN CONFIGURATION
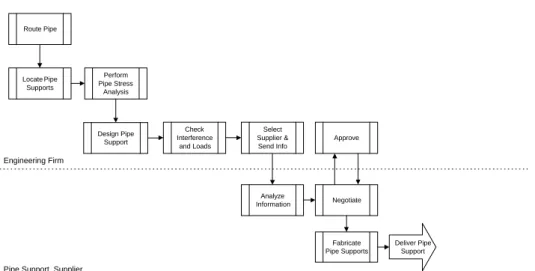
Using VSM, this paper illustrates the flow of work throughout the design, procurement, detailing, and fabrication phases of pipe supports based on the supply chain configuration that is most commonly used in the power plant industry today (Figure 1). This configuration represents the engineering firm in charge of designing pipe supports, and the supplier in charge of detailing and fabricating pipe supports. The presented value stream analysis does not consider the installation of pipe supports on site because we were unable to get project data to support the case study. Based on configuration 1, we analyzed the value stream for the supply chain as a whole and then detailed the fabrication phase.
Engineering Firm
Pipe Support Supplier
Locate Pipe Supports Perform Pipe Stress Analysis Design Pipe Support Check Interference and Loads Analyze Information Select Supplier & Send Info Negotiate Fabricate Pipe Supports Route Pipe Deliver Pipe Support Approve
Figure 1: Supply-Chain Configuration 1 of Pipe Supports (also see configuration 1 compared to others in Arbulu and Tommelein 2002 and in Tommelein and Arbulu 2002)
VALUE STREAM ANALYSIS FOR PIPE SUPPORTS
The analysis presented here focuses on the evaluation of value added and non-value-added times. Figure 2 depicts the value stream each single pipe support follows from design to delivery to the site. It shows a series of linked task boxes with triangles in between. In terms of duration, task boxes represent the time a pipe support will be in process in a conversion task. This time is an upper-bound estimate of value-added time. The triangles represent the time a pipe support waits until it gets processed by the next task. This wait time may have different causes that will be explained later in this paper. Triangles do not have any specific duration. Instead the VSM shows total durations between activities (arrows at the top of the activities). Accordingly, the difference between the total time in the system (sum of times shown on arrows) and the processing time (sum of times shown under each task box) represents the total non-value-added time or waste. Route Pipe Locate Pipe Supports Analyze Pipe Stress Design Pipe Support Check Loads and Interference Reinforce Structure (inc. New Details) Issue Pipe Support Details for Fab Agree on Price (Inc. Budget) Analyze Info from Eng. Firm Select Supplier and Send Info Prepare Pipe Support Drawings
Total Queue Time = Total Processing Time = Total Time in System =
42-52 Duration (hrs) % 96 - 96.5% 4 - 3.5% 100% 2-2.5 m-hrs 0.5 m-hrs 1.8-2.3 m-hrs 0.5-1.0 m-hrs 3.5 m-hrs 3.5- 6 m-hrs 1m-hrs 1- 2 m-hrs 0.4- 0.6 m-hrs 2-5 m-hrs Approve Drawings Fabricate 1-2 m-hrs 0.1- 0.5 m-hrs 24 m-hrs
Total Duration = 28 -37 weeks Hours per week = 40 hrs. Total Time in System = 1120 - 1480 hrs
1120-1480 1078-1428
8 weeks 2- 3 weeks
2- 3 weeks 2 weeks 2 weeks
6- 8 weeks
Supports Ready to Ship
Notes:
1. All durations are per unit of support (m-hrs = man hours). 2. Underlined values have been assumed by researchers.
- The number of man-hours for the activity "Agree on Price" was assumed as 0.1-0.5 m-hrs/support. - The number of man-hours for the activity "Fabricate" was assumed as 24 m-hrs/support. - The number of man-hours for the activity "Deliver" was assumed as 1 m-hrs/support. In all cases, the queue times are so big than these assumptions won't affect the final results.
Deliver Supports On Site 1- 2 weeks 1 week 1- 3 weeks 1 m-hrs 1 week 2- 4 weeks
Activity performed by engineering firm, supplier, engineering firm and supplier jointly.
Figure 2: Value Stream Map – Supply Chain of Pipe Supports
The value-added times were determined using two sources of information: gathering real data from a power plant project and interviewing tens of piping engineers and pipe support designers who were working for engineering firms or suppliers.
The unit of value-added time is a man-hour. Since more than one person may contribute to the completion of each task, the real time needed to perform any one task may differ from the value-added time shown. The total time in the system needs to be understood as the time that a pipe support remains in the system. The unit of time in the system is a week, considering that each week corresponds to 40 hours of work per person.
ANALYSIS RESULTS
The VSA shows that a pipe support takes a total duration ranging from 28 to 37 weeks to flow through the system. One reason for this variation is the diversity and complexity of supports that are covered by the design, detailing, and fabrication phases as shown in
Figure 2. The analysis also reflects that only about 4% of the total time a pipe support needs to flow through the system represents value-added time. This means that only about 1.6 hours out of a 40-hour work week really add value to the final pipe support product. The remaining 96% of the time or 38.4 hours out of a 40-hour work week represent non-value-added time.
CAUSES OF NON-VALUE-ADDED TIME
Causes of waste in this particular supply chain are mainly related to the time resources (information and materials) wait to be processed and the amount of rework in the system. Wait time in part stems from the batching effect. Batching is an important consideration in supply chain performance assessment because bigger batch sizes cause longer wait times and therefore longer lead times. Arbulu (2002) presents a more detailed analysis of the impact of batch sizing on SC lead time. Nayyar (2000) specifies that rework due to support problems may be minimized during the piping layout design phase if designers devote attention to pipe support issues. Good pipe support design begins with good piping design and layout.
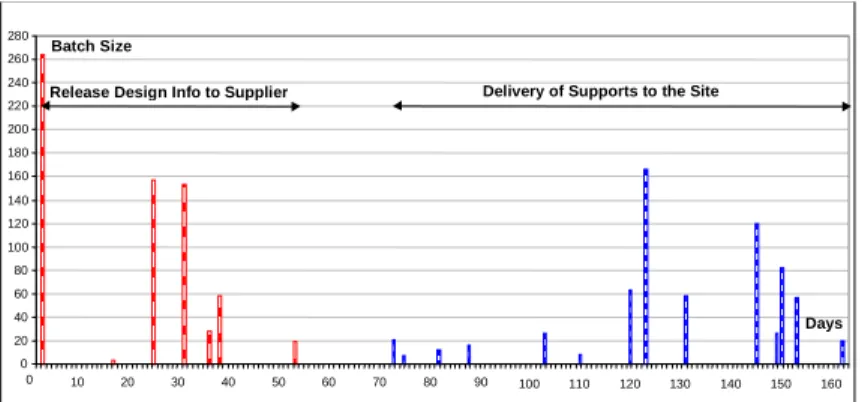
This case study identified several types of batches with different sizes along the supply chain. Figure 3 depicts two of these, namely (1) the release of design information from the engineering firm to the support supplier, and (2) the shipment of completed supports from the support supplier to the site. As shown, some batch sizes on this project were as big as 260 supports. This means that the first support will need to ‘wait’ for the other 259 supports to be processed, until all can be released to the next task.
0 20 40 60 80 100 120 140 160 180 200 220 240 260 280 0 10 20 30 40 50 60 70 80 90 100 110 120 130 140 150 160 Days Batch Size
Release Design Info to Supplier Delivery of Supports to the Site
Figure 3: Example of Batch Size Variation
Another contributor to wait time is the multitasking effect. In reality, piping engineers and designers, depending on the tools they need to perform design activities, have to multitask between two or more design processes that may belong to one or more power plant projects. They do so because not all information or other resources needed to complete a task may be available when they have the time to work on that task. Multitasking enables them to reduce their own idle time, though it does not necessarily increase their efficiency because each switch of tasks comes at a setup cost. Unfortunately, more multitasking means that any one task has a smaller likelihood of being worked on and completed and, consequently, it has to wait longer, which leads to increased lead times. Multitasking, in any case, needs to be controlled by execution priorities. Tasks with a lower execution priority then have to wait longer and thus have a longer lead time.
Finally, rework is due to uncertain data being incorporated in the early design phase of pipe supports or other supply chain phases. Rework due to errors should not be tolerated
as it reduces throughput, the time to make (design, procure, fabricate, and deliver) a pipe support, and it causes unreliable workflow.
FABRICATION PHASE
Rother and Shook (1996) provide a step-by-step process not only to analyze production flow but also to emphasize the use of various lean tools that support the flow of work along different workstations. We have begun to detail the fabrication process of pipe supports but still lack information to provide a detailed map like theirs. Instead, the process that is shown here analyzes value-added and non-value-added times.
Figure 4 depicts the corresponding VSM for the fabrication of pipe supports. The fabrication lead time varies from 2 to 6 weeks. One reason for this variation is, again, the diversity and complexity of supports. The number of man-hours per week considering a three-shift operation is 7 days/week * 24 hours/day, which equals 168. The total number of hours that a support remains in the system until it is delivered to the site thus varies from 336 to 1,008 hrs. Figure 4 shows typical value-added times under each task box: the total value-added time is equal to about 106 hours. This represents between 11% and 31% of the total time that a pipe support remains in the system. It means that only 1-to-3 out of 10 hours of work in the fabrication shop really add value to the final pipe support product.
Cut Start Fab
Roll/Bend Drill Fitup Weld
Assemble and Paint Pack Final Inspection Paint or Galvanize Total Queue Time =
Total Processing Time =
Total Time in System = 336 -1008
% 31 - 11% 100% 231 - 901 69 - 89% 2.5 m-hrs 0.33 m-hrs 1 m-hr 40 m-hrs 40 m-hrs 18 m-hrs 1 m-hr 0.5 m-hrs 2-4 m-hrs Durations1 (hrs)
Total Duration = 2 - 6 weeks Hours per week = 168 hrs. Total Time in System = 336 - 1008 hrs
105 - 107
The Supplier performs the Activity Specialty Contractor may perform the activity.2
Notes: 1. All durations are in man-hours [m-hrs] per unit of support
2. Painting is often done in-house but galvanizing is usually out-sourced to a subcontractor so that, accordingly, pipe supports will need additional transportation, which adds to lead time.
Figure 4: Value Stream Map – Fabrication Phase of Pipe Supports
CONSIDERATIONS FOR SUPPLY CHAIN PERFORMANCE IMPROVEMENT
MINIMIZE BATCH SIZES
The batching effect is a big contributor to lead time. A lean production perspective on any given situation suggests that in the best of circumstances the batch size should be 1, so that the flow is continuous and incurs the least delay. In practice, this ideal situation is hampered by setup times, which force the ‘optimal’ batch (economic lot size) in any one process to be greater than 1. The goal of production system design, then, is to maintain batch sizes as small as reasonable while improving coordination and communication between participants in the supply chain in order to achieve a synchronized flow.
INVOLVE SUPPLIERS EARLY IN DESIGN & DEVELOP SUPPLIER ALLIANCES
Some advantages of bringing the supplier in earlier are: (1) engineers can identify pipe support catalogs early so that no later conversion will be needed and rework (waste) may be avoided, (2) suppliers may advise the engineering firm so they can jointly optimise the design process, (3) suppliers have direct understanding of the fabrication process and their own upstream suppliers, and therefore, can easily tailor catalog designs to best meet design requirements while engineering firms may choose to make due with catalogued hangers because they cannot gauge the cost implication of more custom design, (4) suppliers who gain insight into the project requirements early are able to better manage their own supply chain, e.g., buy materials needed to make supports earlier on, (5) engineers and supplier(s) can integrate and speed up their communication and transactions using Electronic Data Interchange (EDI), (6) engineers can expedite the approval process of shop drawings (pre-approved drawings for fabrication), and (7) engineers and supplier(s) can quickly resolve requests for information (Tommelein and Arbulu 2002).
Alliances or long-term agreements are becoming increasingly common in the pipe support industry. One of their main purposes is to put everyone on the same track and have people work together towards a shared, clearly-defined set of objectives. Carrying alliances a step further, Howell and Ballard (1996) suggested that the implementation of an integrated production planning system from engineering through fabrication and installation might be achievable.
AVOID DESIGN-BID-REDESIGN-BUILD PROCESSES
Sometimes engineering firms work with a particular supplier early in the process to select supports from a catalog. This supplier may not necessarily be the supplier selected later to do fabrication. If the configuration of supports differs from one supplier to another the original designs may need to be adapted. This is a clear example of a design-bid-redesign-build process. This redesign may account for at least 20% of the work performed by pipe support suppliers. This idea also relates to the issue of standardization.
PROMOTE STANDARDIZATION OF PRODUCTS AND PROCESSES
Pipe supports have not been standardized in the power plant industry. This means that detailing cannot be done in full by the engineering firm until a specific supplier (i.e., a specific supplier’s catalog) has been chosen. Some engineering firms try to complete the design anyway and then ask the supplier to re-engineer the design if need be. This practice may add waste in the process. Making supports into commodities has its advantages in terms of ease of sourcing (e.g., assuming they are 100% substitutable thanks to standardization) and also provides benefits in design.
The issue of standardization needs to be understood in relation to both processes and products. In terms of processes, the reality is that each supply-chain participant develops and applies its own procedures for each supply-chain phase to deliver supports. In terms of products, industry-wide standardization of pipe support designs would help designers avoid late changes that may affect the project delivery date.
To standardize, a limited number of configurations must be defined. A number of standardized products that is too large will defeat the purpose of standardization. Industry practitioners suggested that the number of standard supports should not exceed 100 to 150 configurations. A smaller number of configurations may further reduce engineering time though it could come at a cost of possibly over-dimensioning and inferior performance. Standardization also allows engineering firms or suppliers to make fewer mistakes,
avoiding rework. Furthermore, it may ease the training required of new engineers entering the field. Today, many engineers learn how to design pipe supports by experience in practice; it is not a subject commonly taught in schools.
FOSTER COMMUNICATION BETWEEN SUPPLY CHAIN PARTICIPANTS
Improved coordination and communication between the participants in the supply chain is needed to achieve synchronized flow. Unfortunately, the design of pipe supports conventionally occurs in a system with functional stovepiping, dividing disciplines in structural engineering, piping design, mechanical engineering, and process design. The barriers to improved supply chain performance within a functionally organized company may be as large a - if not larger - than those between the company and 3rd parties.
A common difficulty engineering firms face is achieving effective communication between different disciplines or departments in house. For example, it is essential for the purchasing department that issues purchase orders and the engineering department that works with suppliers to work together. Industry practitioners mentioned to us that about 15% of engineering designs have ‘mistakes.’ These may be related to the deficiency (in terms of timeliness and detail) of information released to suppliers.
To avoid mistakes, the industry is developing new tools to improve processes in the supply chain. The introduction of computer software for sizing pipe supports is one example. Unfortunately, the products available in the market today do not allow users to fully design all kinds of pipe supports. Many firms provide a table of catalogued items with pictorial references but this software is not necessarily integrated into computer-aided design software. These packages may list materials required to build each supplier-standardized support and list prices. Also, users may have a graphical representation of the supports. Some programs are more sophisticated and include detailed designs of standard or engineered supports using 2D or 3D modeling.
IMPROVE SUPPLIER SELECTION
O’Connor and Liao (1996) suggested enhancing the pipe supplier selection process to reduce inefficiencies pertaining to the engineering development process of piping systems. This suggestion equally applies to pipe supports and complements the idea of involving suppliers early in design. In the case of pipe supports, some owners have formed (pre-project) agreements with support suppliers and make engineering firms use those agreements. While there are advantages to doing so, those agreements do not necessarily serve their projects in the best way. Supplier performance depends not only on the products provided (and the degree to which these can be standardized across projects to ease operations and maintenance by the owner) but also on their capacity at the time a project comes through, and on the ability and willingness of all involved to work closely together to meet the overall project needs.
When the owner selects a support supplier, that supplier must be agreeable to engage in direct communication with the engineering firm and construction contractor in order to provide effective handoffs of information. Current practices show that some owners procure supports but have engineering firms review the support details. The supplier’s fabrication drawings may then have to go back to the owner for contractual reasons, but thereby miss getting a timely review by the engineering firm. Owners who ask engineering firms late in the process to review the fabrication drawings, may find that this task does not fit on the engineering firm’s schedule. In general, engineering firms appear to prefer to manage this drawing review process themselves.
The late 1980s and early 1990s saw a lot of outsourcing by owners, whereby their experienced facilities operations and maintenance personnel flooded to the construction side of the business. Owners chose to shed construction, as they did not think it was a core competence needed to conduct their business. The tide appears to have reversed; not all owners have found their new position to be tenable. In the last five-to-ten years, there has been a learning curve (still in process) between power plant owners and the construction industry. New owner personnel has become increasingly knowledgeable based on lessons learned on recently completed projects. This learning represents a new awareness for owners who try to avoid mistakes and waste embedded in received traditions, and who strive to create high-performance supply chains.
SYNCHRONIZE CONCURRENT SUPPLY CHAINS
There appears to be relatively little real-time coordination between pipe hanger fabrication and pipe fabrication; the two processes are essentially de-coupled and take place concurrently. The respective fabrication schedules get defined in the design process based on input from construction regarding site needs, combined with rules-of-thumb for buffering deliveries in order to accommodate some schedule changes (schedule push). This is reflected in priority lists. It is not clear how suppliers are kept abreast of changes in construction during execution and therefore changes in materials due dates. Real-time feedback and pull of materials to the site appears to be missing in the process though it has proven to boost performance in production systems that are subject to a high degree of variability (e.g., Tommelein 1998).
Along the same line, it is striking that no research studies are available regarding piping productivity pertaining directly to pipe supports as a contributor to installation performance. Nevertheless, anecdotal evidence suggests that the lack of supports often contribute to poor on-site productivity.
REINFORCE COMMODITIZATION OF ENGINEERING SERVICES
“Engineering costs have steadily risen to levels approaching 20% of total project cost on industrial projects. Engineering activities become a source of schedule delays, cost overruns, project changes, and field rework, if not properly managed” (Chang et al. 2001). Recognizing this, pipe support supply chain participants have started using new tools to improve engineering processes. Increasingly sophisticated software is becoming available that makes it easier to perform complex engineering such as pipe stress analysis, while not requiring the same amount of expertise that used to be essential. In terms of supply chain management, additional study is needed into the ‘commoditization of engineering services’ domestically as well as overseas.
Suppliers say they prefer not to do engineering, because it is not as lucrative for them as fabrication is. Nevertheless, they can subsidize redesign in order to come up with more effective solutions and thereby be more competitive. In and by itself engineering may not be very lucrative, but suppliers in a turn-key mode may find it very attractive to have at least some specific engineering capabilities.
SUPPORT A NEW ROLE: SUPPLY-CHAIN INTEGRATOR
The emergence of a new role, that of supply-chain integrator, can be supported using Galbraith’s (1973) analysis of how information is processed within a firm (Parker and Anderson 2002). According to Galbraith, the main ways in which a firm makes decisions is through (1) corporate rules and standard operating procedures, (2) referring problems to
someone higher in the hierarchy, and (3) management by objective. Parker’s research with Hewlett Packard suggests that outsourcing may compromise methods (1) and (2). When firms are pushing new technological barriers, setting clear objectives may be impossible. Moreover, supplier firms typically have different rules and standard operating procedures, and there is no common hierarchy in which to refer problems. Galbraith suggests that one can supplement the first three methods by either (4) accepting performance degradation, (5) creating modular tasks, and (6) investing in lateral resources to glue the system back together. Performance degradation obviously is undesirable, but creating modular tasks is one pursuit the pipe support industry can take further than it has to date. Finally, supply-chain integrators could provide the glue to bring people and organizations together.
CONCLUSIONS
This paper has illustrated some of the complexity present in construction supply chains by presenting the case of pipe supports used in power plants. In addition to intrinsic complexity, this study has identified several sources of waste located at different supply chain interfaces. Waste hampers supply chain performance.
This paper has demonstrated that mapping and value stream analysis are valuable tools when trying to improve supply chain performance. Practitioners in the construction industry may achieve improvements by applying these tools to their own supply chains. Data obtained from industry to support this case study illustrated that more than 96% of the time in the supply chain of pipe support is non-value-added time, which has a direct impact on lead times.
Trying to improve the performance of supply chains is not an easy task. This paper has presented considerations for different supply chain participants who want to reduce lead times through the elimination of waste. To achieve this goal, this paper has highlighted several observations regarding supply chain improvement, including that (1) suppliers be identified early and provide input into engineering design, (2) unambiguous communication is needed using standardized processes and a limited set of standardized pipe supports, (3) ‘pulling’ resources from construction site installation upstream through the supply chain is advantageous, (4) a new management and engineering position called the “supply chain integrator” is emerging, (5) synchronization of merging supply chains at the site is crucial to performance improvement, (6) commoditization of engineering services is irrevocably taking place, (7) better-integrated computer tools are needed to automate the pipe support design process, and (8) real-time transparency in the chain is beneficial.
Further research could focus on what defines handoffs between different participants in the supply chain and the extent to which batches are maintained vs. re-grouped throughout the delivery process. A better understanding is needed of current and potential batching rules, as these may drive further supply chain lead-time reduction initiatives. Additional research is recommended into how the supply chains for pipe, pipe supports, and other components get synchronized to match up at the site. Scheduling methods may smooth and buffer supply chains to alleviate the impact of any change. Finally, additional study is needed into how engineering is done as well as into the commoditization of engineering services, both domestically as well as overseas.
ACKNOWLEDGEMENTS
Thanks are due to all people interviewed, for the time they spent and knowledge they shared with us. This research was funded by a grant for project team “PT 172 Improving Construction Supply Chain Performance” from the Construction Industry Institute whose support is gratefully acknowledged. Any opinions, findings, conclusions, or recommendations expressed in this paper are those of the authors and do not necessarily reflect the views of the Construction Industry Institute.
REFERENCES
Arbulu, R.J. (2002). Improving Construction Supply Chain Performance: Case Study on
Pipe Supports used in Power Plants. Master of Engineering Thesis, Constr. Engrg. and
Mgmt. Program, U.C. Berkeley, Berkeley, CA, May.
Arbulu, R.J. and Tommelein, I.D. (2002). “Alternative Supply-Chain Configurations for Engineered or Catalogued Made-To-Order Components: Case Study on Pipe Supports used in Power Plants.” To appear in Proc. IGLC-10.
Chang, L., Georgy, M., and Zhang, L. (2001). “Engineering Productivity Measurement.”
A Report for the Construction Industry Institute. Purdue Univ., West Lafayette, IN.
Crichton, C. (1966). Interdependence and Uncertainty, A Study of the Building Industry. Tavistock Publications Limited.
Galbraith, J. (1973). Designing Complex Organizations. Addison-Wesley, Reading, MA. Howell, G.A. and Ballard, H.G. (1996). “Managing Uncertainty in the Piping Process.”
RR 47-13, Constr. Industry Institute, Univ. of Texas, Austin, TX, September, 103 pp.
Jones, D.T. and Womack, J.P. (2002). Seeing the Whole. Lean Enterprise Institute, Brookline, MA.
Koskela, L. (1992). Application of the New Production Philosophy to Construction. Technical Report 72, CIFE, Stanford University, Stanford, CA, September, 75 pp.
Koskela, L. (2000). An Exploration Towards a Production Theory and Its Application to
Construction. Espoo. Technical Research Centre of Finland, VTT Pub. 408, 296 p.
Luhtala, M., Kilpinen, E., and Anttila, P. (1994). ALOGI: Managing Make-to-Order
Supply Chains. Helsinki University of Technology, Espoo, Finland.
Nayyar, M.L. (2000). Piping Handbook. 7th ed., McGraw-Hill, New York.
O'Connor, J.T. and Liao, S.-J. (1996). "Enhancement of the Piping and Instrumentation Diagram, Development Process." RR47-12, Constr. Industry Institute, Univ. of Texas, Austin, TX, Aug., 136 pp.
Ohno, T. (1988). Just-in-time for Today and Tomorrow. Taiichi Ohno with Setsuo Mito; translated by Joseph P. Schmelzeis, Productivity Press.
Parker, G. and Anderson, E. (2002). “From Buyer to Integrator: The Transformation of the Supply-Chain Manager in the Vertically Disintegrating Firm.” POMS, Journal of
Production and Operations Management, 11 (1) 75-91.
Tommelein, I.D. (1998). "Pull-driven Scheduling for Pipe-Spool Installation: Simulation of Lean Construction Technique." ASCE, J. Constr. Engrg. and Mgmt., 124 (4) 79-88. Tommelein, I.D. and Arbulu, R.J. (2002 forthcoming). Assessment of Supply Chain Performance for Engineered and Catalogued Made-To-Order Components: Case Study
on Pipe Supports used in Power Plants. Research Report, Constr. Engrg. and Mgmt.
Program, U.C. Berkeley, Berkeley, CA.
Vrijhoef, R. and Koskela, L. (2000). “The Four Roles of Supply Chain Management in Construction.” European J. of Purchasing & Supply Chain Mgmt., 6, 169-178.
Womack, J.P. and Jones, D.T. (1996). Lean Thinking: Banish Waste and Create Wealth in
your Corporation. Simon and Schuster, New York, N.Y.
Womack, J.P., Jones, D.T., and Roos, D. (1990). The Machine that Changed the World. Harper Collins, New York, NY, 323 pp.