Written by
Illinois
Soybean
Association/Illinois
Soybean
Program
Operating
Board
Performance
Management
Guidelines
and
Considerations
Illinois Soybean Association/Illinois Soybean Program Operating Board Performance Management Guidelines and Considerations
Background Information:
The Illinois Soybean Association (ISA) and the Illinois Soybean Program Operating Board (ISPOB) are the statewide organizations for all Illinois
soybean producers. The farmers who sit on the boards administer the soybean advocacy and membership programs as well as the soybean
Checkoff funds to support market development, soybean production/profitability research, promotion, issue management, analysis,
communications and educational programs. ISA/ISPOB programs are designed to ensure Illinois soy is the highest quality, most dependable,
sustainable and competitive in the global market place.
ISA/ISPOB spent the past two years reviewing and revising the strategic direction, strategic plan and, most recently, the strategic objectives and
annual operating plan for the organizations. ISA/ISPOB has developed a set of Key Performance Indictors (KPIs) to evaluate progress in achieving
the stated objectives in their combined strategic plan. During the same time period ISA/ISPOB has been at work refining and updating its bylaws
and organizational structure to better match the organizations’ going forward strategy. A primary intention of the board and management team
is to align behind the organizations’ combined strategic direction and plan. (See Figure 1 and 2)
Figure
1:
ISA/ISPOB
Strategic
Direction
Vision – (Destination)
The Illinois Soybean Association and the Illinois Soybean Program
Operating Board strives to enable Illinois soybean producers to be the
most knowledgeable and profitable soybean producers around the world.
Mission – (Purpose)
To ensure Illinois soy is the highest quality, most dependable, sustainable and
competitive in the global marketplace.
Values – (Core Beliefs)
Provide leadership to the Illinois soybean industry through Commitment,
Target Area Objective / Description Indicators
Overall
Utilization
Increase global consumption of Illinois soybeans # bushels of Illinois soybeans utilized
% increase in global market share of Illinois soybeans
Animal
Agriculture
Increase worldwide livestock consumption of IL
soybeans and soybean products. (IL, regional,
national & North America)
% increase in Midwest use permits
% increase in the annual soybean harvest crushed in Illinois % increase in the in‐state soybean utilization rate per species
% increase in the bushels of soybean and soybean meal out‐shipped from Illinois
Transportation Ensure soybeans and soybean products reach
their intended destination efficiently
% change in soybeans and soybean meal transported by container, barge, rail and
truck
% differential in basis between the Gulf and Peoria
Yield Increase yield and return on investment % increase in the soy/corn acres
% increase in yield by soybean growing district
Domestic production ranking by acres planted
Domestic production ranking by total bushels produced
% change in the total cost of production per acre by soybean district % increase in profit margins of Illinois soybean producers by district
High Quality Develop the highest quality soybean, soybean oil
and soybean meal products
% change in amino acid profile of Illinois soybeans
% increase in quality (protein versus oil) ratings of Illinois soybeans by district, by
state, by major competitor (Brazil versus Argentina)
% of overall production dedicated to IP soybeans.
Sustainability Illinois soybean producers accept and employ
sustainable production practices
% of Illinois soybean producers who are ISA/ISPOB 'accredited’ environmental
stewards
% increase in soybean production efficiency gains for 5 key environmental
resource indicators (“Keystone Alliance” metrics for Land use, Energy use,
Irrigation Water Use, Soil Loss, Climate Impact “Net Carbon Emissions”)
Market Access /
Advocacy
Maintain current markets, open new markets
and advocate for equitable public policies and
freedom to operate
% increase in the number of “ag favorable” state policies implemented
Target Area Objective / Description Indicators
% increase in “ag favorable” state legislative priorities coming out of committee.
Aquaculture Increase worldwide aquaculture consumption of
IL soybeans and soybean products
% increase in overall tonnage of soy in aquaculture feeds used in the Greater Gulf
Region
Industrial Increase domestic industrial consumption of IL
soybeans and soybean products
% increase in gallons of soy biodiesel produced in Illinois
% increase in total dollar value of Soy bio‐products purchased in Illinois
Image Building Improve our image and build coalitions with key
stakeholders
% of consumers with a positive perception of animal and crop agriculture.
Number of key ag corporations who recognize/acknowledge ISA/ISPOB as a
strong corporate partner
Alignment Align with other soy organizations to advocate for
and advance a proactive agenda
% of Illinois funded projects where we partner with national and state
organizations
Producer
Communications
Build support and recognition with producers for
Illinois soybean association programs
% increase in the number of producers expressing knowledge of ISA/ISPOB
programs
Organization
Excellence
Increase effective, progressive leadership at all
levels of the organization
% of ISA/ISPOB board members expressing strong or very strong overall
satisfaction with ISA's/ISPOB’s overall direction
% of ISA/ISPOB employees expressing strong or very strong overall satisfaction
with ISA's/ISPOB’s overall direction
Other Revenue Increase membership and sponsorship resources % increase in funding coming from sponsorships
% increase in ISA membership
To capitalize on these gains, ISA/ISPOB is working to implement a professional performance management program to help ensure all Checkoff
and non‐Checkoff resources are invested to maximize profitability and the competitive position of Illinois soybean producers. A growing base of
available Checkoff and non‐Checkoff funds is underscoring the importance of this challenge. It is a challenge resonating within ISA/ISPOB and
across the US soybean industry.
At present there is no unified inter‐organizational strategy to address this challenge. From what we’ve discerned, each soybean organization
(i.e. USB, ASA, USSEC, QSSBs) uses its own process to implement the discipline of performance management. This approach unintentionally
undermines the possibility for better alignment of Checkoff and Non‐Checkoff investments. It is our belief that a greater degree of (targeted)
funding alignment would provide a major impetus for generating new returns to US soybean producers. (See Figure 3)
Figure
3:
Soybean
Organizational
Alignment
1
Where
We
Are
Where
We
Are
:
:
Where
We
Want
to
Be:
Where
We
Want
to
Be:
Guideline Objectives:
This paper is written after spending many of the past 20 years working with various national and state level organizations within the soybean
industry. We offer it up aiming to meet four specific objectives.
1. Enable farmer leaders, staff and contractors to gain a clear and shared understanding of what performance management means.
2. Facilitate integration of a practical performance management program into the annual ISA/ISPOB governance cycle and serve as a case
study for fellow soy organizations to consider.
3. Summarize ISA’s/ISPOB’s annual KPI tracking, reporting, learning and evaluation processes.
4. Define key roles and responsibilities the board, committees, staff and contractors must fulfill to execute an annual performance
management program and keep ISA/ISPOB strategically focused. (See Figure 4)
Figure
4:
Roles
and
Responsibilities
Trust Need Credibility Truth Differences
Board
Volunteer Organizations
What is performance management?
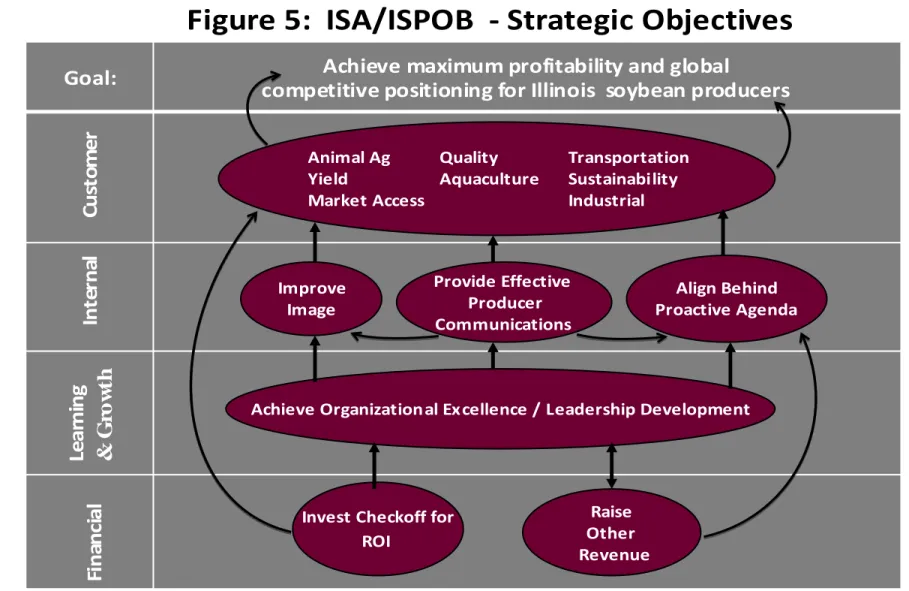
Performance management includes all board, committee, staff and contractor activities aimed at ensuring the organization’s strategic goal and
objectives are met in an effective and efficient manner. (See Figure 5)
Figure
5:
ISA/ISPOB
‐
Strategic
Objectives
2 Personal & Confidential
Goal:
Achieve
maximum
profitability
and
global
competitive
positioning
for
Illinois
soybean
producers
In
te
rn
al
C
u
st
om
e
r
Le
a
rni
ng
& Gr
o
w
th
Fi
na
nc
ia
l
Invest Checkoff for ROI
Raise Other
Revenue
Achieve Organizational Excellence / Leadership Development Improve Image Provide Effective Producer Communications Align Behind Proactive Agenda Animal Ag Yield Market Access Transportation Sustainability Industrial Quality Aquaculture
Performance management can be thought of as comparing the organization’s “Actual Results” against its “Desired Results.” Any discrepancy,
where “Actual” is less than “Desired”, constitutes (by definition) a performance improvement zone requiring attention. (See Figure 6)
Figure
6:
Performance
Improvement
Zone
Performance Improvement Zone
A performance improvement zone can appear at each level of an organization performance management program. Level 1 is the overall
strategic goal to be achieved. ISA/ISPOB has a goal of 600 million bushels of Illinois soybeans being utilized annually. (See Figure 1) Level 2 is
also strategic and covers Key Performance Indicators (KPIs) and targeted ranges of performance. Level 3 is operational and covers Projects or
Project Measures and their outcomes of performance. (See Figure 7)
Figure
7:
Two
Levels
of
Performance
Management
Level 1 is the center of the bullseye. Each year the board of the organizations must take a careful look at progress being made toward this
primary strategic intent. This occurs by examining factual information, KPI performance levels, as well as subjective information available to
the board and senior management team.
Level 2 of performance management is an ongoing process where the board periodically reviews and approves a carefully selected set of
specific strategic objectives, prioritized KPIs and desired target ranges of performance for each KPI. Then on a regular basis (at least
annually), KPIs are tracked and actual results reported to gauge whether the desired performance level is being achieved.
On a parallel track and annual basis Level 3 initiatives and projects are prioritized by committees, approved by the board and executed by
the staff to influence the desired level of KPI performance, i.e. Level 2. In reality it generally takes many projects “pulling together” (often
from across multiple organizations) to achieve a targeted level of performance for one KPI.
For each board approved program or project, a Level 3 “scope specific” performance management program is recommended. It requires
that one or more specific project measures and outcomes of performance be defined, tracked and reported against, as a particular project is
2020 Goal: 600 Million Bushels Illinois Soybeans Utilized Key
Performance Indicators & Targets Grow Animal Agriculture 2012 Projects Project Measures & Outcomes (All relevant)
Level 3 Level 2 Level 1
executed and ultimately “evaluated.” Project measures evaluate how well ONE particular project is doing while Key Performance Indicators
show how all relevant projects TOGETHER are working to meet a specific strategic objective.
Throughout the life of a particular Level 3 program or project, ISA/ISPOB staff work with contractors to give feedback and exert influence to
achieve the desired level of project performance.
It is important to recognize that performance management is not a precise science. Global disruptive change (e.g. weather, political turmoil,
etc.) often occurs which cannot be controlled. In most situations qualitative factors must be given significant consideration when judging
whether a Level 3 project is working, or when completed successful in driving Level 1 and Level 2 performance. It is Level 1 and Level 2
performance where ISA/ISPOB ultimately seeks to influence. This takes time and requires that ISA/ISPOB take a long‐run view.
How does Performance Management integrate with the ISA/ISPOB Annual Strategic Management Cycle?
Below is a “working draft” Strategic Management Calendar detailing the planning, evaluation and budgeting processes of the organization
from September, 2011 ‐ September 2013. You will note that performance management has been fully integrated throughout. (See Figure 8)
Figure
8:
ISA/ISPOB
Annual
Strategic
Management
Cycle
–
Updated
12.27.2011
Month Contractor Project Reporting Program Project Evaluation Reporting KPI Results Reporting Objective Progress Determined
Plan, Evaluation & Budget
Development Senior Staff Review Meeting Board / Committee Meetings Sept. 2011
• September 1 start of new fiscal year
• Staff begin assembling evaluation information
for third party review for previous fiscal year
program areas and projects
• Identify / verify / monitor trends and issues
facing the domestic and global soybean
industry
Oct.
• Staff completes assembling of previous fiscal
year evaluation information. Third party
evaluation conducted. • Collection of KPI data
• Identify / verify / monitor trends and issues
facing the domestic and global soybean
industry Nov.
• Present baseline information on all KPIs • Committees review previous fiscal year
project evaluations for immediate projects • Committees analyze KPI data.
• Committees highlight and prioritize trends
and issues the board should consider in the
current planning cycle
• Monitor execution of current year operating
plan by Program Area/Objective
• Review new and amended projects for the
Board’s consideration Executive Committee Production Committee Marketing Committee
• Financial Audit presented to board
• Allocate new available funding to priority KPIs • Update board on committee findings related
Month Contractor Project Reporting Program Project Evaluation Reporting KPI Results Reporting Objective Progress Determined
Plan, Evaluation & Budget
Development Senior Staff Review Meeting Board / Committee Meetings
• Review major program/project evaluation
findings from committees
• Committees recommend any new and
amended projects to the Boards.
Jan.
• Executive Committee lead the next fiscal year
strategic planning process
• Study, discuss, and prioritize issues to plan for
next FY year planning cycle
Executive Committee
Feb.
• Review KPI data and monitor execution of
current FY operating plan by Program Area /
Objective
• Committees review previous fiscal year
project evaluations
• Conduct mid‐year review of current Operating
Plan by major program area and/or objective
Production Committee Marketing Committee March
• Full boards further refine and approve
strategies for next fiscal year
• Approve changes to high level strategic plan
for next fiscal year
• Monitor KPI’s and execution for current year
operating plan by Program Area / Objective • Full board review/confirm the Organizations’
overall Strategic Direction and high level
strategies
Executive Committee
Board Meeting and
Training April
• Staff refine next fiscal year strategic operating
plan including a balanced set of objectives,
performance indicators • Staff prepares project proposals
• Work with other stakeholders to identify
areas for collaboration (e.g. Corn, Poultry,
Month Contractor Project Reporting Program Project Evaluation Reporting KPI Results Reporting Objective Progress Determined
Plan, Evaluation & Budget
Development Senior Staff Review Meeting Board / Committee Meetings Beef, etc.)
• Ensure program and project evaluations
requirements are communicated and
synchronized
• Staff coordinates appropriate alignments with
national funding priorities
• Committees support staff in drafting the
proposed FY 13 operating plan and budget
June
• Next FY Project concepts prioritized by
Committees
• Ensure program and project evaluations
requirements are communicated and
synchronized
• Executive Committee discusses operational,
program areas, and next FY Evaluations
program.
• Staff makes preliminary recommendations for
KPI/project evaluations
• Pro forma budgets and proposed next FY
Operating Plan priorities presented to the
combined committee meeting.
• The full board ‐ serving as a “committee of the
whole” ‐ vets the proposed Operating Plan
priorities for next fiscal year
• Executive Committee discusses program areas
and budget percentages
• Discuss funding allocations by Target Area,;
refine KPI targets as necessary
Combined Committee Meetings Executive Committee July
• Executive Committee discusses program areas
and budget percentages
• Pro forma budget is presented to the board. • Next FY Operating Plan approved by full board • Next fiscal year project RFPs issued
• Ensure program and project evaluations
requirements are communicated and
synchronized
New Board Member
Orientation
Executive Committee
Board Meeting and
Training
Board Meeting and
Month Contractor Project Reporting Program Project Evaluation Reporting KPI Results Reporting Objective Progress Determined
Plan, Evaluation & Budget
Development Senior Staff Review Meeting Board / Committee Meetings August
• Committees meet to review proposals
received in response to RFPs submitted in
July.
• Approve funding allocations by Target Area
for next fiscal year.
• Final projects/budgets approved • Notify contractors of approvals/denials • Ensure program and project evaluations
requirements are communicated and
synchronized
• Staff/Contractors begin compiling data for
project evaluation
Board and Committee
Reorganization
Board / Staff Retreat Sept. 2013
• Begin program, project evaluation for
previous fiscal year.
How do the ISA/ISPOB KPI Tracking, Reporting, Learning and Evaluation Processes actually work for Level 2 and Level 3?
Level 2: At Level 2 one needs to think of performance management as an ongoing process where the board periodically approves a carefully
selected set of specific strategic objectives, prioritized key performance indicators (KPIs) and desired target ranges of performance for each
KPI. Then actual KPI performance results are tracked and reported, in this case annually, to see if the desired performance levels are being
achieved. For example, is more soybean meal produced in Illinois being consumed by animals in Illinois? (See Figure 9)
Figure
9:
KPI
Tracking,
Reporting,
and
Learning
(Level
2)
Vision, Mission, Values, Goals Strategies 2012‐2013 Operating Plan •Target Areas
•Key Performance Indicators
(Long Term) •Target ranges 2012 Tactical Initiatives Projects •Project Objectives •Project Measures (Short Term) •Outcomes
Impact on KPI / Targets
Q u an ti ta ti ve Re su lt s Q u an ti ta ti ve & Q u al it at iv e Ou tc o m es St ra te gi c Lea rn ing
Board / Committees Committees / Staff
If KPI level progress is noted it is important to understand what is contributing to that progress. We may or may not be able to attribute
progress to our efforts, but we must better understand what is impacting the KPI in order to realign our efforts and make a course correction
where appropriate. If we determine progress is not being made within a reasonable amount of time, we must understand why. Is it because
our efforts were not effective? Did we apply the wrong type of effort? Were factor(s) beyond our control playing a major influence? The key
is to learn from experience and adjust the organizations’ plan as necessary to positively impact performance.
Level 3: At Level 3 the focus is on evaluating programs or projects to determine if execution was effective in achieving the agreed upon
desired outcomes established when the project was originally approved by the boards. As with Level 2 it is important to understand what is
working and what is not working before final, evaluative judgments are made.
An example: In many soy demand building initiatives, a desired project measure reveals incremental change of target audience behavior
from one level of performance (A) to the next level of performance (B) via a specific message of change. (See Figure 10)
Figure
10:
US
Pork
in
Europe
Project
Measures
A B Stage 1 Awareness Knowledge Stage 4 Purchase Stage 2 Liking Preference Stage 3 Conviction to Try Stage 5 Regular Purchase
# of targeted processors who buy
US Pork; sales to targeted
processors
# of targeted processors who
process primarily US Pork; sales
# of targeted processors who try
US Pork
# of targeted processors aware of
the higher yield and lowering
processing costs of US Pork
# of targeted processors convinced
that US Pork offers higher profit
potential
To have a full appreciation of Level 3 performance management, one must recognize the essential role program planning and management
plays in the entire process. If projects are approved before complete program descriptions, project objectives, project measures, and
outcomes are established it makes it virtually impossible to do a fair evaluation of performance and conceptually more difficult for the Board
or Committees to approve such projects.
ISA/ISPOB program planners must be diligent in their efforts to understand:
1. the strategic and tactical environment they are targeting,
2. the assumptions they can make about the environment in terms of constraints and opportunities
3. the activities they believe are best suited to achieve the targeted outcomes of performance.
It should always be remembered that progress can only be measured in relation to matters over which ISA/ISPOB and its contractors have
some level of control and influence over. It is absolutely critical to focus on the right project measures. This level of program management
has been nicely summarized by Agralytica Inc. in their work on “Results‐Oriented Management.” (See Figure 11)
Source: ©Agralytica, Results‐Oriented Management – Page 92
Goals Assumptions Constraints / Opportunities Assumptions Activities (Projects) Project measures? Not achieved Why? ….. ….. ….. Achieved Why? ….. ….. ….. Are the Underlying Assumptions sound Yes No Why? ….. ….. ….. Learning Feedback
Figure
11:
Project
Evaluation
Drives
Learning
(Level
3)
Two types of underlying assumptions need to be examined as part of the evaluation process. First is the causal assumption, as in ”Is the
A primary outcome we seek from any program or project is to “learn” from execution to adapt and modify our planning moving forward to
positively impact KPI performance at Level 2 of the performance management program. Therefore ISA/ISPOB must be innovative and
thoughtful in selection of appropriate Level 3 project measures at the program planning stage. By doing this ISA/ISPOB can periodically
communicate realistic contributions to achieving desired “farmer driven” outcomes, e.g. more local, domestic and international meal
consumption by livestock. To make Level 3 performance management operational it is helpful to think of an evaluation process unfolding
over a one year period of time. (See Figure 12)
Figure
12:
Evaluation
Process
and
Timeline
(Level
2
&
3)
Program
Development
for coming year (Staff,
Contractors,
Committees) StaffCommittee & Exec
Review Evaluation Program for next FY (Level 1, 2 & 3) Staff Recommends Projects & KPIs to be Evaluated (Level 2 & 3) Committees Discuss Projects to be Evaluated with Proposal Evaluation Budget Outside Evaluators Chosen FY Projects / KPIs Evaluated Project/KPI Evaluations Presented to
Committees March‐May
June June June August August August‐September October‐January February
What are the roles and responsibilities of the board, committees, staff and contractors in the performance management program?
The answer to this question is a two part answer. Answer one relates to the level of responsibility each organizational component has for
the overall strategic management of the organizations. (See Figure 13)
Figure
13:
Strategic
Management
Roles
and
Responsibilities
Organizational
Component
Strategy
Element
Measure
Target
Responsibility
Board of Directors Vision Mission Strategic Goal
High Level Strategies
Overall Soybean Utilization
600 Mil Bushels
Level 1: Approve, allocate
and annually assess
progress toward achieving
this level of utilization
Committees & Staff
Strategic Objectives
Key Performance Indicators
Target Range
established for
each KPI
Level 2: Track, Report and
Learn
Level 3: Evaluate and Learn
Staff & Contractors (some 3rd party)
Tactical Projects
Project Performance Measures
Outcomes established for each program or project Level 3: Execute,
The second part of the answer relates to specific operational responsibilities each organizational component has at Level 2 and Level 3 of
ISA’s/ISPOB’s performance management program. (See Figure 14)
Figure
14:
Performance
Management
Responsibilities
• Level 2: Key Performance Indicators (Are we achieving our objectives and
ultimately goal?)
– Role of staff– Collect KPI information and report to committees
– Role of committees– Review KPI performance against target ranges, discuss
findings and make recommendations to the board
– Role of board– Adjust, refine or reconfirm target ranges
• Level 3: Program/Project Evaluation
– Role of contractor –Efficiently and effectively execute the project and
provide regular progress reports
– Role of staff– Recommend program/project areas for evaluation and when
appropriate work with Third Party Evaluators to assemble information
– Role of staff/committees‐ Review evaluation reports and make
recommendations for anychanges in target ranges going forward
– Role of board – Adjust, refine or reconfirm target area planning priorities – Role of board and committees‐assure that programs/projects properly align
with the target area objective and that those projects are accomplishing what
they set out to do
Summary
In summary, ISA/ISPOB is very close to having a fully operational performance management program embedded within the strategic
management processes of the organizations. From both “ROI” and “cost to build” perspectives, significant economies of scale would also be
realized by developing an integrated and practical performance management system with likeminded soybean organizations. A formal
assessment of the situation would likely find a common need for a standard set of goals, objectives, KPI’s and project measures. An
opportunity may exist to build out a base set of indicators and measures all state and national organizations could draw from to manage
their own performance while facilitating resource alignment wherever possible and desirable.
In a “best case” scenario an integrated performance management system would enable state / district level data to be rolled up to the
national level. Alternatively, national and state level organizations would be able to drill down to assess state‐by‐state contributions. This
level of cascading and transparency would likely point out areas for performance improvement and sources of new returns for producers.