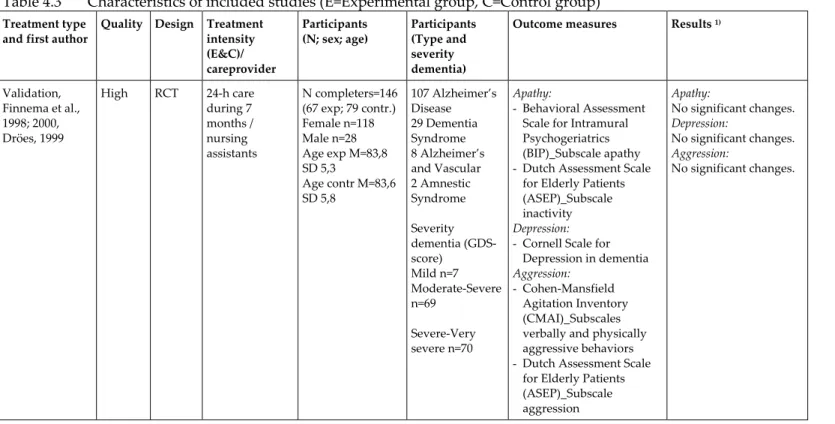
Depression in dementia
Development
and
testing
of
a
nursing
guideline
Renate Verkaik
Telefoon 030 2 729 700 Fax 030 2 729 729 ©2009 NIVEL, Postbus 1568, 3500 BN UTRECHT Cover photo: Belinda Reay Cover design: Labor Grafimedia BV, Utrecht Word processing/lay out: Doortje Saya Language consultant: Vertaalkantoor Kerkhoven, Utrecht Printing: Labor Grafimedia BV, Utrecht All rights reserved. No part of this publication may be reproduced, stored in a retrieval system or transmitted, in any form or by any means, electronic, mechanical, photocopying, recording or otherwise, without the prior written permission of NIVEL. Exceptions are allowed in respect of any fair dealing for the purpose of research, private study or review.
Depression in dementia
Development
and
testing
of
a
nursing
guideline
Depressie bij dementie
Ontwikkeling
en
evaluatie
van
een
richtlijn
voor
verzorgenden
(met een samenvatting in het Nederlands)
PROEFSCHRIFT
ter verkrijging van de graad van doctor aan
de Universiteit Utrecht,
op gezag van de rector magnificus, prof. dr. J.C. Stoof,
ingevolge het besluit van het college voor promoties
in het openbaar te verdedigen op
maandag 20 april 2009 des middags te 4.15 uur
door Renate Verkaik geboren op 30 december 1974 te Rotterdam
Co‐promotoren: Dr. A.L. Francke Dr. B.K.G. van Meijel
The research described in this thesis was carried out at NIVEL (Netherlands
Institute for Health Services Research), Utrecht, The Netherlands. NIVEL is a
participating member of the Research Institute for Psychology & Health,
officially certified by the Royal Netherlands Academy of Science (KNAW).
The study was financed by ZonMW; Netherlands Organisation for Health
Research and Development, research program ‘Nursing professions; In
between knowing and acting’(first and second round).
Financial support for the publication of the thesis was kindly provided by
1 General introduction 7 2 The relationship between severity of Alzheimer’s Disease and prevalence of comorbid depressive symptoms and depression: A systematic review 13 3 Comorbid depression in dementia on psychogeriatric nursing home wards: Which symptoms are prominent? 45 4 The effects of psychosocial methods on depressed, aggressive and apathetic behaviors of people with dementia: A systematic review 63 5 Supporting people with dementia who are depressed or apathetic: The development and evaluation of two evidence‐based nursing guidelines 93 6 Introducing a nursing guideline on depression in dementia: A multiple case study on influencing factors 107 7 The effects of a nursing guideline on depression in psychogeriatric nursing home residents 131 8 The introduction of a nursing guideline on depression at psychogeriatric nursing home wards 149 9 General summary and discussion 169 Samenvatting (Summary in Dutch) 185 References 191 Appendix 209 Curriculum Vitae 243 Dankwoord 245
1
Introduction
It is widely acknowledged that depression in dementia is a burden for
patients as well as for their caregivers (e.g. Shin et al., 2005; Kerkstra et al.,
1999). On the psychogeriatric wards of Dutch nursing homes most residents
suffer from dementia. There are indications that the prevalence of
depression in dementia on these wards is high. A pro‐active attitude among
caregivers is needed to recognize this severe health problem in demented
residents and to respond to it.
This thesis firstly seeks to provide greater insight into depression in
dementia on psychogeriatric nursing home wards. Secondly, it describes the
development of the nursing guideline ‘Depression in Dementia’, and thirdly
it presents the effects of the guideline’s introduction on residents and their
Certified Nurse Assistants (CNAs). In addition, the factors that may
facilitate or hamper the guideline introduction are described. This
introductory chapter gives an overview of what is already known about
these subjects. Furthermore, the research questions and the structure of the
thesis are outlined.
Background
What is already known about depression in dementia?
Comorbid depression in people with dementia is associated with decreased
quality of life (Shin et al., 2005), greater health care utilization (Kunik et al.,
2003), higher mortality rates (Suh et al., 2005) and decreased caregiver’s
wellbeing (Kerkstra et al., 1999; Shin et al., 2005). Little is known about the
etiology of depression in dementia. It is thought to be partly caused by
neurological changes due to the dementia and partly by psychological
reactions to the presence of the dementia (Janzing and Zitman, 2002).
The prevalence rates for significant depressive symptomatology in dementia
in previous studies range from 15 percent (Vida et al., 1994) to as high as 50
percent (Migliorelli et al., 1995). Recognition of depression in dementia is a
complex task for caregivers and, as a consequence, under‐recognition is high
(Olin et al., 2002b). This is partly caused by an overlap of some of the
symptoms of dementia with prominent symptoms of depression (e.g.
apathy). Moreover, people with dementia have severe difficulty in
addition, the assessment of depression in people with dementia is complex,
since in this population the syndrome is qualitatively different from
depression in non‐demented elderly populations as diagnosed with DSM‐IV
criteria for Major and Minor Depression (DSM‐IV: APA, 1994) (Olin et al.,
2002b).
In 2002 an expert group from the American National Institute of Mental
Health (NIMH) therefore developed specific criteria for depression in
Alzheimer Disease, the most frequent type of dementia. These are the
‘Provisional Diagnostic Criteria for Depression of Alzheimer Disease’ (PDC‐
dAD) (Olin et al., 2002a). Depression of Alzheimer Disease is assumed to be
different from DSM‐IV Major Depressive Disorder with respect to the type
and intensity of its symptoms. As compared with DMS‐IV criteria for Major
Depressive Disorder, specific symptoms for depression in Alzheimer
Disease are ‘irritability’ and ‘social isolation/withdrawal’. Another important
difference compared to DSM‐IV criteria is that in Depression of Alzheimer
Disease the presence of at least three, instead of five, symptoms is required,
and symptoms are not required to be present nearly every day.
Using the PDC‐dAD criteria should improve recognition of Depression of
Alzheimer Disease. Two recent studies in demented outpatient populations
showed that with the Provisional Diagnostic Criteria for Depression of
Alzheimer Disease higher rates of depression were indeed identified than
with DSM‐IV or ICD‐10 criteria for Major Depression (Vilalta‐Franch et al.,
2006; Teng et al., 2008). To our knowledge, the criteria have not been
previously applied to a demented inpatient population, such as
psychogeriatric nursing home residents.
What is already known about depression in dementia on psychogeriatric wards?
Psychogeriatric wards in Dutch nursing homes are separate wards or units
for psychogeriatric residents, that are specially adapted for these residents.
In the Netherlands, the main part of the daily nursing care in nursing homes
is delivered by Certified Nurse Assistants (CNAs) who generally have three
years of basic nursing training, and who collaborate with other
professionals, like nursing home physicians, occupational therapists and
psychologists.
About 85% of the residents of psychogeriatric wards in Dutch nursing
homes are diagnosed with a dementia syndrome (Schols et al., 2004), mostly
To our knowledge there is only one study on the prevalence of depression in
the demented residents of Dutch psychogeriatric nursing home wards
(Zuidema et al., 2007). In this study a prevalence rate of 20% for depression
in dementia was found. This is comparable with published rates from
Norway, 21% (Selbaek et al., 2007) and is somewhat lower than in the United
States, 27% (Gruber‐Baldini et al., 2005). As said, in general, recognition of
depression in dementia is difficult. It is often even more difficult in patients
on psychogeriatric wards, since most of them are in the latter stages of
dementia and cannot express themselves clearly verbally. Teresi et al. (2001)
show that nurse assistants only have a sensitivity of 55% in recognizing
depression in dementia sufferers. Recognition by other disciplines, such as
physicians, is even lower ‐ namely 14% (Bruhl et al., 2007).
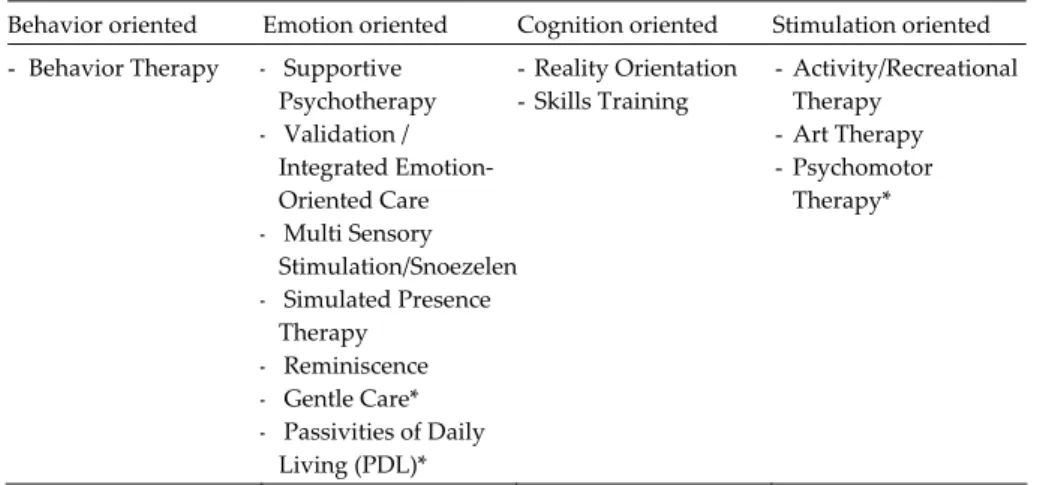
What is already known about evidence based care for people with dementia and depression?
In 2005 the Dutch guideline ‘Diagnostics and medicinal interventions for
dementia’ was published (NVKG, 2005). Although the guideline focuses on
medicinal interventions, for depression in dementia the use of non‐
pharmacological interventions is also recommended. However, the
guideline does not recommend the use of a specific type of psychosocial
intervention, because this was beyond its scope. The Cochrane Collaboration
has conducted some systematic literature reviews of the scientific evidence
for a number of psychosocial interventions used relatively often in nursing
homes, including Reminiscence (Woods et al., 2005) and Validation (Neal
and Barton Wright, 2002). None of the reviews found any proof for their
effectiveness, either on depression, or on other outcomes, such as aggression
(www.cochrane.org).
However, particularly for depression in dementia, a promising method has
been developed in the USA, the so‐called BehaviorTherapy‐PleasantEvents.
Teri et al. (1997) showed that by inducing individualized pleasant activities
and reducing unpleasant events, depression in home dwelling people with
dementia can be significantly reduced. Specifically for people with
dementia, the method is appropriate because hardly any demand is made on
their cognitive abilities. Close relatives perform an important coordinating
and supporting role in BehaviorTherapy‐PleasantEvents. The method also
seems promising for psychogeriatric nursing home wards in the
this case be assumed by the Certified Nurse Assistants (CNAs) of the
demented residents.
Structure
and
research
questions
This PhD thesis aims to provide greater insight into the characteristics of
depression in demented residents of Dutch psychogeriatric nursing home
wards. In addition, this thesis will add scientific knowledge about the
introduction of a nursing guideline to support residents with dementia and
depression on psychogeriatric nursing home wards, and about its effects on
residents and Certified Nurse Assistants (CNAs). The thesis is divided into
the following four sections with related research questions:
1. Understanding depression in dementia:
a. Is depression in dementia related to dementia severity?
b. What is the prevalence of depression in dementia on
psychogeriatric nursing home wards?
c. What are the characteristics of comorbid depression in
demented psychogeriatric nursing home residents?
2. Guideline development:
a. How much scientific evidence exists to show that psychosocial
care methods reduce depression in dementia?
b. Which steps need to be taken in developing an evidence based
guideline?
3. Guideline introduction:
c. Which factors facilitate or inhibit a successful introduction of
the guideline on psychogeriatric nursing home wards?
d. Which factors facilitate or inhibit a successful application of
the guideline on psychogeriatric nursing home wards?
4. Effects of the guideline:
e. What are the effects of introducing the nursing guideline on
depression in demented residents of psychogeriatric nursing
home wards?
f. What are the effects of introducing the nursing guideline on
the CNAs of psychogeriatric nursing home wards?
Content
of
the
thesis
Chapter 2 gives a systematic literature review concerning the relationship
between the severity of Alzheimer Disease and the prevalence of comorbid
depression.
In Chapter 3, the prevalence rate and symptom profile of depression in
dementia on psychogeriatric nursing home wards are described. Data come
from the diagnostic phase of a clinical trial studying the effects of the
nursing guideline ‘Depression in Dementia’.
Chapter 4 describes a systematic literature review of the effectiveness of
psychosocial methods on depressive, aggressive and apathetic behaviors of
people with dementia.
In Chapter 5 the seven phases in the development of the nursing guideline
‘Depression in Dementia’ are presented. The systematic literature review of
Chapter 4, consultation of an expert group, and conducting a practice test
comprise three of these phases.
In Chapter 6, factors that facilitate or hamper a successful introduction and application of the guideline are presented. Using a multiple case study
design, qualitative and quantitative data from the clinical trial of the effects
of the nursing guideline ‘Depression in Dementia’ are compared and
combined.
Chapter 7 reports the results of the clinical trial of the effects of the guideline
introduction on depression in demented residents of the psychogeriatric
nursing home wards. It concerns a multicentre controlled clinical trial in
nine Dutch nursing homes with randomization at ward level, and with pre‐
test, post‐test and follow‐up measurements.
Chapter 8 reports the results of the clinical trial into the effects of the
guideline introduction on CNAs working with the depressed and demented
residents.
Finally, in Chapter 9, the results of our studies are discussed. The general
findings are summarized and put into context. Methodological aspects are
discussed, as well as the clinical relevance of the results. Recommendations
are made for implementation of the guideline and for future research.
2
The relationship between severity of Alzheimer’s
Disease
and
prevalence
of
comorbid
depressive
symptoms and depression
A
systematic
review
This chapter was published as:
Verkaik R, Nuyen J, Schellevis FG, Francke AL. The relationship between
severity of Alzheimer’s Disease and prevalence of comorbid depressive
symptoms and depression: a systematic review. Int J Geriatr Psychiatry, 2007;
Abstract
Objectives
To gain more insight into the association between severity of Alzheimer’s
Disease (AD) and prevalence of comborbid depression.
Methods
A systematic literature review based on the Cochrane methodology was
performed. PubMed, PsychINFO and EMBASE databases were searched for
existing studies that fulfilled predefined inclusion criteria. The studies were
divided into: (1) those that analysed the association between severity of AD
and prevalence of depressive symptoms (“continuous” approach) and (2)
those that investigated the association between severity of AD and
diagnosed depression (“categorical” approach). The quality of existing
studies was rated and the results were synthesized with a best evidence
synthesis.
Results
Twenty‐four studies fulfilled the inclusion criteria. Nineteen reported results
for a continuous approach and seven for a categorical approach.
Three of the four high quality studies within the continuous approach did
not find a significant association between severity of AD and prevalence of
depressive symptoms. None of the three high quality studies using the
categorical approach found a significant association between the severity of
AD and the prevalence of diagnosed depression.
Conclusions
There is evidence for a lack of association between the severity of AD and
the prevalence of comorbid depressive symptoms or diagnosed depression.
Until new studies contradict this conclusion, prevention and intervention
strategies for comorbid depression in AD should be aimed at all patients
irrespective their disease severity.
Introduction
According to recent studies up to 50% of patients with Alzheimer’s Disease
(AD) suffer from depression at least once during their disease course
(Starkstein et al., 2005). Comorbid depression in patients with AD has been
associated with decreased quality of life (Shin et al., 2005), increased need
for institutionalization (Steele et al., 1990), greater health care utilization
(Kunik et al., 2003), higher mortality rates (Suh et al., 2005) and decreasing
caregiver’s well being (Kerkstra et al. 1999; Shin et al., 2005). These serious
consequences ask for the development of strategies for prevention, early
recognition and intervention for depression in AD. Diagnostic and
preventive services should be targeted at those at greatest risk which means
that it is important to understand who is most likely to develop depression.
In addition, this tells us something about the underlying causes of
depression and may help develop preventive and intervention strategies.
Within this context, it is important to expand knowledge regarding the
relationship between severity of AD and comorbid depression. The results
of studies that have examined this relationship are inconsistent (e.g.
Harwood et al., 1998; Lopez et al., 2003; Piccininni et al., 2005). Explanations
for these diverging results could be multiple, because the studies and study
samples differ on many points.
One of the differences between the existing studies is the method used to
determine the prevalence of depression: “continuous” or “categorical”.
Within the continuous method the number of prevalent depressive
symptoms is determined without establishing a diagnosis of depression.
According to the categorical method, diagnostic criteria for depression are
used to determine if a patient suffers from comorbid depression or not.
There are various other differences between existing studies that could
possibly offer explanations for the diverging results: (1) Many studies group
different types of dementia together, (2) Diagnostic procedures for AD differ
between studies, (3) The assessment instruments for the severity of AD
differ, (4) The instruments used to assess the prevalence of depression are
multiple, also within the continuous and categorical approach and (5) Study
samples differ in many relevant aspects, such as severity of AD, living
situation, history of depression, or use of psychotropic medication.
In order to gain more insight into the relationship between the prevalence of
depression and severity of AD we conducted a systematic literature review
quality of existing empirical studies. The division into studies that use a
continuous or a categorical approach forms the main structure around
which the results of the review are presented and discussed.
Methods
The systematic review was conducted in accordance with a predefined
research protocol following the guidelines of the Cochrane Collaboration
(Clarke and Oxman (eds.), 2002) that prescribed the following steps: (1)
inclusion criteria, (2) search method, (3) selection method, (4) data
extraction, (5) assessment of methodological quality, (6) data synthesis. Steps
3 to 6 were performed independently by the first two authors (RV, JN).
Inclusion criteria
1. Type of research. This review included naturalistic studies that conducted
cross‐sectional analyses on the relationship between severity of AD and
prevalence of comorbid depressive symptoms or depression.
2. Patients. Studies had to involve patients who had been diagnosed with
AD according to established diagnostic methods and criteria (e.g.
NINCDS‐ADRDA (McKhann et al., 1984), ICD‐10 (World Health
Organization, 1992), DSM‐III‐R or DSM‐IV criteria (APA, 1987, 1995).
3. Measurement of AD severity. Only studies using a validated measure for
AD severity were included. Scales that just measure degree of cognitive
impairment as a measure for the severity of AD (e.g. Minimal Mental
State Examination (MMSE); Folstein et al., 1975) as well as scales that
also take non‐cognitive aspects of AD into account (e.g. Global
Deterioration Scale (GDS); Reisberg et al., 1982) were included.
4. Measurement of depression. In the case of continuous studies: only studies
using an established, validated rating scale for measuring depressive
symptomatology were included, regardless of whether the rating scale
used was specifically developed to assess depressive symptoms in
patients with dementia (e.g. the Cornell Scale for Depression in
Dementia (CSDD; Alexopoulos et al., 1988) or not (e.g. the Hamilton
In the case of categorical studies: those studies were included that either
employed established diagnostic criteria for major depressive disorder
(MDD) (e.g. DSM‐III‐R/‐IV or ICD‐10 criteria) or used an empirically
validated cut‐off score on a rating scale for depressive symptoms
specifically devised for patients with dementia (e.g. CSDD score >12;
Lyketsos et al., 1997; Alexopoulos et al., 1988).
5. Statistical analysis. Only studies were included that tested the
relationship between severity of AD and prevalence of depressive
symptoms or depression for statistical significance.
Search method
In March 2006 we searched in three international bibliographical databases,
i.e. PubMed, PsychINFO and EMBASE, for all studies that were published in
English until that date and potentially fulfilled all five inclusion criteria. The
databases were searched using the following strategy that was formulated in
PubMed and adapted to the other databases:
Dementia [MESH] AND (Depression [MESH] OR Depressive Disorder
[MESH])
All literature lists of possibly relevant studies were also screened for
additional references.
Selection method
A first selection for inclusion was performed by the first author (RV). On the
basis of titles and abstracts all studies that clearly did not meet one of the
five inclusion criteria were excluded from the review. If a study appeared to
meet the inclusion criteria or if there was any doubt, the full article was read.
A second selection was made by two reviewers independently (RV, JN).
Based on the full articles both reviewers checked if the studies satisfied all
five criteria. Disagreements regarding inclusion status were resolved by
discussion. In three cases no consensus could be met and a third reviewer
(AF) was consulted.
Data extraction
After the selection procedure, the two reviewers (RV, JN) independently
1. the diagnostic criteria employed to establish presence of AD;
2. the characteristics of the study sample of patients with AD (i.e., size,
inpatients or outpatients, socio‐demographics, and, if reported, other
relevant characteristics such as duration of AD, presence of depression
prior to the onset of AD);
3. the rating scale used to measure severity of AD;
4. the rating scale used to measure depressive symptoms OR the
diagnostic procedure used to establish presence of depression;
5. the dependent and independent variable studied and the statistical
technique used to examine their relationship. If a multivariate technique
was employed, the included covariates were also documented;
6. a short description of the results (i.e., significant or non‐significant
relationship, and, if reported, descriptive statistics, test statistics, p‐
value);
7. the direction of the association (in case a significant relationship was
found).
The findings of the two researchers were compared and disagreements were
resolved by discussion. The extracted data is presented for continuous and
categorical studies in two separate tables.
Assessment of quality
After the data extraction, the quality of each included study was rated
independently by the two researchers (RV, JN), using a set of five predefined
criteria (figure 2.1). Criteria one to three concerned the internal validity and
four and five are statistical criteria. The criteria cover the key domains (1)
comparability of subjects (between studies) (2) outcome measurement and (3)
statistical analyses that are formulated by the U.S. Agency for Healthcare
Research and Quality for observational studies (AHRQ, 2002). Studies were
Figure 2.1 Quality criteria
Several studies examined the relationship between severity of AD and
prevalence of depressive symptoms or depression in more than one way ‐
either by employing different statistical techniques or by performing the
same analytical technique using the scores of different rating scales for
measuring depression symptomatology and/or severity of AD. These so‐
called ‘sub‐studies’ were evaluated independently.
For each of the five quality criteria scoring positively, a (sub‐)study received
one “quality” point. The methodological quality of a (sub‐)study was
operationalized simply as the sum of all criteria scoring positively and thus
potentially ranged from 0 to 5. There were no disagreements between the
two researchers regarding the methodological quality ratings.
Best evidence synthesis
A “best evidence synthesis” (Slavin, 1995) was conducted to determine the
existing evidence for a relationship between severity of AD and prevalence
of depressive symptoms and diagnosed depression. Levels of evidence were
based on an earlier review of observational studies (Lievense et al., 2002).
Figure 2.2 shows the principles of the best evidence synthesis.
(1) The diagnosis of AD is established according to the ‘golden standard’, the NINCDS‐ ADRDA criteria (McKhann et al., 1984); (2) Severity of AD is assessed using a clinical instrument that besides cognitive capabilities also takes account of functional and/or clinical factors: (a) CDR (Hughes et al., 1982) or (b) GDS (Reisberg et al., 1982); (3) Regarding studies that use a continuous approach, depressive symptoms are assessed using a rating scale specifically developed for patients with dementia. In studies with a categorical approach this type of rating scale should be used in combination with established diagnostic criteria for major depressive disorder. The following depression rating scales are specifically developed for demented populations: (a) the CSDD (Alexopoulos et al., 1988), (b) the NPI depression subscale (Cumming et al., 1994), (c) the Dementia Mood Assessment Scale (DMAS; Sunderland et al., 1988), (d) the Revised Memory and Behavior Problem Checklist (RMBPC; Teri et al., 1992); (4) The statistical analysis controls for the possible influence of at least two of the following confounders known to be associated with comorbid depression: (a) gender, (b) history of depression, (c) history of other psychiatric disorder, (d) current other psychiatric disorder, (e) current use of antidepressant or psychotropic medication, (f) degree of functional impairment; (5) The sample size of patients with AD is at least as large as the median sample size of all included studies in the review (n=78).
Figure 2.2 Principles of Best Evidence Synthesis
Results
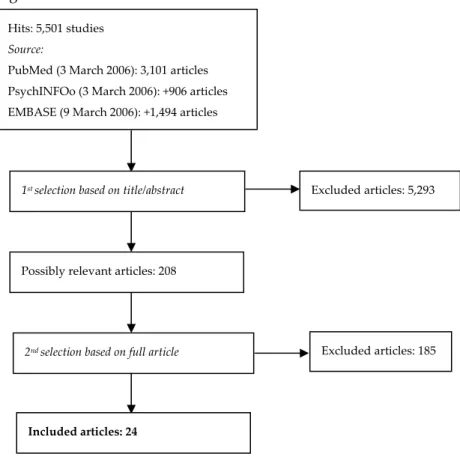
Search results and selection of studies
Figure 2.3 shows the results of each phase in the search method and
selection of studies.
Searching the specified databases according to the strategy described above
resulted in 5,501 hits. Of these, 208 articles were judged by the first author to
be possibly relevant on the basis of titles and abstracts. Based on full articles
found, the first two authors agreed that 21 studies met the five inclusion
criteria. A screening of reference lists of all 208 articles resulted in the
inclusion of three additional studies. Of the total of 24 included studies, 19
reported results of analyses on the relationship between severity of AD and
prevalence of depressive symptoms (continuous approach) and seven on the
association between severity of AD and prevalence of diagnosed depression
(categorical approach). Two studies used both approaches.
Evidence: Provided by consistent outcomes in at least 75% of the studies with a quality score of three or more. Insufficient evidence: If less than 75% of the studies with a quality score of three or more have consistent outcomes. Or If no studies received a quality score of three or more.
Figure 2.3 Results of database searches and selection methods Data extraction
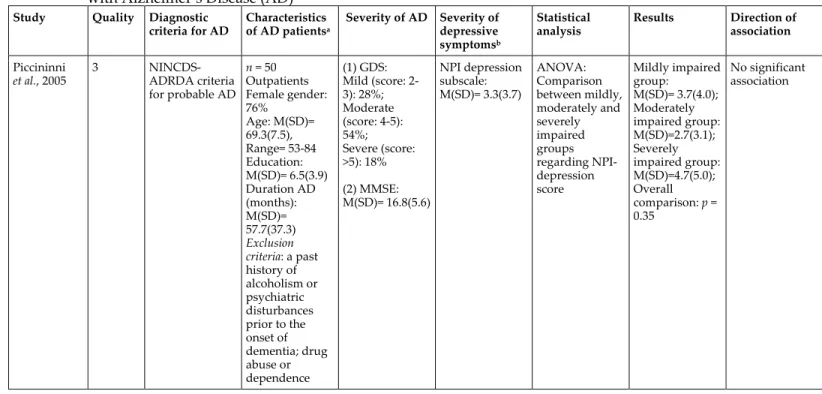
The extracted data and quality rating of each included study are presented
in table 2.1 (continuous approach) and 2.2 (categorical approach). Studies
were ordered by their methodological quality rating. The 19 ‘continuous’
studies included 34 (sub‐)studies, and the seven ‘categorical’ studies
included nine (sub‐)studies.
Hits: 5,501 studies Source: PubMed (3 March 2006): 3,101 articles PsychINFOo (3 March 2006): +906 articles EMBASE (9 March 2006): +1,494 articles 1st selection based on title/abstract Possibly relevant articles: 208 Excluded articles: 5,293 2nd selection based on full article Excluded articles: 185 Included articles: 24
Table 2.1 Studies on the association between severity of dementia and prevalence of depressive symptoms in patients
with Alzheimer’s Disease (AD)
Study Quality Diagnostic criteria for AD Characteristics of AD patientsa Severity of AD Severity of depressive symptomsb Statistical analysis Results Direction of association Piccininni et al., 2005 3 NINCDS‐ ADRDA criteria for probable AD n = 50 Outpatients Female gender: 76% Age: M(SD)= 69.3(7.5), Range= 53‐84 Education: M(SD)= 6.5(3.9) Duration AD (months): M(SD)= 57.7(37.3) Exclusion criteria: a past history of alcoholism or psychiatric disturbances prior to the onset of dementia; drug abuse or dependence (1) GDS: Mild (score: 2‐ 3): 28%; Moderate (score: 4‐5): 54%; Severe (score: >5): 18% (2) MMSE: M(SD)= 16.8(5.6) NPI depression subscale: M(SD)= 3.3(3.7) ANOVA: Comparison between mildly, moderately and severely impaired groups regarding NPI‐ depression score Mildly impaired group: M(SD)= 3.7(4.0); Moderately impaired group: M(SD)=2.7(3.1); Severely impaired group: M(SD)=4.7(5.0); Overall comparison: p = 0.35 No significant association
‐ table 2.1 continued ‐
Study Quality Diagnostic criteria for AD Characteristics of AD patientsa Severity of AD Severity of depressive symptomsb Statistical analysis Results Direction of association Harwood et al., 2000a 3 NINCDS‐ ADRDA criteria for possible or probable AD n = 114 Outpatients Female gender: 63% Age: M(SD)= 78.8(6.5), Range= 59‐92 Education: M(SD)=11.9(3.5); Range= 2‐20 Hispanic: 44% Duration AD: M(SD)= 3.4(2.5); Range= 1‐11 MMSE: M(SD)= 17.8(7.2) RMBPC 9‐item depression scale: M(SD)= 8.4(7.8) Pearson correlation between RMBPC and MMSE scores r= 0.02, n.s. No significant association Harwood et al., 1998 3 NINCDS‐ ADRDA criteria for probable AD n = 137 Outpatients Female gender: 70% Age: M= 78.2, Range= 63‐95 Education: M= 10.4, Range= 0‐ 20 Hispanic: 50.4% Duration AD: M= 4.1; Range= 0‐14 MMSE: M=15.6, Range= 0‐29 CSDD: M= 5.2, Range= 0‐25; Mild (score: 8‐ 12): 9.5%; Moderate (score: >12): 11.7% Pearson correlation between CSDD and MMSE scores r= ‐0.25, p < 0.01 More severe depressive symptoms in more severe AD
‐ table 2.1 continued ‐
Study Quality Diagnostic criteria for AD Characteristics of AD patientsa Severity of AD Severity of depressive symptomsb Statistical analysis Results Direction of association Brodaty and Luscombe, 1996 3 & 2c NINCDS‐ ADRDA criteria for AD n = 208 Outpatients Total sample of patients with dementia (n = 288)d: Female gender: 55% Age: M(SD)=71.4(7.7) Education: M(SD)=9.7(3.4) Total sample of patients with dementia d: (1) MMSE: M(SD)= 18.2(7.2); Mild (score: ≥22); Moderate (score: <22) (2) CDR: score 0.5: 30.0%; score 1: 48.3%; score 2: 15.7%; score 3: 6.0% HDRS (21‐item version): M(SD)= 6.7(5.3)e Total sample of patients with dementiad: MDD (DSM‐IV criteria): 6.3% (1) Spearman correlations with Bonferroni correction between (a) HDRS and MMSE scores; (b) HDRS and CDR scores (2) t test: comparison between mildly and moderately impaired groups (based on MMSE) regarding HDRS scores (1a) significant negative correlation; (1b) n.s. (2) mildly impaired group had a significantly lower HDRS score (1a&2) More severe depressive symptoms in more severe AD (1b) No significant association Müller‐ Thomsen et al ., 2005 2 NINCDS‐ ADRDA criteria for probable AD n = 316f Outpatients Patients with MMSE ≥18 (n = 157): Female gender: 65% Age: M(SD)= 72.7(8.7) Patients with MMSE<18 (n = 159): MMSE: Mild (score: ≥18): 49.7%; Moderate‐ severe (score: <18): 50.3% Mild: M(SD)= 22.3(2.8); Moderate‐ severe: M(SD)= 11.6(4.4) (1) GDS (15‐ item version) (2) MADRS (3) CSDD ANOVAs: Comparison between mildly and moderately‐ severely impaired groups (based on MMSE) regarding: (1) GDS score (2) MADRS score A: Mildly impaired group B: Moderately‐ severely impaired group (1) A(n = 140): M(SD)= 4.5(3.3); B(n = 101): M(SD)= 4.6(2.6), n.s. (1‐3) No significant association
‐ table 2.1 continued ‐
Study Quality Diagnostic criteria for AD Characteristics of AD patientsa Severity of AD Severity of depressive symptomsb Statistical analysis Results Direction of association Female gender: 74% Age: M(SD)= 72.6(9.0) (3) CSDD score (2) A(n = 120): M(SD)= 10.1(6.7); B(n = 76): M(SD)= 12.8(8.8), p < 0.10 (3) A(n = 31): M(SD)= 6.7(5.0); B(n = 16): M(SD)= 8.1(5.1), n.s. Levy et al., 1998 2 NINCDS‐ ADRDA criteria for probable AD n = 30 Outpatients Female gender: 63% Age: M=74, Range= 54‐85 MMSE: M(SD)= 17.5(7.0) NPI depression subscale: M(SD)= 1.2(1.6) Spearman correlation between NPI‐depression and MMSE scores Nonsignificant trend toward a negative correlation No significant association
‐ table 2.1 continued ‐
Study Quality Diagnostic criteria for AD Characteristics of AD patientsa Severity of AD Severity of depressive symptomsb Statistical analysis Results Direction of association Bungener et al., 1996 2 NINCDS‐ ADRDA criteria for possible or probable AD n = 118 Outpatients Female gender: 64% Age: M(SD)= 70.1(7.8), Range= 52‐86 Education: <6: n = 49, 7‐11: n = 38, ≥12: n = 29
Early‐onset AD:
n = 61,
Late‐onset AD:
n = 55 (1) MMSE: M(SD)=19.1(5.8); Range= 3‐29 (2) DRS: M(SD)= 104.8(20.5) (1) HDRS (17‐ item version): M(SD)= 8.1(4.6), Range= 0‐22 (2) RRS: M(SD)= 9.3(4.0), Range= 3‐29 MDD (DSM‐III‐ R criteria): 0% Dysthymia (DSM‐III‐R criteria): 8.5% Pearson correlations between (1) HDRS and MMSE scores (2) HDRS and DRS scores (3) RRS and MMSE scores (4) RRS and DRS scores (1) n.s. (2) n.s. (3) r = ‐0.27, p = 0.003 (4) r = ‐0.31, p < 0.001 (1&2) No significant association (3&4) More severe depressive symptoms in more severe AD Haupt et al., 1995 2 ICD‐10 draft
criteria for mild
to moderate dementia in AD n = 78 Outpatients Female gender: 73% Age: M(SD)= 74.3(7.5), Range= 57‐90 Age at symptom onset: M(SD)= 69.4(7.3) Past history of depression: 0% Antidepressant medication within the 2‐ year study (1) MMSE (2) CAMCOG: M(SD)= 36.2(24.4) (3) GDS: score 5: 54%; score 6: 35%; score 7: 11% DMAS mood subscale: M(SD)= 14(6.6), Range= 2‐31 Correlations betweeng: (1) DMAS and MMSE scores (2) DMAS and CAMCOG scores (1) 0.02, n.s. (2) 0.04, n.s. (1&2) No significant association
‐ table 2.1 continued ‐
Study Quality Diagnostic criteria for AD Characteristics of AD patientsa Severity of AD Severity of depressive symptomsb Statistical analysis Results Direction of association period: 32%; no patient had to stay on antidepressant medication for >3 weeks Verhey et al., 1995 2 NINCDS‐ ADRDA criteria for possible or probable AD n = 48 Outpatients Female gender: 65% Age: M(SD)= 72.9(7.6) Education [1(primary school) – 7(university grade)]: 3.6(1.3) Duration AD: M(SD)= 3.28(2.4) GDS: M(SD)= 4.8(0.9); Very mild (score: 3): 8.3%; Mild (score: 4): 25.0%; Moderate (score: 5): 45.8%; Severe (score: 6): 20.8%; Very severe (score: 7): 0% HDRS (17‐item version): M(SD)= 9.4(9.4) MDD (DSM‐III‐ R criteria): 6.3% Spearman correlation between HDRS and GDS scores r = 0.04, n.s. No significant association
‐ table 2.1 continued ‐
Study Quality Diagnostic criteria for AD Characteristics of AD patientsa Severity of AD Severity of depressive symptomsb Statistical analysis Results Direction of association Feher et al., 1992 2 NINCDS‐ ADRDA criteria for probable AD n=83 Outpatients Female gender: 49% Age: M(SD)= 65.6(5.7) Education: M(SD)= 13.3(2.8) Exclusion criteria: Current psychiatric diagnosis (DSM‐III‐R criteria); HDRS score >16 MMSE: M(SD)= 19.4(2.9), Range= 12‐23 (1) HDRS (17‐ item version): M(SD)= 4.0(3.1) (2) GDS (30‐ item version): M(SD)= 7.8(5.4) Correlations between: (1) HDRS and MMSE scores; (2) GDS and MMSE scores (3) multivariate linear regression: Dependent: GDS score; (a) hierarchical: HDRS scores were entered first; followed by MMSE, memory test and self‐ awareness scores (b) simultaneous entry (1) ‐0.15, n.s. (2) ‐0.15, n.s. (3a&b) MMSE
score was not a
significant predictor of GDS score, p > 0.10 (1‐3) No significant association
‐ table 2.1 continued ‐
Study Quality Diagnostic criteria for AD Characteristics of AD patientsa Severity of AD Severity of depressive symptomsb Statistical analysis Results Direction of association Gottlieb et al., 1988 2 NINCDS‐ ADRDA criteria for probable AD n=43 Outpatients Female gender: 67% Age: M(SD)= 72.8(7.3), Range= 55‐88 Education: M(SD)= 11.9(3.6), Range= 4‐18 Exclusion criteria: evidence of other psychiatric disorder; history of significant psychiatric disorder; requiring acute psychiatric intervention at the time of initial presentation GDS: Low (score: 3‐4): 55.8% High (score: ≥5): 44.2% (1) HDRS (17‐ item version) (2) SDS t tests: Comparison between low‐ and high‐ impaired groups (based on GDS) regarding (1) HDRS score and (2) SDS score A: High‐ impaired group B: Low‐ impaired group (1) A: M(SD)= 2.2(3.0), Range=0‐10; B: M(SD)= 3.3(6.1), Range=0‐28, t < 1, n.s. (2) A: M(SD)=39.0(8.6), Range=21‐54; B: M(SD)= 36.6(8.1), Range=23‐55, t < 1, n.s. (1&2) No significant association
‐ table 2.1 continued ‐
Study Quality Diagnostic criteria for AD Characteristics of AD patientsa Severity of AD Severity of depressive symptomsb Statistical analysis Results Direction of association Weiner et al., 1997 1 NINCDS‐ ADRDA criteria for AD n=30 Outpatients Age: M(SD)=72.5(6.4), Range= 6‐28 Education: M(SD)=12.6(4.0), Range= 3‐20 MMSEh: M(SD)=17.3(6.4), Range= 6‐28 HDRS (21‐item version): (a) Patient’s report: M(SD)= 5.7(3.6), Range= 1‐12; (b) Caregiver’s report: M(SD)= 9.3(5.2), Range= 0‐21 Correlations between (1) patient’s report HDRS and MMSE scores; (2) caregiver’s report HDRS and MMSE scores (1) n.s. (2) n.s. (1&2) No significant association Fitz and Teri, 1994 1 DSM‐III‐R criteria for AD n=91 Outpatients Female gender: 55% Age: Range= 46‐ 90 DRS: M(SD)=102(18.8) , Range= 56‐139; Mild (score: <102): 50.5%; Moderate (score: >103): 49.5% HDRS (17‐item version) MDD (DSM‐III‐ R criteria): 50.5% (1) Pearson correlation between HDRS and DRS scores (2) Comparison between mildly and moderately impaired groups (based on DRS) regarding HDRS score (1&2) n.s. (1&2) No significant association
‐ table 2.1 continued ‐
Study Quality Diagnostic criteria for AD Characteristics of AD patientsa Severity of AD Severity of depressive symptomsb Statistical analysis Results Direction of association Troisi et al., 1993 1 NINCDS‐ ADRDA criteria for probable AD n = 26 Outpatients Female gender: 54% Age: M(SD)= 74.0(5.5), Range= 65‐84 Education: M(SD)=7.15(5.0), Range= 0‐19 (1) MMSE: mild‐moderate (score: 16‐23): 50%; severe (score: ≤15): 50% (2) DSM‐III‐R: Mild: 26.9%; Moderate: 42.3%; Severe: 30.8% HDRS (17‐item version): Mild‐moderate (score: 10‐16): 30.8%; Marked (score: ≥17): 7.7% MDD (DSM‐III‐ R criteria): 23.1% ANOVA and PLSD posthoc tests: (1) comparison between mildly‐ moderately and severely impaired groups (based on MMSE) regarding HDRS score (2) comparison between mildly, moderately and severely impaired groups (based on DSM‐III‐R) regarding HDRS score (1) Overall comparison: p < 0.05 Posthoc comparison: severely impaired group had significantly higher HDRS score than mildly‐ moderately impaired group (p < 0.05) 2) Overall comparison: p = 0.01 Posthoc comparisons: severely impaired group had significantly higher HDRS score than mildly (p < 0.01) and moderately impaired (p < 0.05) groups (1&2) More severe depressive symptoms in more severe AD
‐ table 2.1 continued ‐
Study Quality Diagnostic criteria for AD Characteristics of AD patientsa Severity of AD Severity of depressive symptomsb Statistical analysis Results Direction of association Sultzer et al., 1992 1 NINCDS‐ ADRDA criteria for probable AD n = 61 Outpatients (majority) and inpatients Female gender: 5% Age: M(SD)=73.0(7.8), Range= 53‐88 Education: M(SD)= 13.0(3.2), Range= 7‐20 Duration: M(SD)= 5.8(3.7), Range= 1‐20 Exclusion criteria: history of psychotic disorder prior to onset of dementia; evidence of psychoactive substance use MMSE: M(SD)= 10.0(8.5), Range= 0‐28 HDRS (17‐item version): M= 10.3, Range= 1‐22 Pearson correlation between HDRS and MMSE scores r = ‐0.38, p = 0.003 More severe depressive symptoms in more severe AD
‐ table 2.1 continued ‐
Study Quality Diagnostic criteria for AD Characteristics of AD patientsa Severity of AD Severity of depressive symptomsb Statistical analysis Results Direction of association Fischer et al., 1990 1 NINCDS‐ ADRDA criteria for probable AD n = 55 Inpatients Female gender: 87% Age: M(SD)=79.4(8.8), Range= 58‐93 No patient received antidepressants at the time of investigation or for 2 weeks previously MMSE: M(SD)= 11.5(9.1), Range= 0‐23; Mild (score: 16‐ 23): 41.8%; Moderate (score: 6‐15): 23.6%; Severe (score: <6): 34.5% HDRS (17‐item version): M(SD)= 12.4(5.8), Range= 2‐27 (1) Kruskal‐
Wallis rank test:
comparison between mildly, moderately and severely impaired groups (based on MMSE) regarding HDRS score (2) Spearman correlation between HDRS and MMSE scores (1) Mildly impaired group: M(SD)= 13.1(6.5); Moderately impaired group: M(SD)= 14.3(5.2); Severely impaired group: M(SD) = 9.9(3.9) Overall comparison: p < 0.05 (2) r = 0.27, p < 0.05 (1&2) Less severe depressive symptoms in more severe AD Shuttleworth et al., 1987 1 NINCDS‐ ADRDA criteria for AD n = 22 Outpatients Female gender: 59% Age: M= 67.1 Education: M= 14.5 MMSE: Mild (score: 20‐ 25): 31.8%; Moderate (score: 15‐19): 36.4%; Severe (score: 5‐ 14): 31.8% SDS: M= 41.2 MDD (DSM‐III criteria): 41% ANOVA: comparison between mildly, moderately and severely impaired groups (based on MMSE) regarding SDS score Mildly impaired group: M= 41.4; Moderately impaired group: M= 41.6; Severely impaired group: M= 40.6; Overall comparison: F= 0.98, d.f. = 2 and 19, n.s. No significant association
‐ table 2.1 continued ‐
Study Quality Diagnostic criteria for AD Characteristics of AD patientsa Severity of AD Severity of depressive symptomsb Statistical analysis Results Direction of association Galynker et al., 1995 0 DSM‐III‐R criteria for AD n = 26 Outpatients Female gender: 58% Age: M(SD)=78.8(6.45 ), Range 63‐89 Antipsychotic medication: 26.9% Benzodiazepine s: 23.1% Antidepressants : 15.4% MMSE: M(SD)=16.8 (7.52), Range= 1‐ 28 HDRS (17‐item version): M(SD)= 10.5(5.73), Range= 2‐24 Pearson correlation with Bonferroni correction between HDRS and MMSE scores r = ‐0.33, n.s. No significant association Teri and Wagner, 1991 0 DSM‐III‐R criteria for AD n = 75 Outpatients Female gender: 68% Age: M(SD)=74.0(7.4), Range= 46‐89 Education: ≤12th grade: 72%, >12th grade: 28% (1)MMSE: M(SD)= 18.1(5.7), Range= 4‐27; Mild (score: >21): 30.7%; Moderate (score: 21‐16): 37.3%; Severe (score: <16): 32.0% (2) GDS: M(SD)=4.6(1.0), Range= 2‐6 HDRS (17‐item version): (a) patient’s report: M(SD)= 5.0(5.2), Range= 0‐26 ; (b) caregiver’s report: M(SD)= 7.6(6.9), Range= 0‐30; (c) clinician’s evaluation: M(SD)= 8.2(6.9), Range= 0‐30 MDD (DSM‐III‐ R criteria): 29% 3(source) x 3(severity of AD) repeated measures MANOVA: Dependent: HDRS score; Severity of AD: mild, moderate, severe (based on MMSE); Source: patient, caregiver or clinician No significant effect of severity of AD No significant association
Note: NINCDS‐ADRDA= National Institute of Neurological and Communicative Diseases and Stroke‐Alzheimer’s Disease and Related Disorders
Association (McKhann et al., 1984); GDS= Global Deterioration Scale (Reisberg et al., 1982); MMSE= Mini‐Mental State Examination (Folstein et al., 1975);
NPI= Neuropsychiatric Inventory (Cummings et al., 1994); RMBPC= Revised Memory and Behavior Problem Checklist (Teri et al., 1992); n.s.= not
significant; CSDD= Cornell Scale for Depression in Dementia (Alexopolous et al., 1988); CDR= Clinical Dementia Rating Scale (Morris, 1993); HDRS=
Hamilton Depression Rating Scale (Hamilton, 1960; Williams, 1988); MDD= major depressive disorder; DSM= Diagnostic and Statistical Manual of
Mental Disorders, third revised (DSM‐III‐R) or fourth (DSM‐IV) edition (American Psychiatric Association, 1987, 1994); GDS= Geriatric Depression Scale
(Yesavage et al., 1983; Sheikh & Yesavage, 1986); MADRS= Montgomery and Åsperg Depression Scale (Montgomery & Åsberg, 1979); DRS= Mattis
Dementia Rating Scale (Mattis, 1976); RRS= Retardation Rating Scale (Widlöcher, 1983); ICD‐10= International Classification of Diseases, tenth edition
(World Health Organization, 1987); CAMCOG= Cambridge Cognitive Examination (Roth et al., 1986); DMAS= Dementia Mood Assessment Scale
(Sunderland et al., 1988); SDS= Zung Self‐Rating Depression Scale (Zung, 1965); PLSD= Fisher’s Protected Least Significant Difference; d.f.= degrees of
freedom.
a Data concerning education and duration of AD are presented in years, unless stated otherwise. Only psychiatric exclusion criteria are presented. b If available data on prevalence of major depression or dysthymia are also presented.
c This study had two different quality scores because separate analyses were performed using scores on different scales to assess severity of AD. d No (further) data concerning the sample of patients with AD were reported.
e Missing data for 6 patients, n = 202.
f Depression scales were not performed in every patient with AD for various reasons. g Results concern those at baseline.
Table 2.2 Studies on the association between severity of dementia and prevalence of diagnosed depression in patients
with Alzheimer’s Disease (AD)
Study Quality Diagnostic
criteria for AD Characteristics of AD patientsa Severity of AD Prevalence of depressionb Statistical analysis Results Direction of association Harwood et al., 2000b 3 NINCDS‐ ADRDA criteria for possible or probable AD n = 96 Outpatients Female gender: 70% Age: M(SD)= 74.9(6.8) Education: M(SD)= 9.9(5.2) Cuban American: 100% Functional status (BDS): M(SD)= 5.8(4.2) Presence of delusions/hal‐ lucinations: 32.3% MMSE: M(SD)= 15.9(6.5) Depression (CSDD score: ≥7): 39.6% CSDD (all AD patients): M(SD)= 7.4(6.9), Range= 0‐28 Multivariate logistic regression: Dependent: depression (0/1); Independent: MMSE score; Covariates: age, education, gender, marital status, functional status and psychosis OR(95% CI)= 0.9 (0.9‐1.0), p = 0.25 No significant association
‐ table 2.2 continued ‐
Study Quality Diagnostic
criteria for AD Characteristics of AD patientsa Severity of AD Prevalence of depressionb Statistical analysis Results Direction of association Lyketsos et al., 1997 3 NINCDS‐ ADRDA criteria for probable AD n = 109 Outpatients Female gender: 79% Age: M(SD)= 74.4(7.9) History of depressive disorder: 17.4%. (1) CDR: Early (score: 0.5): 9.8%; Mild (score: 1): 38.2%; Moderate (score: 2): 29.4%; Severe (score: 3): 21.6% (2) MMSE: M(SD)= 15.0(6.5), Range= 0‐28 (a) MDD (DSM‐IV criteria): 22%; (b) Minor depression (depressed mood, crying spells, or anhedonia according to CSDD and CSDD score: >6): 27%; (c) remaining patients: 51% CSDD (all AD patients): M(SD)= 8.0(7.2), Range= 0‐28 Chi‐square test: Distribution of the 3 depression groups across CDR scores χ2= 5.86, d.f.= 4, p = 0.21 No significant association
‐ table 2.2 continued ‐
Study Quality Diagnostic
criteria for AD Characteristics of AD patientsa Severity of AD Prevalence of depressionb Statistical analysis Results Direction of association Ballard et al., 1996 3 NINCDS‐ ADRDA criteria for possible or probable AD n = 88 Outpatients Total sample of patients with dementia (n = 124)c: Female gender: 73% Age: M= 79.6 Exclusion criteria: fulfilment of the CAMDEX criteria for severe dementia CAMCOG: Total sample of patients with dementiac: M= 43.9 MDD (depressive symptoms were rated using the CSDD; next, diagnosis was made according to the RDC criteria): 17.0% CSDD (all AD patients): M= 9.2 Bivariate logistic regression: Dependent: depression (0/1); Independent: CAMCOG score Wald chi‐ square test= 0.63, p = 0.43 No significant association Lopez et al., 2003 2 NINCDS‐ ADRDA criteria for probable AD n = 1,155 Outpatients Female gender: 70% Education: M(SD)= 12.0(3.0) Duration AD: M(SD)= 4.0(2.7) African Americans: 6.3% BDS: M(SD)= 6.1(4.2) (1) MMSE: M(SD)=16.9 (6.1); Mild (score: ≥20): 37.9%; Moderate (score: 10‐19): 48.7%; Severe (score: ≤9): 13.3% (2) DRS: M(SD)= 107.4(22.9) MDD (depressive symptomatolo‐ gy was rated using the BRSD, HDRS and BDS; next, diagnosis was made according to DSM‐III/ ‐III‐R/ ‐IV criteria): 17.0% Chi‐square test: Comparison between mildly, moderately and severely impaired groups (based on MMSE) regarding frequency of MDD MDD: Mildly impaired group: 11.5%; Moderately impaired group: 10.0%; Severely impaired group: 4.5%; χ2= 6.03, d.f.= 2, p = 0.04 Lower likelihood of depression in more severe AD
‐ table 2.2 continued ‐
Study Quality Diagnostic
criteria for AD Characteristics of AD patientsa Severity of AD Prevalence of depressionb Statistical analysis Results Direction of association Anti‐ depressants: 19.0% Sedatives, hypnotics and anxiolytics: 6.3% Antipsychotics: 7.7% (3) CDR: M(SD)= 1.3(6.8) HDRS (all AD patients; 17‐ item version): M(SD)= 6.4(4.4) Payne et al., 1998 2 NINCDS‐ ADRDA criteria for possible or probable AD n = 151 Outpatients Female gender: 81% Age: M(SD)=78.1 (7.9) Caucasian: 80.7% Functional status (PGDRS‐ P): M(SD)= 7.5(7.5) MMSE: M(SD)=14.7 (7.3) Depression (CSDD score: >12): 17% CSDD (all AD patients): M(SD)= 6.6(6.1), Range= 0‐25 (1) bivariate logistic regression: Dependent: depression (0/1); Independent: MMSE score (2) multivariate logistic regression: Covariate: functional status (1) OR(95% CI)= 1.03 (0.97‐1.09) (2) OR(95% CI)= 1.09 (1.01‐1.19) (1) No significant association (2) Lower likelihood of depression in more severe AD
‐ table 2.2 continued ‐
Study Quality Diagnostic
criteria for AD Characteristics of AD patientsa Severity of AD Prevalence of depressionb Statistical analysis Results Direction of association Fitz and Teri, 1994 1 DSM‐III‐R criteria for AD n = 91 Outpatients Female gender: 55% Age: Range: 46‐90 DRS: M(SD)= 102(18.8), Range= 56‐139; Mild (score: <102): 49.5%; Moderate (score: >103): 50.5% MDD (DSM‐ III‐R criteria): 50.5% Comparison between mildly and moderately impaired groups (based on DRS) regarding frequency of MDD MDD: Mildly impaired group: 56.5%; Moderately impaired group: 44.4%; n.s. No significant association Troisi et al., 1993 1 NINCDS‐ ADRDA criteria for probable AD n = 26 Outpatients Female gender: 54% Age: M(SD)= 74.0(5.53), Range= 65‐84 Education: M(SD)=7.15 (5.03), Range= 0‐19 (1) MMSE: mild‐moderate (score: 16‐23): 50%; severe (score: ≤15): 50% (2) DSM‐III‐R: Mild: 26.9% Moderate: 42.3% Severe: 30.8% MDD (DSM‐ III‐R criteria): 23.1% Chi‐square tests: (1) comparison between control, mildly‐ moderately and severely impaired groups (based on MMSE) regarding frequency of MDD (2) comparison between control, mildly, moderately and severely impaired (1) MDD: mildly‐ moderately impaired group: 7.7%; severely impaired group: 38.5%; control group: 11.5%; χ2= 5.51, d.f.= 2, p = 0.06 (2) MDD: Mildly impaired group: 0%; Moderately impaired group: 11.5%; Severely (1&2) No significant association