ANTHROPOGENIC INFLUENCES ON SOIL MICROBIAL PROPERTIES
by
DOROTHY MENEFEE
B.S, Kansas State University, 2013
A THESIS
Submitted in partial fulfillment of the requirements for the degree
MASTER OF SCIENCE
Department of Agronomy College of Agriculture
KANSAS STATE UNIVERSITY Manhattan, Kansas
2016
Approved by: Major Professor Ganga M. Hettiarachchi
Copyright
DOROTHY MENEFEEAbstract
Human activities have the potential to alter soil biochemical properties in a number of different ways. This thesis will focus on how agricultural practices (tillage and cropping system), climate change, and urban soil pollution (primarily lead and arsenic) affect soil biochemical properties. Two incubation studies were conducted to determine how human activities influence soil biochemical properties. The first study focused on how altered temperature and moisture regimes affected soil properties from four different agroecosystems. Four different soils were incubated under two different soil preparation methods (sieved <4mm and <0.25 mm), three different temperature treatments (12, 24, and 36°C), and two different moisture treatments (field capacity and 80% of field capacity) for 180 days. Destructive samples were taken at 7, 30, 60, 120, and 180 days and the soil microbial community was analyzed using phospholipid fatty acid analysis (PLFA). The second study investigated how soil amendment treatments (Mushroom Compost and Composted Biosolids) of an industrially contaminated site affected the biochemical properties of that soil. Surface soil samples collected 435 days after compost addition from urban garden test plots located adjacent to a former rail yard in Monon, Indiana. Soils were incubated for 30 days to stimulate microbial activity. Following incubation, the soil was analyzed for PLFA, soil enzymes, and available metal fractions. In the first study the greatest differences were found between the <4mm and the <0.25 mm size fractions – which highlights the effect of soil aggregation and structure on microbial populations. After aggregation effects, temperature treatment had the next largest effect on microbial populations, with the greatest biomass in the middle (24°C) treatment. The second study assessed different soil amendments on soil microbial properties and metal availability. Composted biosolids reduced metal availability and increased microbial enzyme activity and biomass.
iv
Table of Contents
List of Figures ... vii
List of Tables ... xiii
List of Abbreviations ... xv
Acknowledgements ...xvi
Chapter 1 - The Effects of Human Influence on Soil Microbial Properties – an Introduction ...1
Climate Change and Soil Carbon ...1
Soil Contamination and Agriculture ...4
References ...7
Chapter 2 - Literature Review ... 10
Soil Contamination Issues ... 30
Scope and Risks ... 30
Lead ... 30
Arsenic ... 34
Cadmium ... 36
Polycyclic Aromatic Hydrocarbons (PAH’s) ... 39
Other Contaminants ... 41
Fate and Transport ... 42
Lead ... 42
Arsenic ... 44
Cadmium ... 45
Polycyclic Aromatic Hydrocarbons ... 46
Other Contaminants ... 47 Bioavailability ... 48 Lead ... 48 Arsenic ... 50 Cadmium ... 52 PAH’s ... 54
v Lead ... 56 Arsenic ... 58 Cadmium ... 59 PAH’s ... 59 References ... 61
Chapter 3 - Understanding Biochemical Contributions to the Resilience of Sequestered Soil Organic Carbon in Soils from Contrasting Agroecosystems... 90
Abstract... 90
Introduction... 92
Materials and Methods ... 93
Results and Discussion ... 96
Total Biomarkers ... 96
Fungi ... 100
Actinomycetes ... 102
Gram Positive Bacteria ... 105
Gram Negative Bacteria ... 108
Total Bacteria ... 110 Conclusions... 112 Acknowledgements ... 113 References ... 114 Tables ... 125 Figures ... 132 PLFA Data ... 132 Labile C Information ... 156 Cumulative CO2 Emissions... 160
Chapter 4 - Experiment 2 – Differences in Microbial Community Structure and Enzyme Activities in a Contaminated Urban Soil Amended with Organic Matter ... 169
Abstract... 169
Introduction... 171
Materials and Methods ... 174
vi
Influence of soil amendments on microbial communities ... 177
Enzyme Activity ... 180 Contaminant availability ... 182 Conclusions... 184 Acknowledgements ... 185 References ... 186 Tables ... 199 Figures ... 205
vii
List of Figures
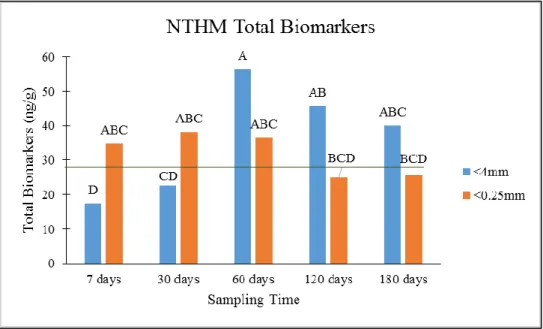
Figure 1: Total biomarker trends with CTM. Green line indicates value in initial soil. Top: Effect of sampling time * aggregation interaction. Letters indicate differences significant to p<0.05 across sampling times. Middle: Effect of sampling time * temperature interaction. Letters indicate differences significant to p<0.05 across sampling times. Bottom: Effect of moisture on total biomarkers. Letters indicate differences significant to p<0.05. ... 132 Figure 2: Total biomarker trends with NTM. Letters indicate differences significant to p<0.05
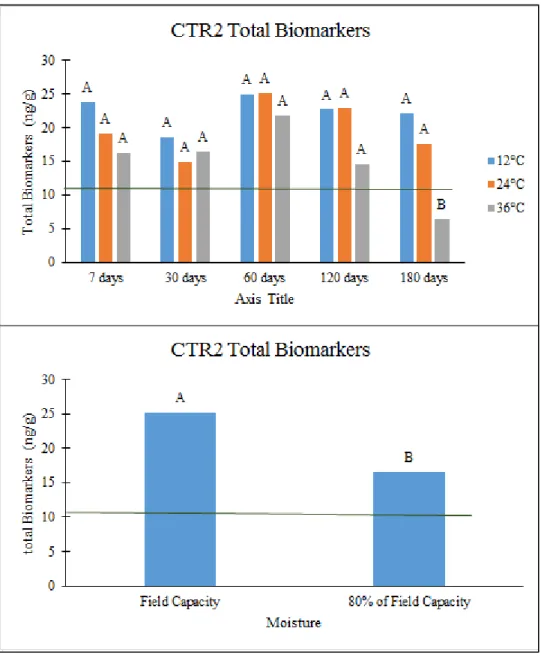
across sampling times. Green line indicates value in original soil. ... 133 Figure 3: Total biomarker trends for CTR2. Green line indicates value in initial soil. Top: Effect
of sampling time * temperature interaction. Letters indicate differences significant to p<0.05 across sampling times. Bottom: Effect of moisture. Letters indicate differences significant to p<0.05. ... 134 Figure 4: Total biomarker trends for NTR2. Green line indicates value in initial soil. Top: Effect
of temperature on total biomarkers. Letters indicate differences significant to p<0.05.
Bottom: Effect of sampling time on total biomarkers. Letters indicate differences significant to p<0.05 across sampling times. ... 135 Figure 5: Fungal biomarkers for CTM had a three way significant interaction effect. Green line
indicates value in initial soil. Left: Intact Soil; Right: Crushed. Letters indicate differences to p<0.05 across both intact and crushed soils and across all sampling times. ... 136 Figure 6: There was a significant interaction effect between sampling time and aggregation on
NTM for fungal biomarkers. Green line indicates value in initial soil. Letters indicate differences significant to p<0.05 across sampling times. ... 137 Figure 7: Effects of treatments on fungal biomarkers for CTR2. Top: Interaction effect between
sampling time and aggregation. Letters indicate differences significant to p<0.05 across sampling times. Bottom: Interaction effect between temperature and sampling time. Letters indicate differences significant to p<0.05 across sampling times. ... 138 Figure 8: Effects of treatments on fungal biomarkers for NTR2. Green lines indicate value in
initial soil. Top: Interaction effect between sampling time and aggregation. Letters indicate differences significant to p<0.05 across sampling times. Bottom: Interaction effect between
viii
aggregate and temperature. Letters indicate differences significant to p<0.05 across
temperatures. ... 139 Figure 9: Effects of treatments on CTM actinomycete biomarkers. Green lines indicate value in
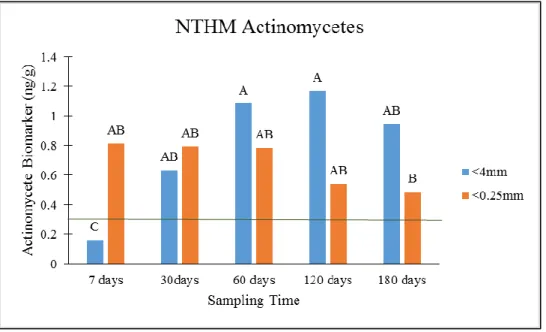
initial soil. Top: Interaction effect between sampling time and aggregation. Letters indicate differences significant to p<0.05 across sampling times. Bottom: Interaction effect between temperature and sampling time. Letters indicate differences significant to p<0.05 across sampling times. ... 140 Figure 10: Interaction effect between sampling time and aggregate on NTM actinomycete
biomarkers. Green line indicates value in original soil. Letters indicate differences
significant to p<0.05 across sampling times. ... Error! Bookmark not defined. Figure 11: Effects of treatments on actinomycete biomarkers for CTR2. Green lines indicates
value in original soil. Top: Interaction effect between temperature and sampling time. Letters indicate differences significant to p<0.05 across sampling times. Bottom: Effect of moisture; letters indicate differences significant to p<0.05. ... 142 Figure 12: Effects of treatments on actinomycete biomarkers for NTR2. Green lines indicates
value in original soil. Top: Interactive effect between temperature and sampling time on NTR2 biomarkers. Letters indicate differences significant to p<0.05 across sampling times. Bottom: Interaction effect between soil moisture and sampling time on actinomycete
biomarkers. Letters indicate differences significant to p<0.05 across sampling times. ... 143 Figure 13: Effects of treatments on gram positive bacterial biomarkers for CTM. Green lines
indicate values in original soil. Top: There was an interaction effect between sampling time and aggregation. Letters indicate differences significant to p<0.05 across sampling times. Bottom: Interaction effect between temperature and sampling time. Letters indicate
differences significant to p<0.05 across sampling times. ... 144 Figure 14: Effect of the interaction between sampling time and aggregation on gram positive
bacterial biomarkers. Letters indicate differences significant to p<0.05 across sampling times... 145 Figure 15: Effects of treatments on gram positive bacterial biomarkers for CTR2. Green lines
indicate values in original soil. Top: Interaction effect between aggregation and sampling time. Letters indicate differences significant to p<0.05 across sampling times. Middle: Interaction effect between temperature and sampling time. Letters indicate differences
ix
significant to p<0.05 across sampling times. Bottom: There was an effect of moisture on gram positive bacterial biomarkers; letters indicate differences significant to p<0.05. ... 146 Figure 16: Effect of treatments on gram positive bacterial biomarkers for NTR2. Green lines
indicate values in original soil. Top: the effect of aggregation on gram positive bacteria. Letters indicate differences significant to p<0.05 across sampling times. Bottom: The effect of temperature on gram positive bacteria. Letters indicate differences significant to p<0.05 across sampling times. ... 147 Figure 17: There was a significant three way interaction between sampling time, aggregation,
and temperature on gram negative bacterial biomarkers for CTM. Green lines indicate values in initial soil. Left: Intact Soil; Right: Crushed. Letters indicate differences to p<0.05 across both intact and crushed soils and across all sampling times. ... 148 Figure 18: There was an interaction effect between sampling time and aggregation on gram
negative bacterial biomarkers for NTM. Green line indicates value in initial soil. Letters indicate differences to p<0.05 across all sampling times. ... 149 Figure 19: There was a significant effect of aggregation on gram negative bacterial biomarkers.
Green line indicates value in initial soil. Letters indicate differences to p<0.05. ... 150 Figure 20: Effects of treatments on gram negative bacteria for NTR2. Green lines indicate
values in initial soil. Top/Middle: there was a three way interaction effect between moisture, temperature, and aggregation. Letters indicate differences to p<0.05 across both intact and crushed soils and across all sampling times. Bottom: interaction effect between temperature and sampling time. Letters indicate differences to p<0.05 across all sampling times. ... 151 Figure 21: Effects of treatments on total bacterial biomarkers for CTM. Green line indicates
value in original soil.Top: There was a significant interaction effect between sampling time and aggregation. Letters indicate differences to p<0.05 across all sampling times. Bottom: The effect of temperature and sampling time on total bacteria. Letters indicate differences to p<0.05 across all sampling times. ... 152 Figure 22: Effect of the interaction between sampling time and aggregation on bacterial
biomarkers for NTM. Green line indicates value in original soil. Letters indicate differences to p<0.05 across all sampling times. ... 153 Figure 23: The effects of treatments on total bacterial biomarkers for CTR2. Green lines indicate
x
Letters indicate differences to p<0.05 across all sampling times. Middle: Interaction effect between sampling time and temperature. Letters indicate differences to p<0.05 across all sampling times. Bottom: Effect of moisture treatment on total bacteria; letters indicate differences to p<0.05. ... 154 Figure 24: Effects of treatments on total bacterial biomarkers for NTR2. Green lines indicate
values in original soil. Top: Effect of temperature on total biomarkers. Letters indicate differences to p<0.05. Bottom: Effect of aggregation on total biomarkers. Letters indicate differences to p<0.05. ... 155 Figure 25: CTM Labile C. Top: Differences in whole v crushed soil for labile C. Bottom:
Differences across temperature treatments. Labile C was determined as permanganate oxidizeable C. Data adapted from (Pitumpe Arachchige, 2016). Letters indicate differences to p<0.05. ... 156 Figure 26: Labile C data for NTM. Top: Labile C at 7 days; Middle: Labile C at 60 days;
Bottom; Labile C at 180 days. Letters indicating significant difference carry through all three time periods (3 way interaction). Labile C was determined via permanganate
oxidizeable C. Data adapted from (Pitumpe Arachchige, 2016). ... 157 Figure 27: Labile C data for CTR2. Top: Effect of aggregation; letters indicate significant
differences to p<0.05. Bottom: Interaction between sampling time and temperature. Letters indicate differences to p<0.05 across temperature treatments. Labile C was determined via permanganate oxidizeable C. Data adapted from (Pitumpe Arachchige, 2016). ... 158 Figure 28: Labile C data for NTR2. Top & Middle: Effect of temperature, moisture, and
sampling time; letters indicate significant (to p>0.05) differences cross both figures. Bottom: Effect of aggregation; letters indicate differences to p<0.05. Labile C was determined via permanganate oxidizeable C. Data adapted from (Pitumpe Arachchige, 2016). ... 159 Figure 29: Cumulative CO2 emissions for CTM. Top: CO2 by aggregation; letters indicate
differences to p<0.05. Bottom: CO2 by temperature; letters indicate differences to p<0.05.
Data adapted from (Pitumpe Arachchige, 2016). ... 160 Figure 30: Cumulative CO2 emissions for NTM as effected by aggregation and temperature;
letters indicate differences to p<0.05 across all temperatures. Data adapted from (Pitumpe Arachchige, 2016). ... 161
xi
Figure 31: Cumulative CO2 in CTR2; effect of temperature, moisture, and aggregation. Letters
are significant (p>0.05) across both images. Data adapted from (Pitumpe Arachchige, 2016). ... 162 Figure 32: Effect of temperature and moisture on cumulative CO2 on NTR2; letters indicate
differences to p<0.05 across all temperatures. Data adapted from (Pitumpe Arachchige, 2016). ... 163 Figure 33: The effect of aggregate size on mineralogy in an Oxisol. This is from a previous study of mine using the NTR2 soil. Letters indicated differences significant to p<0.05 ... 165 Figure 34: Fungal growth in intact NTM soil. This type of growth was common in the intact
soils. ... 166 Figure 1: Relative abundance of gram positive bacteria across soil treatments. Letters indicate
significant differences at the p<0.05 level. ... 205 Figure 2: Effect of treatments on actinomycetes. Top: actinomycete relative abundance compared
to treatments. Letters indicate significant differences at the p<0.05 level. Bottom: actinomycete biomarker biomass compared to treatment. Letters indicate significant
differences at the p<0.05 level. ... 206 Figure 3: Linear relationship between actinomycetes and exchangeable Pb. This relationship is
significant to the p<0.05 level. Exchangeable Pb data is unpublished data from K-State Soil and Environmental Chemistry Laboratory ... 207 Figure 4: Relative abundance for all bacteria as compared to soil treatment. Letters indicate
significant differences at the p<0.05 level. ... 208 Figure 5: Beta-D-Glucosidase activity compared to soil treatment. Letters indicate significant
differences at the p<0.05 level. ... 209 Figure 6: Alkaline phosphatase activity compared to soil treatment. Letters indicate significant
differences at the p<0.05 level. ... 210 Figure 7: Effects of soil treatments on arylsulfatase activity. Letters indicate significant
differences at the p<0.05 level. ... 211 Figure 8: Exchangeable Pb by soil treatment. Letters indicate significant differences at the
p<0.05 level. Exchangeable Pb data is unpublished data from K-State Soil and
Environmental Chemistry Laboratory (2016) ... 212 Figure 9: Garden site map. ... 215
xii
xiii
List of Tables
Table 1: General properties for pre-incubation soils. Adapted from (Pitumpe Arachchige, 2016). ... 125 Table 2: Statistical information for total PLFA biomarkers. Data was transformed using log base
10 for statistical operations to achieve a normal distribution. Values significant to p < 0.05 are highlighted and discussed. ... 126 Table 3: Statistical information for fungal PLFA biomarkers. Data was transformed using log
base 10 for statistical operations to achieve a normal distribution. Values significant to p < 0.05 are highlighted and discussed. ... 127 Table 4: Statistical information for actinomycete PLFA biomarkers. Data was transformed using
log base 10 for statistical operations to achieve a normal distribution. Values significant to p < 0.05 are highlighted and discussed. ... 128 Table 5: Statistical information for gram positive bacterial biomarkers. Data was transformed
using log base 10 for statistical operations to achieve a normal distribution. Values
significant to p < 0.05 are highlighted and discussed. ... 129 Table 6: Statistical information for gram negative bacterial biomarkers. Data was transformed
using log base 10 for statistical operations to achieve a normal distribution. Values
significant to p < 0.05 are highlighted and discussed. ... 130 Table 7: Statistical information for total bacterial biomarkers. Data was transformed using log
base 10 for statistical operations to achieve a normal distribution. Values significant to p < 0.05 are highlighted and discussed. ... 131 Table 1: General properties of the organic amendments used in this study. Error! Bookmark not
defined.
Table 2: Properties of initial soil at the garden site by the Monon railroad in Indianapolis,
Indiana. ... 200 Table 3: Statistical information for PLFA analysis. Values that are significant to p<0.05 are
bolded and discussed. ... 201 Table 4: Statistical information for enzyme activities. Values significant to p<0.05 are
xiv
Table 5: Statistical information for available Pb. Values significant to p<0.05 are bolded and discussed. Exchangeable Pb information is unpublished data from (Gravensen, 2016). .... 203 Table 6: pH of soils; pH differences between soils were not statistically significant at p = 0.05.
... 204 Table 7: Enzyme Activity Averages ... 213
xv
List of Abbreviations
SOC: Soil Organic Carbon
NTM: KS soil managed under no-till with manure fertilizer
CTM: KS soil managed under conventional till with manure fertilizer NTR2: BR soil managed under no-till with intensive rotation
CTR2: BR soil managed under no-till with intensive rotation S1: Sampling time 1; 7 days after start of incubation
S2: Sampling time 2; 30 days after start of incubation S3: Sampling time 3; 60 days after start of incubation S4: Sampling time 4; 120 days after start of incubation S5: Sampling time 5; 180 days after start of incubation M1: Field Capacity
M2: 80% of Field Capacity T1: 12°C
T2: 24°C T3: 36°C
xvi
Acknowledgements
I could not do this thesis alone and I would like to greatly thank those that helped me along the way. First, I would like to acknowledge my advisor, Dr. Hettiarachchi, and my committee members, Dr. Rice and Dr. Kirkham as well as the rest of the KSU faculty that assisted me, in particular, Dr. Ransom, and Dr. Kluitenberg. I would like to thank Pavithra Pitumpe Arachchige for her help with running with first study and for developing the SAS codes that were used in both studies. I would also like to thank Oshadhi Athukorala Arachchige and Caleb Gravesen for helping to keep the lab running smoothly and for doing a lot of sample and glassware prep work. I appreciate Andrew McGowan for his help in running the GC-MS and with PLFA results calculations and interpretations. I would like to thank Dr. Nora Bello of the statistics department for help with developing the statistical approach used for my first study. I would like to thank Chammi Attanayake for allowing me to use her soils for my second study. I would like to thank Madhubhashini (Buddhika) Galkaduwa for helping with the GF-AAS.
1
Chapter 1 - The Effects of Human Influence on Soil Microbial
Properties – an Introduction
Climate Change and Soil Carbon
Climate change is one of the most pressing problems of this time and there are many suggested solutions and mechanisms for mitigation and adaptation, many of which involve agricultural practices. One of the major agriculture related mitigation/adaptation options to change soil management on croplands. Since the industrial revolution, burning of fossil fuels and ever more extensive changes in land management have caused global carbon dioxide
concentrations to rise from around 280 parts per million (ppm) to the present value of 401 ppm (Tans and Keeling, 2015).This rise of over 100 ppm has already correlated to an approximately 0.75 °C average change in global surface temperature (Shaftel et al., 2015). Given current emission rates, atmospheric CO2 is likely to continue to increase to over 600 ppm by 2050. This
will correlate to a 2.6 °C change in average surface temperature; which will have severe consequences for human habitation and development (Intergovernmental Panel on Climate Change, 2014). The increased amount of heat in the atmosphere is already altering climate patterns and is at least partly responsible for the recent increase in droughts and tropical storms (Shaftel et al., 2015).
Climate change and agricultural production are deeply intertwined. About 11 % of global greenhouse gas emissions are associated with land-use change (deforestation, etc.), which is often done to provide new land for agricultural production (as well as for harvesting timber) (Intergovernmental Panel on Climate Change, 2014). Additionally, about 14 % of global
2
greenhouse gas emissions are estimated to come from ongoing agricultural production (Intergovernmental Panel on Climate Change, 2014) . These emissions are partly due to decreased soil carbon stocks. A loss of soil carbon typically follows land-use change – especially when soils that are high in carbon, like native grasslands and wetlands, are tilled or drained. Soil disturbance brought on by landscape alteration and tillage practices accelerates soil carbon decomposition – releasing stored carbon back into the atmosphere as CO2. Decreasing
soil carbon (along with livestock production and rice production) is one of the major sources of agricultural greenhouse gas emissions (Intergovernmental Panel on Climate Change, 2007). Soil and crop management practices that stop and reverse the trend of declining soil carbon have the potential to play a role in the mitigation of climate change.
The reason that soil carbon stocks are important for climate change is that soil carbon constitutes a large pool in the global carbon cycle that has the potential to be a net source or sink of atmospheric CO2. Worldwide, soils store approximately 1550 Gt of carbon as organic carbon;
this is over twice that of what is currently in the atmosphere (approximately 750 Gt) (Lal, 2004a). This carbon pool is controlled by the amount of carbon inputs via plant growth and the amount of carbon mineralization to CO2 via microbial respiration. It is well understood that
increasing temperatures (i.e. from climate change) leads to an increase in metabolic rate for microorganisms. Thus, increasing temperatures have the potential to decrease soil organic carbon stocks as microbial demand for carbon substrate increases; which in turn could further
exacerbate climate change by releasing even more CO2 into atmosphere. Climate change also has
the potential to change local, regional, and global moisture regimes; which affects soil carbon stocks and soil greenhouse gas balance– although less directly. Waterlogged soils tend to have
3
more carbon stored due to slow decomposition from low oxygen; however they are also sources of methane and nitrous oxide, both of which are greenhouse gases and by products of anaerobic metabolism. Altered moisture regimes could mean previously dry soils become wetter, and previously wet soils dry. Climate change has potential to alter soil carbon balances in a number of different ways and understanding how the multiple factors add up is an important endeavor for mitigating and adapting to climate change.
While there are natural feedback loops that could cause a decline in soil organic carbon due to climate change; how we manage agricultural land still has a large impact on global soil carbon stocks. Agriculture takes up about 34% of all land on earth (Ramankutty et al., 2008). Since agricultural land makes up a significant fraction of the earth’s land surface, how that land is managed and how that management affects soil organic carbon is an important part of the global carbon cycle and thus important for addressing climate change. As a whole, agricultural soils tend to have less carbon than non-agricultural soils; due to removal of crops and residue, disturbance from cultivation/tillage, and the tendency for domestic plants to have a less vigorous root system than native plants (Lal, 2004a). However, the actual carbon stocks in agricultural soils can vary widely based on soil properties, climate, and management practices.
Soil properties, climate, and management practices all control soil carbon storage capacity in two basic ways. Soil carbon content ultimately depends on the rate of addition of plant residues and the rate of decomposition. When decomposition rate exceeds the rate of residue input, the soil loses carbon. When the rate of residue input is greater than the
4
residue input (No-till, composts, manures, cover crops, etc.) increase the amount of organic carbon being put into the soil system. Climate and management practices that affect aeration and microbial access to residue (tillage, tile drains, etc.) affect the rate of decomposition. The
purpose of this study was to observe the microbial response to changes in environment in different soil types.
Soil Contamination and Agriculture
Contamination with potentially toxic metal(loid)s and organic compounds is another major anthropogenic impact on soils. In the U.S., the problem of soil contamination is most pronounced in urban and industrial areas. Soils in these areas are often contaminated with potentially hazardous substances like lead, arsenic, and industrial compounds that stem from historical use of leaded gasoline and paints, As containing household pesticides, as well as metal processing industries (i.e. smelting).These contamination problems can have serious impacts on human and environmental health. A review of child lead poisoning cases as reported to the Center for Disease Control (indicating that blood lead concentrations were high enough to cause serious symptoms) found that between 40 and 45% of cases had no lead paint in the home – indicating that the lead likely came from ingestion or inhalation of contaminated soil or dust (Mielke et al., 1983). Humans can be exposed to lead in soils in a number of different ways. Some exposure happens through direct consumption of soil – through unwashed produce or through eating the soil directly (particularly with young children through hand-to-mouth behavior and putting soil covered toys/objects in their mouths) (World Health Organization, 2010a). There is also the risk of indirect soil exposure through produce grown in contaminated soil and through dust inhalation as soil particles become air borne (Taylor and Lovell, 2014; Tu
5
et al., 2013). Children exposed to lead are at greater risk for learning disabilities, such as ADD and ADHD, as lead damages brain tissue – which is particularly problematic for children with actively growing and maturing brains (McClintock, 2015). Arsenic is another soil contaminant that can be common in urban areas, often as a by-product of the burning of coal and petroleum as well as metal smelting and processing (Han et al., 2003). Chronic environmental exposure to arsenic has a number of potential health hazards. Chronic arsenic exposure can cause skin problems – including irritation, rashes, lesions, changes in pigmentation, and gangrene. Arsenic can cause gastrointestinal upset and peripheral neuropathy – which is nerve damage of the hands and feet that leads to numbness and weakness. In pregnant women arsenic exposure is linked to a higher risk of miscarriage and birth defects (Environmental Protection Agency, 2012; National Institute of Neurological Disorders and Stroke, 2016). Arsenic tends to accumulate in the liver and kidneys– where it causes organ damage. Lastly, arsenic is a known carcinogen and is linked cancer, particularly cancers in the lungs, liver, skin, and bladder (Environmental Protection Agency, 2012; Mandal and Suzuki, 2002). Polycyclic Aromatic Hydrocarbons (PAH’s) are a class of organic compounds that are widespread in the soils of urban areas as a result of fossil fuel burning (Li et al., 2014a). Sixteen different PAH compounds are classified as priority contaminants by the US Environmental Protection Agency due to their carcinogenic potential (Lorenzi et al., 2011).
The problems of soil contamination and pollution are worldwide problems and cause problems in human health in many regions around the world. In some areas of China, long term use of lead based pesticides have caused many of the agricultural soils to have elevated lead (Tu et al., 2013). In urban China industrial processes such as smelting and coal burning have resulted in problems with soil and road dust contamination in 65% of cities (Yang, 2010). In Canada,
6
metal smelting has caused nearby soils to have As concentrations 200 times the natural
background levels (Mandal and Suzuki, 2002). In Bangladesh soil-plant-human transfer via rice grown in As contaminated soil accounts for more than half of human As uptake (Meharg and Rahman, 2003). Soil contamination from Cd containing P fertilizers has created problems with human Cd exposure in, Australia, Sweden, Taiwan, the Netherlands, and likely many more countries around the world (Bandara et al., 2011; Franz et al., 2008; Lu et al., 2007; Satarug et al., 2003).
Urban populations are increasing rapidly and are expected to double by 2030 (Seto et al., 2012). With rising urban populations and increasing pressure on surrounding agricultural land – there is a growing trend towards urban agriculture to provide a portion of the food consumed in urban areas. Urban agriculture improves food security and provides a source of jobs – in some global cities, such as Dar Es Salaam, Tanzania – the majority of the leafy green produce (up to 90%) that is consumed in the city is also grown in the city (Halloran and Magid, 2013; Taylor and Lovell, 2014). Urban agriculture improves distribution of quality nutrition by providing people in inner-city areas with access to fresh produce that is not always available. Urban agriculture has been practice for millennia – particularly in poorer regions. In the United States, urban agriculture is still fairly new but growing. Currently it is estimated by the U.S. Census that about 6% of U.S. farmland and 14% of US farms are in cities (Lee-Smith, 2010; Rogus and Dimitri, 2015). However in many urban areas, soil contamination is a prevalent issue – 88% of gardens in Boston, USA, were contaminated with lead (Taylor and Lovell, 2014). It is important to work with the soils in urban areas as well as agricultural areas to ensure healthy ecosystem function and the production of healthy food.
7
References
Bandara, J.M.R.S., H.V.P. Wijewardena, Y.M.A.Y. Bandara, R.G.P.T. Jayasooriya and H. Rajapaksha. 2011. Pollution of river Mahaweli and farmlands under irrigation by cadmium from agricultural inputs leading to a chronic renal failure epidemic among farmers in NCP, Sri Lanka. Environmental Geochemistry and Health 33:439-453. Dr. Pieter Tans, Dr. Ralph Keeling. 2015. Trends in atmospheric carbon dioxide. 2015 Environmental Protection Agency. 2012. Arsenic compounds.
Franz, E., L. Van Raamsdonk, D.F. Van and P. Römkens. 2008. A chain modeling approach to estimate the impact of soil cadmium pollution on human dietary exposure. J. Food Prot. 71:2504-2513.
Halloran, A. and J. Magid. 2013. Planning the unplanned: Incorporating agriculture as an urban land use into the dar es salaam master plan and beyond. Environment & Urbanization 25:541-558.
Han, F., Y. Su, D. Monts, M. Plodinec, A. Banin and G. Triplett. 2003. Assessment of global industrial-age anthropogenic arsenic contamination. Naturwissenschaften 90:395-401. Intergovernmental Panel on Climate Change. 2014. Climate change 2014 synthesis report. Rep.
5th. IPCC, Geneva, Switzerland.
Intergovernmental Panel on Climate Change. 2007. 3.5. Scenarios of the 21st century. 2015. Lal, R. 2004. Soil carbon sequestration impacts on global climate change and food security.
Science 304:1623-1627.
Lee-Smith, D. 2010. Cities feeding people: An update on urban agriculture in equatorial Africa. Environ. Urban. 22:483-499.
8
Li, K., T. Chen, X. Bi and Q. Wang. 2014. Soil contamination by polycyclic aromatic hydrocarbons at natural recreational areas in Delaware, USA. Environmental Earth Sciences 72:387-398.
Lorenzi, D., J.A. Entwistle, M. Cave and J.R. Dean. 2011. Determination of polycyclic aromatic hydrocarbons in urban street dust: Implications for human health. Chemosphere 83:970-977.
Lu, L., I. Chang, T. Hsiao, Y. Yu and H. Ma. 2007. Identification of pollution source of cadmium in soil: Application of material flow analysis and a case study in Taiwan. Environmental Science and Pollution Research International 14:49-59.
Mandal, B.K. and K.T. Suzuki. 2002. Arsenic round the world: A review. Talanta 58:201-235. McClintock, N. 2015. A critical physical geography of urban soil contamination. Geoforum
65:69-85.
Meharg, A.A. and M.M. Rahman. 2003. Arsenic contamination of Bangladesh paddy field so implications for rice contribution to arsenic consumption. Environmental Science & Technology 37:229-234.
Mielke, H.W., J.C. Anderson, K.J. Berry, P.W. Mielke, R.L. Chaney and M. Leech. 1983. Title Am. J. Public Health 73:1366.
National Institute of Neurological Disorders and Stroke. 2016. Peripheral neuropathy fact sheet. Ramankutty, N., A.T. Evan, C. Monfreda and J.A. Foley. 2008. Farming the planet: Geographic
distribution of global agricultural lands in the year 2000. Global Biogeochemical Cycles. 22.
Rogus, S. and C. Dimitri. 2015. Agriculture in urban and peri- urban areas in the united states: Highlights from the census of agriculture. 30:64-78.
9
Satarug, S., J.R. Baker, S. Urbenjapol, M. Haswell-Elkins, P.E.B. Reilly, D.J. Williams and M.R. Moore. 2003. A global perspective on cadmium pollution and toxicity in
non-occupationally exposed population. Toxicol. Lett. 137:65-83.
Seto, K., B. Güneralp and L. Hutyra. 2012. Global forecasts of urban expansion to 2030 and direct impacts on biodiversity and carbon pools. Proc. Natl. Acad. Sci. U. S. A. 109:16083.
Shaftel, H., R. Jackson and A. Jenkins. 2015. NASA: Climate change and global warming. Taylor, J.R. and S.T. Lovell. 2014. Urban home food gardens in the global north: Research
traditions and future directions. Agriculture and Human Values 31:285-305.
Tu, C., T. He, C. Liu and X. Lu. 2013. Effects of land use and parent materials on trace elements accumulation in topsoil. J. Environ. Qual. 42:103-10.
World Health Organization. 2010. Childhood lead poisoning. WHO, Geneva, Switzerland. Yang, L. 2010. A review of heavy metal contaminations in urban soils, urban road dusts and
10
Chapter 2 - Literature Review
The Significance of Soil Carbon Storage
Soil carbon storage is significant because of large amount of carbon stored in the soils and the connection of that carbon to the carbon in the atmosphere, which is a major greenhouse gas. Soils store approximately 1550 Gt of organic carbon (compared to the 750 Gt in the
atmosphere) (Lal, 2004b). Practices that reduce soil carbon storage (thus converting soil organic carbon into atmospheric CO2) have been a major driver of anthropogenic climate change.
Improving practices to improve soil carbon storage in agricultural lands can be an effective mitigation strategy for climate change (Lal, 2004a).
In addition to its significance with regards to anthropogenic climate change, soil carbon influences a whole host of soil biochemical and physical properties. Increased soil carbon is known to improve soil aggregate stability and thus increase water infiltration rate and soil water retention. Soil organic carbon, like soil colloids, has active charge sites where soil cations and anions can be adsorbed. While soil clays tend to have just negatively charged sites, organic carbon also has positively charged sites. Organic carbon also has functional groups that interact with soil minerals and ions in solution. Despite being a small fraction of the soil, organic carbon is significant in soil chemical processes Soil organic carbon, through decomposition, is also a source of nutrients and substrate to plants and soil microorganisms (Brady and Weil, 2010). Since soil organic carbon has a net beneficial impact on soil properties and the capacity of soils to support plant life, practices that increase soil carbon – or at least minimize its loss are
11
storage to mitigate climate change is a benefit for environmental protection and for increased crop production.
Drivers of Soil Carbon Storage
Temperature
One of the major driving controls of soil carbon storage is the ambient temperature. Rising temperatures increase the reaction rate of chemical processes; which includes those in and controlled by organisms (Davidson and Janssens, 2006a). Microorganisms, to a general extent, increase their metabolic respiration rate in response to increasing temperatures. This increase in respiration rate leads to a greater demand for carbon compounds as a food source from
decomposers; which over time could deplete soil carbon stocks. Theoretically, this would lead to a universal decrease in soil carbon content which would cause further emissions of CO2 from the
soils – creating a positive feedback loop to climate change. The positive feedback loop is especially alarming in boreal and tundra regions where permafrost and water-logged conditions lock up large amounts of carbon. Because of this, most climate change models include the effect of rising temperatures on SOC stocks (Schlesinger and Andrews, 2000). While it is generally understood that there will likely be a decrease in SOC following an increase in global
temperatures, there are situations where this trend might not occur as predicted. Modeled predictions might not be completely accurate. For example, in some localized areas an increase in primary productivity due to elevated temperatures (or another aspect of climate change) could offset any increases in decomposition. This has been observed in situ in low-SOC mineral soils in very cold climates (i.e. montane soils) (Davidson and Janssens, 2006b; Lavigne et al., 2003). In order to better understand how climate change will affect soil ecosystems – including potential feedback loops and effects on agricultural production – it is important to have a solid
12
understanding of how the various aspects of soil carbon is affected by climate change and increasing temperatures.
Multiple studies have found that not all soil carbon compounds respond the same way to increasing temperatures (Davidson and Janssens, 2006a; Erhagen et al., 2013a; Schindlbacher et al., 2010). Simpler and more easily consumed compounds are removed from soil rapidly upon increasing temperatures; while more recalcitrant ones often remain (Davidson and Janssens, 2006a). Some compounds are more sensitive to increasing temperatures than others due to the intrinsic nature of their chemical structure; while others are more sensitive to increasing temperature because they are the main substrate for microorganisms. Recalcitrant soil C (i.e. humic substances) tends to be more chemically sensitive to changes in temperature. While recalcitrant C is typically less chemically stable under elevated temperatures, it is not the preferred substrate of most soil microbes. Simpler carbon compounds like carbohydrates and acetate have low intrinsic sensitivity to elevated temperatures but are the preferred food source of soil microbes. As microbial metabolism increases with temperature – there is greater demand for these compounds. Microbes generally prefer to attack simpler and easier to digest compounds (Bosatta and Ågren, 1999; Davidson and Janssens, 2006b; Erhagen et al., 2013b; Leifeld and von Lützow, 2014). The temperature sensitivity of a compound is expressed quantitatively as a Q10 value; which is the amount a reaction rate (in this case, the rate of decomposition) changes with a 10°C increase in ambient temperature. Most estimates assume the average Q10 of SOC to be between 2 and 3 based on general knowledge of organic decomposition reactions; but there is not much work determining Q10 values for SOC experimentally (Davidson and Janssens, 2006c).
13
Determining a precise Q10 value for each soil in the world would be nearly impossible, but estimating based on local SOC chemistry might be more simplistic but might also be a bit more feasible. It is not possible to measure every aspect of every soil – so some assumptions will always have to be made. One of the goals of advancing research into topics like this is to make the estimates that have to be made more accurate. Q10 values for reactions generally depend on the rate limiting step. Activation energy for rate-liming steps is a major factor in the Q10 of any chemical compound. Compounds with higher activation energies (i.e. aromatic compounds) tend to have higher Q10 values. As ambient temperature increases, so does the energy of the system and as the energy of the system increases, overcoming the activation energy barrier becomes more likely (Bosatta and Ågren, 1999). Wagai (2013) suggested that aromatic and R-O containing compounds have higher activation energies, and thus Q10 values than alkyl carbon compounds (Wagai et al., 2013). In contrast, Erhagen (2013) found that the amount of aromatic compounds, relative to other compounds in a soil tended to have no effect on overall Q10 for SOC (Erhagen et al., 2013a). Interestingly, Leifeld (2014) found that SOC thermal stability was largely unaffected by SOC chemistry and more strongly affected by soil microbial properties and SOC protection (i.e. aggregation). While chemical characteristics, such as organo-mineral complexation affect inherent thermal stability of the compound (in lab conditions), they have much less influence on in-situ stability. Instead the thermal stability when catalyzed by soil enzymes was far more important in determining in-situ decomposition potential. Soil enzymes are dependent on microbial activity and speciation. Microbial enzyme catalysis potential depends on soil pH, microbial speciation, and nutrient content of substrate. Changes in soil pH alter the charges of functional groups on large organic molecules, this is often called pH-dependent charge (Pierzynski et al., 2005). Active sites on enzymes, where reactions take place, are often
14
charged functional groups – making pH important for enzyme function. Microbial speciation and substrate quality determine the types of enzymes being produced, for example, in a soil with abundant phosphate mineral and minimal organically bound phosphate, microbes will produce very little phosphatase enzymes, which release organically bound phosphates. (Leifeld and von Lützow, 2014).
Since not all soil organic C compounds are as sensitive to increasing temperatures; some studies have found that there is an initial burst of increased CO2 emissions (and thus a decrease
in SOC) following warming that then dies down (Giardina and Ryan, 2000; Pold et al., 2015). However, Pold et. al (2015) found that following a warming period the initial increase and then decrease in soil CO2 emissions was followed by another increase in emissions. This is likely tied
to changes in microbial populations. In a 20 year in-situ study, soil respiration rate initially increased sharply under elevated temperatures and then decreased to lower equilibrium rate. It is likely that the warmer conditions favored a burst of microbial activity that then reached
equilibrium, as the preferred substrate was consumed. However, after 20 years, the soil
respiration rate began to increase once more, as soil microbial communities changed and became more capable of consuming the remaining less-preferred substrate. DNA analysis of soil
microbes showed that the microbes were adapting and acquiring traits that allowed them to consume a wider variety of SOC compounds (Pold et al., 2015). In an incubation study, Waldrop (2003) traced C-isotopes to determine that indeed the first wave of CO2 release from increased
temperatures was from young, labile carbon; and that later releases of CO2 were from the
15
with increasing temperatures in accordance with standard kinetic models (Waldrop and Firestone, 2004a).
Decomposer microbes are often classified by their substrate preferences. Oligotrophic microorganisms are microorganisms that can survive in low-nutrient environments. They are capable of degrading more recalcitrant C and can survive in a low nutrient environment. They generally grow slower and could be considered as K-selected (slow growing with stable
populations). In contrast, copiotrophic microorganisms are microorganisms that can only survive in high nutrient environments. These microbes require a high nutrient environment with plenty of labile C, as they are often not capable of degrading recalcitrant C. Copiotrophs tend to grow much faster and are thought of as being more r-selected (fast growing with unstable, frequently fluctuating populations) (Colwell and Grimes, 2000; Koch, 2001) . At least from these studies, it appears that over time, a warmer environment can lead to a higher prevalence of oligotrophic microorganisms as the labile C is quickly consumed by copiotrophic microorganisms.
Another in-situ warming experiment found that warming soils only increased CO2
emissions to a certain extent. Temperatures up to +5°C warmer than ambient were found to greatly increase soil CO2 emissions; however, past +5°C above ambient the CO2 emission rate
did not continue to increase and in fact, began to decrease. This could be due to heat sensitivity of microbes or of their substrate (McHale et al., 1998). Microbes increase their respiration rate as temperature increases, however given too much of an increase their cellular proteins denature and they die. The minimum, maximum, and optimal temperatures for growth vary by species, but for most temperate soil microbes, the maximum is around 40 ° C (Eddleman, 1998).
16
Soil microorganisms are not the only part of the soil ecosystem to be affected by rising temperatures. Plants are affected as well, and if they increase production at a rate high enough to offset the decomposition rate, then the net change would be zero. This is particularly the case in colder climates (i.e.; Polar Regions) where low temperatures are a major limiting factor for plant growth. Even in already temperate climates, some warming can stimulate increased plant
biomass production (Garten et al., 2009). However, it is unknown if the increase in plant growth would be enough to offset emissions, especially in areas with very large reserves of carbon stored under permafrost or as peat (Lavigne et al., 2003).
There is a global overall trend for higher SOC values to be found in areas with lower temperatures. In North America, it is found that SOC and soil carbon turnover time increases with increasing latitude (Garten, 2011). This can be explained both by cooler climates and greater tendency for water-logged conditions. Cooler climates have less ET and thus more soil water. Waterlogging can cause SOC to build up by inhibiting decomposition via low
oxygenation.
Increasing soil temperatures is likely to increase soil SOC loss and thus soil CO2
emission; however it is still possible to protect soil carbon from degradation. Even in warm climates, soils can store significant amounts of carbon given the right conditions that keep it protected from microbial decomposition. Knowing what affects the temperature sensitivity of soil organic carbon could lead to practices that protect soil carbon from elevated temperatures. A study of in-situ field data and climate change modeling on barley fields in Spain found that
17
management practices could reduce the impact of elevated temperatures on SOC. While SOC declined under all climate change scenarios – this decline was less significant in systems with No-till, residue cover, and no fallow (Alvaro-Fuentes and Paustian, 2011). A similar study in Italy found the lowest SOC under anticipated climate change with conventional tillage and the most SOC under ambient climate with no-till and a wheat-corn rotation. Under a warmer climate the wheat-sunflower rotation under no-till was the only treatment to have increased SOC
compared to ambient climate. Conventional tillage and a warmer climate amplified each other resulting in large losses of soil carbon. No-till reduced the effects of a warmer climate on SOC and selecting a crop that performs well under altered climate (like sunflower) increases residue C inputs to the soil (Farina et al., 2011).
Moisture
The other major climatic variable that affects soil carbon storage and soil greenhouse gas balance is soil water content. Microbes tend to be most active at water contents around 50 – 60 % of pore volume filled with water (Uhlírová et al., 2005). Microbes, like all organisms, need water to survive, and thus at very low water contents, they will not be active. Additionally, at lower water contents, plant production will also be limited, resulting in low SOC (Tissue et al., 2004). Conversely, at high water contents, the soil will have little to no available oxygen.
Without available oxygen, organic matter is broken down anaerobically, which is a much slower process than aerobic decomposition (Soil Survey Staff, 2015). While anaerobic soil
18
N2O and CH4 (298 and 28 - 36 times more powerful than CO2, respectively) (United States
Environmental Protection Agency, 2015).
An in-situ study of altered temperature and moisture regimes found that moisture conditions were actually more important than ambient carbon in determining C flux rates in a Tennessee soil. Drought conditions decreased C flux as lack of water availability decreased microbial decomposition (Garten et al., 2009). Another in-situ study on pine plantations in Georgia found an interaction between temperature and moisture on soil C flux and Q10. Drier conditions resulted in decreased Q10 and decreased C flux only at higher temperatures. Elevated temperatures increase microbial demand for C substrates but they also increase microbial
demand for other resources such as water and nutrients. Soil microbes can only take advantage of warmer conditions if their other needs (i.e. water) are met (ArchMiller and Samuelson, 2016). When water (or other resources required for growth) is limited then growth will be determined by the resource that is the most limiting. This is the ecological concept of a limiting factor; where one condition or required resource limits organism growth (Edwards and Edwards, 2011).
Soil water content depends primarily on the precipitation but also on soil texture / mineralogy, landscape position, and evapotranspiration. Since soil texture, mineralogy, and landscape position are not changeable through management and are not going to be altered via climate change, they will be discussed very briefly. With precipitation, the amount of rain is not the only important variable, timing and intensity are as well. Generally more major rain events (>5mm) correlates with more rain overall (Tissue et al., 2004). Obviously, areas with more rain will tend to have wetter soils, but what time during the year the rain arrives does seriously affect
19
the potential for plant and microbial growth. The intensity of the rainfall affects how much of a given rain event will actually be absorbed by a soil.
Climate change is predicted to alter precipitation patterns in a number of ways. Due to increased temperatures, the intensity and magnitude of rain events is expected to increase while the average amount of time between rain events is expected to increase as well (Cole and
Hansen, 2013). The net result would likely be the same amount of water but in less frequent rain events (Cole and Hansen, 2013). This change would likely result in drier soils; especially in soils with a low water holding capacity. Larger and more intense rain events often have lower
percentages of the rainfall actually absorbed by the soil; as the rain falls faster than the soil can absorb it; which when coupled with longer time intervals between rainfall; would likely result in drier soils.
Soil texture, mineralogy and landscape position affect the fate of water added to a soil system. Generally less sloped positions that are lower in the landscape will be wetter as gravity carries rainwater down. Finer textured soils will hold more water as clay minerals adsorb water much more readily than silts or sands. While these effects are significant on soil processes, they are not going to be altered due to climate change and (usually) cannot be altered via management practices.
Evapotranspiration is the main mechanism that removes water from the soil system. Evapotranspiration depends greatly on weather conditions. Warm, dry, and windy weather favors higher ET, while cool, humid, and calm conditions favor low ET. These are likely to be affected
20
by climate change. There is some suggestion that climate change will result in higher ET in many areas of the world. Elevated temperatures associated with climate change for sure increase ET but what is uncertain is the availability of water and other factors like cloud cover and wind. Changes in ET from climate change are non-uniform and have considerable (31%) uncertainty to them (Lofgren et al., 2013; Nam et al., 2015).
From the literature there is a general trend on how soil decomposition and C-flux change with soil moisture. Soil decomposition rate will rise with increasing moisture content until the soil becomes anoxic; upon which decomposition will decrease. However, the gases released from anaerobic decomposition are more powerful greenhouse gases than CO2. Ultimately is
important to think about how climate change will alter soil moisture regimes when thinking about soil carbon sequestration.
Microbial Speciation
Breakdown of soil organic carbon is largely driven by microbial processes. While many species and taxa utilize soil organic carbon, they do not utilize it in the same manner. Boyero et, al (2014) found that in a tropical forest site, the decomposer species distribution and residue composition were just as important in ambient temperatures in determining decomposition rate. Of particular importance were larger macro-organisms that shred residue into smaller pieces; allowing for greater breakdown (Boyero et al., 2014). Different soils will have different decomposer assemblages due to location, climate, and soil type.
21
Changing climate is expected to change microbe speciation; which could have consequences for soil carbon storage. A number of studies have found that altered soil
temperature regimes alters the composition and functional diversity of microbial communities.
In an in-situ pasture study, Gray et al. (2011) found that a number of microbe groups respond to climate change with changes in relative abundance. When temperatures were increased, the relative abundance of gram positive bacteria compared to gram negative bacteria was found to increase as well. Like gram positive bacteria, Actinobacteria were found to increase in population under warmer conditions. Firmicutes biomarkers were more abundant in warmer and drier soils. In contrast to these, AM Fungi were found to be detrimentally affected by increased temperature (Gray et al., 2011). In a similar in-situ study in a deciduous forest, Pold, et al. (2015) found that some species were more sensitive to changing temperatures than others. Acidobacteria, Rhizobiales, Xanthomonadales, and some Actinobacteria were found in greater abundance in plots subjected to warmer conditions, while Alpha-proteobacteria, some
Actinobacteria, and fungi overall were negatively impacted by warmer conditions. Additionally, an assessment of functional genes found that a warmer climate favored oligotrophic (capable of surviving in low-nutrient environments and on poor quality substrate) species over copiotrophic (requiring higher amounts of nutrients and higher quality substrate) ones (Pold et al., 2015). In an incubation of alpine tundra soil study by Wu et al (2015), it was found that increasing temperatures increased the prevalence of Actinobacteria and Firmicutes while decreasing the prevalence of Bacteriodetes and Delta-Proteobacteria. This increase in temperature was also accompanied by an increase in biodiversity up until 40 °C; at which point there was a sharp decline. The system shifted from using more labile C to more recalcitrant C with increasing
22
temperatures. The shift in bacterial community was smooth up to 30°C - 40°C, above which, changes became more abrupt (Wu et al., 2015). There are very clear changes in soil microbial communities under altered climate and how these changes affect soil function depends on the affected microbial group. To understand that, it is important to first go over how these microbial groups function in a soil environment.
These changes in functional microbial community structure could alter soil carbon storage/decomposition patterns. A field study in southern China found that the ratio of gram positive to gram negative bacteria was positively correlated with soil C respiration rate; while the inverse was true for the ratio of fungi to bacteria (Wang et al., 2013). Traditionally gram positive bacteria and fungi are thought of as being oligotrophic and K-selected and thus consuming more recalcitrant carbon compounds. Gram positive bacteria are also thought of as being more
resistant to environmental stress such as altered temperature regime and altered moisture status. Meanwhile, gram negative bacteria are often thought of as copiotrophs and as being more r-selected and thus preferring more labile C (Fierer et al., 2007). Despite this, the study by Wang, et al. (2013) found inverse trends with gram positive bacteria and the fungi – so it’s important to also consider that both of these are very broad groups where assumptions might not always hold true (Wang et al., 2013).
There are many different groups of gram positive bacteria in the soil environment, all with differing roles. Actinobacteria are a group of colony forming gram positive bacteria that tend to resemble fungi. Being gram positive, Actinobacteria are resistant to warmer, drier conditions. Actinobacteria are important in forming soil humic substances – which is an
23
important mechanism of soil carbon stabilization (Encyclopedia of Life, 2007). The study by Wang et al (2013) also found that actinomycete biomass was negatively correlated with soil C respiration. However, another study by Fierer et al. (2007) found no correlation between actinomycetes and soil respiration. Firmicutes are another group of gram positive bacteria, however current work suggests there is little correlation between Firmicutes abundance and soil C mineralization rates (Fierer et al., 2007).
Alpha-proteobacteria are a large and diverse group of mostly gram negative bacteria. The decline of Alpha-proteobacteria found by Pold, et al (2015) fits with the trend of gram negative bacteria being more sensitive to environmental stress such as elevated temperatures. However, like with the Firmicutes group little correlation was found between Alpha-proteobacteria and C mineralization rate (Fierer et al., 2007). Pold et al. (2015) found that both Rhizobiales and Xanthomonadales increased in abundance under elevated temperatures, however neither of these groups are decomposers so they have no direct effect on C cycling. However, there could be indirect effects as Rhizobiales are legume associated N-fixers (which elevate plant growth and decrease plant C:N ratio), and Xanthomonadales are parasitic and detrimental to plant growth. Acidobacteria are another group of gram negative bacteria that are common in soil environments – particularly in acidic soils. Acidobacteria have been shown to be inversely correlated with C respiration rate (Fierer et al., 2007). Bacteriodetes are another common group of gram negative bacteria that Pold noted a change in the abundance of. Unlike Acidobacteria, Bacteriodetes are positively correlated with C mineralization rates (Fierer et al., 2007; Pold et al., 2015).
24
Changes in microbial community structure can have major impacts on soil carbon storage capacity. A study on the Konza Prairie, Manhattan KS, found that the application of a fungicide, with no-other alterations of the soil, significantly reduced soil carbon storage and soil structural stability – indicating that changes in the microbial community can have a profound impact on soil functioning (Wilson et al., 2009a). Another survey of soil organic carbon found that soils with low OM tended to have low fungal biomarkers (Yevdokimov et al., 2013).
Substrate Quality and Availability
Substrate quality is a way of describing the chemistry of C compounds based on how easily they can be broken down by organisms. The chemistry and placement of organic carbon (i.e. incorporated versus on the surface) substrate/residue due to plant species can be just as important as climate in determining soil C stocks and storage patterns (Boyero et al., 2014). Bosatta and Ågren (1999) defined substrate quality as the inverse of the number of steps required to break down a compound and then added a modifier based on the activation energy of the rate limiting step. “High quality” substrate is broken down with few steps and minimal activation energy and is a preferred food source for soil organisms. Simple sugars, cellulose, proteins and compounds like lactate and acetate would fall under the “High Quality” category. “Low Quality” refers to substrates with many breakdown steps and high activation energies. These can be older more recalcitrant humic substances or they can be more recent residue compounds such as lignin or chitin (Bosatta and Ågren, 1999). Low quality residues tend to be much more resistant to microbial degradation, however modeling work has shown that under increased temperatures they become more vulnerable (Bosatta and Ågren, 1999). Other authors have used the C:N ratio
25
as a means of defining SOC quality (Bonanomi et al., 2014; Bossuyt et al., 2001; Turner and Jones, 2002; Vesterdal et al., 2012). Generally low C:N ratios tend to break down quicker than high C:N ratios because adequate nitrogen content allows microbial populations to greatly multiply. However, some very recalcitrant humic compounds have low C:N ratios and many high C:N ratio compounds can degrade quickly if there is enough free nitrogen in the soil – i.e. from fertilizers. Clearly indicating that the C:N ratio is not always an accurate assessment of C quality.
Substrate availability refers to how easily soil microorganisms can access and degrade SOC. Substrates can be unavailable to microbes due to their composition/chemistry – they are difficult for microbes to break down. They can also be unavailable due to physical protection within soil aggregates or due to organo-metal complexation. All mechanisms combined, the reduction of availability of SOC will reduce CO2 emissions and increase SOC storage. It is the
decline in substrate availability that is thought to be the main mechanism behind the often observed decline in increasing decomposition rate over time with soils subjected to increased temperatures. In the classical decomposition sequence, when a plant or cell dies the carbon compounds that are metabolized by microorganisms first are largely simple and often considered labile C (i.e. sugars). With time compounds consumed are more recalcitrant and the amount of available energy declines. The majority of the C loss as CO2 that occurs will happen in the first
year or so after decomposition begins. When a soil environment is warmed – the decomposition rate increases but the general sequence of C attack remains the same – just occurring faster. When microbial growth is faster due to higher temperatures, the microbial population can easily consume all of the labile C before more is added to the soil – resulting in a die-off and a decrease
26
in CO2 flux. (Giardina and Ryan, 2000; Hartley et al., 2007; Koelbl et al., 2006; Leifeld and von
Lützow, 2014; Pold et al., 2015; Swift, 2001; Xu et al., 2012).
Land Management Practices
On land used by humans for food production or building construction or other purposes, the fate of the SOC stocks often depend on how the humans use that land. It is estimated the up to 80% of cropland and about 75 – 80% of grazing land globally has some degree of degradation – mostly due to tillage and overgrazing (Burgess and Pimentel, 2013). This degradation is strongly associated with a loss of soil organic carbon. A survey of SOC stocks in the UK since 1978 has found that soils in the UK have been losing 0.6% of their initial C content per year – with a significant chunk of this likely due to changes in land use and management (and the remainder due to climate change (Bellamy et al., 2005). Another study in New Zealand of pasture soils found that over the last 20 years, there has been an average loss of 2.1 kg C / m2 area attributed to soil respiration. While the average was a net loss, some pastures gained C but this was not correlated with soil order or grazing species (sheep vs. cattle). Which suggests that other management decisions such as stocking density, forage species, fertilization and irrigation practices has a greater impact on soil C (Baisden et al., 2007). After long periods of cultivation or intensive grazing, SOC carbon stocks can drop dramatically. Taking native ecosystems and converting them to agriculture or grazing lands is generally associated with a loss of soil carbon from the disturbance. In a meta-analysis of 385 studies, Don et al (2011) found that the average loss of soil carbon after 5 years for tropical forests converted to cropland was between 25 and 30% depending on the type of crop (da Rocha et al., 2014; Don et al., 2011). Another meta-analysis of 74 studies across both tropical and temperate climates found an average soil carbon
27
loss of 50% after 30 to 50 years of conversion of undisturbed systems to cropland. In this study the majority of the carbon loss had occurred by 30 years of cultivation (Guo and Gifford, 2002). The carbon loss reported by Guo and Gifford (2002) is much higher than that reported by Don et al. (2011), however, it is important to keep in mind that the latter study looked at sites where crop production had been in place for 5 or more years and the former focused on studies of sites 30 – 50 years old. In a meta-analysis of 95 studies (with 322 sampling sites) in IPCC defined temperate climates, Poleplau et al (2011) examined the effect of various land use-conversions on soil carbon stocks. For the conversion of native grassland to cropland there was an average loss of 36%. For forests the loss was 32%. Most of the site to site variation in both cases was
explained by annual temperature (with warmer sites have greater soil carbon losses) and soil texture (with higher clay content sites having less soil carbon loss) (Poeplau et al., 2011). The losses reported by Poeplau et al. (2011), while from older sites, were less than reported by Gao and Gifford (2002), likely because they were restricted to only temperate climates and tropical systems typically have greater losses of soil carbon upon conversion to cropland (Lal, 2004b).
There are a number of agricultural and other land management practices that are known to have negative impacts on soil SOC stocks. One of these practices is conventional soil tillage. Tillage decreases residue cover and increases aeration in the surface horizon – both of which allow for water from the soil to evaporate more easily, while the compaction associated with tillage typically decreases infiltration. As a result no-till soils tend to have greater water
infiltration and storage than their conventional counterparts (Colozzi et al., 2004; Presley et al., 2013; Rusu et al., 2013). The changes in residue cover and water storage properties affects how the soil temperature changes with the air temperature. The cover and higher water content cause
28
no-till soils to heat and cool more slowly than tilled soils; effectively insulating soil from very cold weather and shading it from extreme heat. In humid tropical climates the shading can be important in protecting seedlings and reducing loss of SOC, conversely in very cold climates the slow heating can be a bit of a problem (Colozzi et al., 2004; He et al., 2010; Iamaguti et al., 2015). The incorporation of the residue allows for more contact between microbes and residue; causing a more complete and more rapid decomposition. This creates an environment where stable SOC is exposed to decomposition – and over time this can reduce soil SOC stocks (Colozzi et al., 2004; Farina et al., 2011; Lal, 2004b; Schlesinger and Andrews, 2000). Tilling the soil promotes the destruction of soil aggregates which create a less diverse soil habitat and allows for a soil microbial community that is less efficient at C sequestration (Berns et al., 2015; Colozzi et al., 2004).
The reduction of SOC loss caused by tillage practices can be reversed by adapting no-till
technologies and practices. No-till increases SOC storage and soil microbial population (Alvaro-Fuentes and Paustian, 2011; Colozzi et al., 2004; Farina et al., 2011; Lal, 2004b; Presley et al., 2013; Rice et al., 2009; Rusu et al., 2013; Swedrzynska, 2013; West and Post, 2002). No-till and reduced tillage practices keep the soil in a condition that is more similar to the one found in native ecosystems – which allows for greater biodiversity of soil microbes. No-till promotes better aggregate structure, which protects SOC and provides a more suitable microbial habitat (Berns et al., 2015). In particular, fungi and oligotrophic bacteria are more abundant in less disturbed systems – and it is precisely these organisms that are important for the maintenance of soil aggregate structure and SOC storage (Bossuyt et al., 2001; Rice et al., 2009; Swedrzynska, 2013). Converting to no-till can have significant impacts on SOC stocks. A meta-analysis across