Universiteit Gent Faculteit Ingenieurswetenschappen Vakgroep Telecommunicatie en Informatieverwerking
Feature Extraction and Classification for
Hyperspectral Remote Sensing Images
Wenzhi Liao
ING ENIE URSWETENSCH AP PEN A RCHITEC T U URProefschrift tot het bekomen van de graad van Doctor in de Ingenieurswetenschappen: Computerwetenschappen Academiejaar 2011-2012
Universiteit Gent Faculteit Ingenieurswetenschappen Vakgroep Telecommunicatie en Informatieverwerking
Promotoren: Prof. Dr. Ir. Wilfried Philips Prof. Dr. Ir. Aleksandra Piˇzurica Prof. Dr. Ir. Youguo Pi
Universiteit Gent
Faculteit Ingenieurswetenschappen
Vakgroep Telecommunicatie en Informatieverwerking St-Pietersnieuwstraat 41 B-9000 Gent, Belgi¨e Tel.: +32-9-264.34.12
Fax.: +32-9-264.42.95
Dit werk kwam tot stand in het kader van een specialisatiebeurs van het FWO-Vlaanderen (Flemish Fund for Scientific Research).
ING ENIE URSWETENSCH AP PEN A RCHITEC T U UR
Proefschrift tot het behalen van de graad van Doctor in de Ingenieurswetenschappen: Computerwetenschappen Academiejaar 2011-2012
Acknowledgements
This thesis could not have been produced without the support and assistance of my supervisors, my family, numerous friends and colleagues, for whom I would like to include this acknowledgment.
First and foremost I wish to thank my supervisors, Aleksandra Piˇzurica, Wil-fried Philips and Youguo Pi. Thank you for your excellent guidance and stim-ulating ideas. Thanks for reading all the papers and this thesis with much care and for giving relevant comments. Thanks to all staff of the Gent University and South China University of Technology for making this work possible. My great-est gratitude to Aleksandra Piˇzurica. You have been my mentor throughout these years. Thank you for your bright ideas and your hand by hand help with numerous problems I encountered, even such as your advices on how to express sentences correctly in English, and how to answer the comments of reviewers in more com-fortable ways.
I also thank my colleague Rik Bellens at Telin, for guiding me in programming and discussing our cooperated paper. For advice on English pronunciation and presentations, many thanks to Filip Rooms and Jan Aelterman.
Special thanks to Prof. Paul Scheunders from the university of Antwerp. The FWO project I have worked on during my PhD was cooperated with your group, thank you for supporting me in pursuing this PhD and for your guidance on our cooperated paper. I also wish to thank prof. Paolo Gamba, for providing the data sets of Pavia. I also take this opportunity to mention my friends: Danny De Vleeschauwer, Andres Frias Velazquez, Danilo Babin, Ivana Despotovic and the crew of the badminton, for having shared the few moments of spare time available to me.
Combining a PhD thesis with a professional career and a two years old child at home requires some personal sacrifices. Therefore, I would like to thank my family. My wife, Haixia Liu, thank you for your support, love and patience, I contribute this thesis first to you. My lovely daughters, Yilin Liao, thank you for your love and patience. For your inspiration and for I cannot accompany you as a father within these two years, I contribute this thesis to you as well. My parents and sister Meihong Liao, for your constant support. I owe everything to you, and for that, I contribute this thesis to you too. My parents in law, Shuiping He and Zuming Liu, thank you for taking care of Yilin Liao for so many hours and for
ii
your assistance at our home.
Gent, March 2012 Wenzhi Liao
Table of Contents
Acknowledgements i Nederlandse samenvatting xv Summary xix 1 Introduction 1-1 1.1 Introduction . . . 1-1 1.1.1 Differences between hyperspectral and multispectralimag-ing . . . 1-2 1.1.2 Applications of hyperspectral remote sensing. . . 1-3 1.2 Challenges in hyperspectral data processing . . . 1-4 1.3 Overview . . . 1-5 1.4 Objectives and novel contributions of the thesis . . . 1-8 1.5 Outline . . . 1-9 1.6 Publications . . . 1-10
1.6.1 Publications in international journals . . . 1-10 1.6.2 Publications in international conferences . . . 1-10
2 Related work 2-1
2.1 Introduction . . . 2-1 2.2 Feature extraction for hyperspectral images . . . 2-4 2.3 Unsupervised feature extraction methods . . . 2-6 2.3.1 PCA . . . 2-6 2.3.2 LLFE . . . 2-7 2.4 Supervised feature extraction methods . . . 2-12
2.4.1 LDA . . . 2-12 2.4.2 NWFE . . . 2-13 2.5 Semi-supervised feature extraction methods . . . 2-15 2.5.1 SDA . . . 2-16 2.5.2 SELF . . . 2-17 2.6 Conclusion . . . 2-17
iv
3 Semi-supervised local discriminant analysis (SELD) 3-1
3.1 Introduction . . . 3-2 3.2 Proposed semi-supervised local discriminant analysis (SELD) . . 3-5 3.2.1 Reformulation of supervised LDA and unsupervised LLFE 3-7 3.2.2 SELD . . . 3-10 3.2.3 Algorithm . . . 3-12 3.3 Experimental results on the synthetic data . . . 3-12 3.4 Experimental results on the real hyperspectral data . . . 3-14 3.4.1 Hyperspectral data sets . . . 3-14 3.4.2 Experimental setup . . . 3-16 3.4.3 Results and discussion . . . 3-17 3.5 Algorithm analysis . . . 3-23 3.5.1 Computational cost . . . 3-24 3.5.2 Selection of unlabeled samples . . . 3-25 3.5.3 Selection of nearest neighbors . . . 3-26 3.6 Conclusion . . . 3-27
4 Semi-supervised feature extraction for morphological profiles with
par-tial reconstruction 4-1
4.1 Introduction . . . 4-2 4.2 Morphological features . . . 4-4 4.2.1 Disk-based and linear-based structure elements . . . 4-4 4.2.2 Reconstruction and Partial reconstruction . . . 4-5 4.3 Extended morphological profiles with partial reconstruction . . . . 4-7 4.4 Generalized SELD for feature extraction of MPs . . . 4-9 4.5 Experimental results . . . 4-11
4.5.1 Hyperspectral data sets . . . 4-11 4.5.2 Experimental setup . . . 4-12 4.5.3 Results using morphological profiles with partial
recon-struction and directional MPs . . . 4-14 4.5.4 Results using semi-supervised feature extraction to reduce
the dimensionality of the generated MPs . . . 4-19 4.6 Conclusion . . . 4-25
5 Kernel feature extraction for hyperspectral data 5-1
5.1 Introduction . . . 5-2 5.1.1 Manifold learning and nonlinear dimensionality reduction 5-2 5.1.2 Kernel-based methods . . . 5-4 5.2 Kernel feature extraction methods for hyperspectral data . . . 5-6 5.2.1 Kernel principal component analysis . . . 5-6 5.2.2 The proposed FIKPCA . . . 5-7 5.2.3 Data sets and experimental setup . . . 5-9 5.2.4 Experimental results . . . 5-10 5.3 Extended morphological profiles generated on KPCs with partial
v
5.3.1 Data sets and experimental setup . . . 5-18 5.3.2 Experimental results . . . 5-20 5.4 Conclusion . . . 5-26
List of Figures
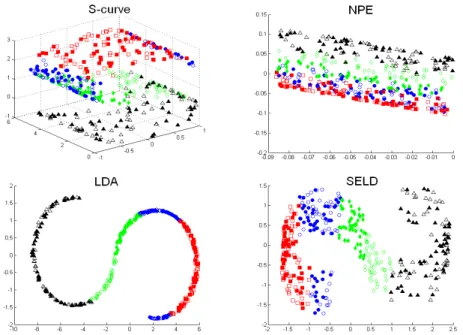
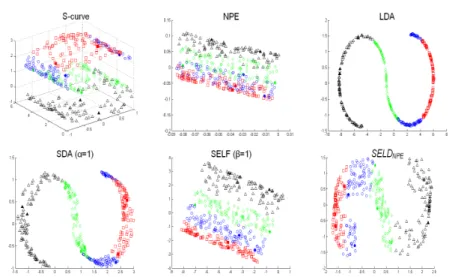
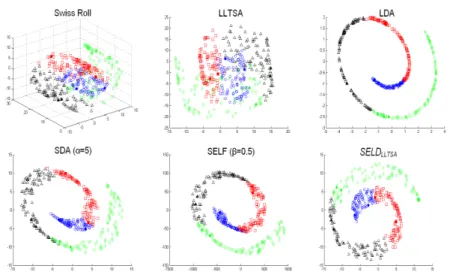
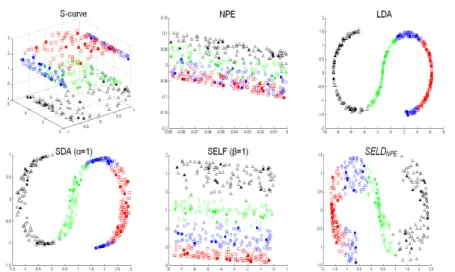
1.1 Each pixel in a hyperspectral image contains a continuous spec-trum that is used to identify the materials present in the pixel. . . . 1-2 1.2 Hypercube. . . 1-3 2.1 Hypercube in mathematics . . . 2-5 2.2 PCA features . . . 2-8 2.3 Basic idea of LLFE. . . 2-12 2.4 Basic idea of LDA. . . 2-13 3.1 Example of feature extraction on S-curve data set . . . 3-6 3.2 Example of feature extraction on Swiss data set . . . 3-7 3.3 Projecting 3 dimensional S-curve data to 2 dimensional subspace
using 2 labeled samples . . . 3-9 3.4 Projecting 3 dimensional Swiss data to 2 dimensional subspace
using 2 labeled samples . . . 3-10 3.5 Projecting 3 dimensional S-curve data to 10 dimensional subspace
using 2 labeled samples . . . 3-13 3.6 Projecting 3 dimensional Swiss data to 2 dimensional subspace
using 10 labeled samples . . . 3-14 3.7 Performances on classification accuracy as the number of features
increases . . . 3-21 3.8 Classification maps for Indian Pines data set withnk= 40 . . . . 3-24 3.9 Classification maps for KSC data set withnk = 40 . . . 3-25 3.10 Classification maps DC Mall data set withnk= 40 . . . 3-26 3.11 Classification maps for Botswana data set withnk = 40. . . 3-27 3.12 Distributions of training samples and testing samples for
“Hay-windrowed”, “Soybeans-Min” and “Woods” of Indian Pine data set using the first two significant features obtained from different methods . . . 3-28 3.13 Distributions of training samples and testing samples for “Scrub”,
“Graminoid marsh” and “Salt marsh” of KSC data set using the first two significant features obtained from different methods . . . 3-29 3.14 Comparision of computational time (second) and OCA with
dif-ferent sample size,e= 12andu= 1500. . . 3-30 3.15 Performances on different parameters . . . 3-30
viii
4.1 Diagram of proposed semi-supervised FE for MPs. . . 4-2 4.2 Comparison on morphological openings with disk SE . . . 4-5 4.3 Comparison on morphological closings with linear SE . . . 4-6 4.4 Definition on morphological profile . . . 4-8 4.5 Definition on extended morphological profile . . . 4-9 4.6 Data set of University Area . . . 4-12 4.7 Data set of Pavia Center . . . 4-13 4.8 Classification maps for Pavia Center with best classification
accu-racy over ten runs, 20 training samples per class with SVM classi-fier were used . . . 4-17 4.9 Classification maps for University Area with best classification
ac-curacy over ten runs, 20 training samples per class with SVM clas-sifier were used . . . 4-18 4.10 Highest OA of University Area in different samples size with
par-tial reconstruction based on only disk-based MPs . . . 4-22 4.11 Highest OA of University Area in different samples size with
par-tial reconstruction based on both disk-based and linear-based MPs 4-22 4.12 Performances on extracted feature number based on disk only MPs 4-24 4.13 Performances on extracted feature number based on both disk and
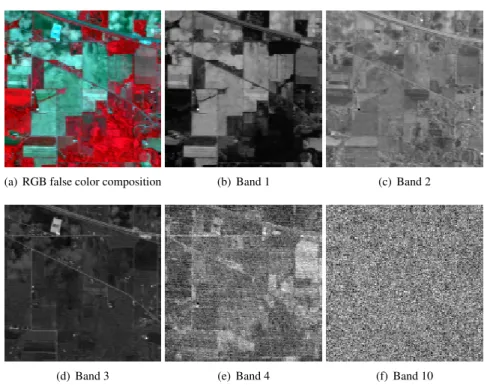
linear MPs . . . 4-24 5.1 False color image and ground truth of 220 band AVIRIS Indian
Pines data set . . . 5-10 5.2 The extracted feature bands and classification maps produced by
each method for the50×50subset image . . . 5-12 5.3 Comparison of consumed time and classification accuracy on50×
50subimage . . . 5-13 5.4 The extracted feature bands and classification maps produced by
each method for the60×60subset image . . . 5-14 5.5 Comparison of consumed time and classification accuracy on60×
60subimage . . . 5-15 5.6 Comparison on consumed time and accuracy as sample size increases5-15 5.7 Classification maps on the whole images . . . 5-16 5.8 Eigenvalues and cumulative variance in percentages for PCA and
KPCA. . . 5-16 5.9 Extracted features of PCA and KPCA . . . 5-17 5.10 Classification maps of University Area using EMP built on
differ-ent features . . . 5-25 5.11 Classification maps of Pavia Center using EMP built on different
List of Tables
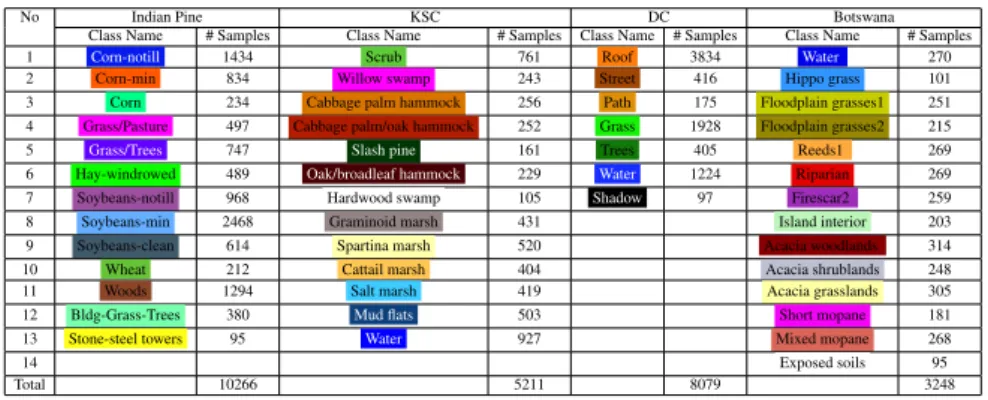
2.1 Eigenvalues and cumulative variance in percentages for AVIRIS Indian Pines with 220 bands. . . 2-7 3.1 Training samples and test samples of different data sets . . . 3-15 3.2 Comparison on highest OCA using 10 labeled training samples per
class . . . 3-18 3.3 Comparison on highest OCA using 10 labeled training samples per
class . . . 3-19 3.4 Statistical significance of differences in classification (Z) with QDC
classifier using 40 labeled training samples per class from Indian Pine data set . . . 3-20 3.5 Statistical significance of differences in classification (Z) with 1NN
classifier using 40 labeled training samples per class from Indian Pine data set . . . 3-22 3.6 Statistical significance of differences in classification (Z) with SVM
classifier using 40 labeled training samples per class from Indian Pine data set . . . 3-22 3.7 Statistical significance of differences in classification (Z) with QDC
classifier using 40 labeled training samples per class from KSC data set . . . 3-22 3.8 Statistical significance of differences in classification (Z) with 1NN
classifier using 40 labeled training samples per class from KSC data set . . . 3-23 3.9 Statistical significance of differences in classification (Z) with SVM
classifier using 40 labeled training samples per class from KSC data set . . . 3-23 4.1 Training samples and test samples of urban data sets . . . 4-13 4.2 Comparison on overall accuracy using only disk based SE . . . . 4-15 4.3 Comparison using both disk and linear based SE . . . 4-15 4.4 Comparison on classification accuracy of Pavia Center for each
class using 20 training samples per class . . . 4-16 4.5 Comparison on classification accuracy of University Ares for each
class using 20 training samples per class . . . 4-19 4.6 Ztest on University Area . . . 4-20
x
4.7 Ztest on Pavia Center . . . 4-21 4.8 Ztest on University Area using LDC classifier . . . 4-24 4.9 Ztest on University Area using 1NN classifier . . . 4-25 4.10 Ztest on University Area using SVM classifier . . . 4-25 5.1 Classification accuracy for EMP built on different features
(Uni-versity Area) . . . 5-19 5.2 Classification accuracy for EMP built on different features (Pavia
Center) . . . 5-20 5.3 Classification accuracy for each class using EMP (University Area) 5-23 5.4 Classification accuracy for each class using EMP (Pavia Center) . 5-24
List of Acronyms
A
AP Attribute Profile
C
CCA Curvilinear Component Analysis
CCIPCA Candid Covariance-Free Incremental Principle Com-ponent Analysis
E
EMP Extended Morphological Profile EAP Extended Attribute Profile EM Expectation Maximization
EMPN Extended Morphological Profile with No Reconstruc-tion
EMPP Extended Morphological Profile with Partial Recon-struction
F
FE Feature Extraction
xii
G
GSELD Generalized Semi-supervised Local Discriminant Anal-ysis
GDA Generalized Discriminant Analysis GHA Generalized Hebbian Algorithm
I
ICA Independent Component Analysis
IC Independent Component
K
KPCA Kernel Principal Component Analysis KPC Kernel Principal Component
L
LDA Local Area Network
LLE Locally Linear Embedding
LP Laplacian Eigenmap
LTSA Local Tangent Space Alignment LPP Locality Preserving Projection
LLTSA Linear Local Tangent Space Alignment LLFE Local Linear Feature Extraction LapSVM Laplacian Support Vector Machine LDC Linear Discriminant Classifier
M
MP Morphological Profile
MDS Globus Monitoring and Discovery Service MPLS Multi Protocol Label Switching
xiii
N
NPE Neighborhood Preserving Embedding NWFE Nonparametric Weighted Feature Extraction
NN Nearest Neighbor
MNF Minimum Noise Fraction
P
PCA Principle Component Analysis
PC Principal Component
Q
QDC Quadratic Discriminant Classifier
R
ROSIS Reflective Optics System Imaging Spectrometer
S
SDA Semi-supervised Discriminant Analysis
SELF Semi-supervised Local Fisher Discriminant Analysis SELD Semi-supervised Local Discriminant Analysis SVM Support Vector Machine
SSL Semi-Supervised Learning
SLR Semi-supervised Logistic Regression
SE Structuring Elements
SOM Self Organizing Map
xiv
Nederlandse samenvatting
–Summary in Dutch–
De recente technologische ontwikkelingen op het gebied van camera en andere sensoren hebben er toe geleid dat er steeds meer teledetectie data beschikbaar is en dit aan een steeds hogere spatiale en spectrale resolutie. Reeds vele technieken zijn ontwikkeld en getest om zowel de spectrale als de spatiale informatie die in deze data vervat zit, te verkennen. Zo worden vaak kenmerkextractietechnieken gebruikt om de hoge dimensionaliteit van hyperspectrale beelden te reduceren ter-wijl tegelijkertijd getracht wordt zoveel mogelijk van de spectrale informatie te behouden. Een populaire methode die gebruikt wordt bij het onderzoeken van de spatiale informatie is dan weer de methode van morfologische profielen.
Automatische classificatie technieken die gebruikt worden bij patroonherken-ning gaan er gewoonlijk vanuit dat er voldoende traipatroonherken-ningsvoorbeelden voorhanden zijn om een betrouwbaar en voldoende nauwkeurig model op te stellen voor de verschillende klassen. Deze veronderstelling is voor classificatieproblemen met hyperspectrale teledetectiebeelden echter maar zelden geldig. Het verzamelen van grondwaarheid voor dit soort data is namelijk een moeilijk en duur proces. Tech-nieken die in staat zijn een betrouwbare classificatie uit te voeren op basis van slechts een beperkt aantal voorbeelden kunnen dus veel tijd en kosten uitsparen. De beperking van een kleine trainingsset is bijgevolg een heel belangrijk probleem in het veld van de hyperspectrale beeldclassificatie.
In recente jaren zijn er steeds meer teledetectiebeelden van stedelijke omgevin-gen beschikbaar aan zeer hoge spatiale resoluties. De classificatie van zulke beelden is bijzonder uitdagend. In stedelijke omgevingen worden immers veel verschil-lende materialen gebruikt (baksteen, asfalt, beton, metaal, vegetatie, . . . ), maar vaak worden dezelfde materialen of (spectraal) sterk gelijkende materialen ge-bruikt voor verschillende functies (daken, wegen, parken, pleinen, . . . ) . Er is dus geen ´e´en op ´e´en mapping tussen spectrale karakteristieken en functionele klassen. Bijgevolg is de spectrale informatie onvoldoende om een duidelijk onderscheid te maken tussen alle functionele klassen. Het is dus belangrijk ook de spatiale informatie mee in rekening te brengen om zo de classificatie nauwkeurigheid te verbeteren. Een van de meest populaire methoden om de spatiale informatie in hoge resolutie teledetectiebeelden te onderzoeken zijn morfologische profielen. Bij het gebruik van morfologische profielen in hyperspectrale data, moet men drie belangrijke punten in rekening brengen. Ten eerste, het gebruik van morfologische reconstructie bij het genereren van de morfologische profielen zorgt voor een
aan-xviii NEDERLANDSESAMENVATTING
tal onverwachte en ongewenste resultaten. Ten tweede, de gegenereerde profielen leiden tot zeer grote data dimensies. En ten slotte, door het toepassen van lineaire kenmerkextractie methoden voor het reduceren van de dimensionaliteit van de hy-perspectrale beelden v´o´or het construeren van morfologische profielen, gaat heel wat van de spectrale informatie verloren.
Om deze problemen op te lossen en de classificatie resultaten te verbeteren, hebben we effectieve kenmerkextractiealgoritmen ontwikkeld en combineren we morfologische kenmerken voor de classificatie van hyperspectrale teledetectie-beelden. De bijdragen van deze thesis zijn de volgende:
Als eerste bijdrage, wordt een nieuwe half-gesuperviseerde lokale discriminan-tanalyse methode (semi-supervised local discriminant analysis,SELD) voorgesteld voor het extraheren van kenmerken in teledetectiebeelden, waardoor de perfor-mantie in moeilijke condities verbetert. De voorgestelde methode combineert een niet-gesuperviseerde methode (Local Linear Feature Extraction Methods,LLFE) en een gesuperviseerde methode (Linear Discriminant Analysis,LDA) in een nieuw kader zonder enige vrije parameters. Het basisidee is om een optimale projec-tiematrix te construeren, die de lokale omgeving, afgeleid uit de niet gelabelde voorbeelden, bewaart en tegelijkertijd de discriminatie tussen de klassen, afgeleid uit de gelabelde voorbeelden, maximaliseert.
Onze tweede bijdrage is de toepassing van morfologische profielen met parti¨ele reconstructie om de spatiale informatie in hyperspectrale teledetectiebeelden van stedelijke gebieden te beschrijven. Klassieke morfologische openingen en sluitin-gen zorsluitin-gen ervoor dat er vervorminsluitin-gen plaatsvinden aan de randen van objecten. Daarom wordt meestal morfologische reconstructie toegepast, die deze randen herstelt. Dit proces heeft echter een aantal ongewenste neveneffecten. Objecten waarvan wegens hun vorm en grootte verwacht zou worden dat ze verdwijnen in een opening of sluiting met een bepaald structuurelement, blijven echter aanwezig wanneer gebruik gemaakt wordt van morfologische reconstructie. Het al dan niet verdwijnen van een object staat hierdoor niet meer in relatie met de grootte van het object. Morfologische profielen met parti¨ele reconstructie daarentegen verbeteren zowel klassieke morfologische profielen als morfologische profielen met recon-structie. De vorm van objecten worden beter bewaard dan in het klassieke geval, terwijl de informatie over de grootte van de objecten beter gerepresenteerd wordt dan in morfologische profielen met reconstructie.
Een derde bijdrage is een nieuw half-gesuperviseerde kenmerkextractie kader voor het reduceren van de dimensie van de gegenereerde morfologische profie-len. De morfologische profielen met structuurelementen van verschillende grootte en vorm produceren zeer hoog dimensionale data. Deze data bevat heel wat re-dundante informatie en vormen bijgevolg een grote uitdaging voor conventionele classificatie methoden, zeker voor diegenen die niet robuust zijn tegen het Hughes fenomeen. Voor zover wij weten, is dit de eerste keer dat half-gesuperviseerde kenmerkextractie wordt gebruikt voor het analyseren van morfologische profielen. De voorgestelde methode, veralgemeende half-gesuperviseerde lokale discrimi-nant analyse (generalized semi-supervised local discriminant analysis,GSELD), is een uitbreiding van de SELD methode met een data gestuurde parameter.
SUMMARY INDUTCH xix
Als vierde bijdrage, stellen we een snelle iteratieve kernel principale com-ponenten analyse (fast iterative kernel principal component analysis, FIKPCA) voor om de dimensionaliteit van de hyperspectrale beelden te reduceren. In veel toepassingen, zorgen lineaire methoden voor kenmerkextractie, die gebruik maken van een lineaire projectie, ervoor dat niet-lineaire kenmerken van de data verloren gaan. Traditionele niet-lineaire methoden kunnen problemen veroorzaken op het gebied van opslagcapaciteiten en rekenkracht. De methode die we hier voorstellen is een kernel versie van deCandid Covariance-Free Incremental Principal
Com-ponent Analysis,die de eigenvectoren schat via verschillende iteraties. Door de
eigendecompositie van de Gram matrix te vermijden, kan onze methode de vereiste geheugencapaciteit en rekenkracht sterk verminderen.
Onze laatste bijdrage tenslotte construeert morfologische profielen met parti¨ele reconstructie op basis van ge¨extraheerde kenmerken verkregen met de niet-lineaire methode. In kenmerken verkregen met lineaire methodes, die traditioneel worden gebruikt, gaat te veel spectrale informatie verloren. De niet-lineaire kenmerken zijn beter geschikt om de hogere orde complexe en niet-lineaire distributies te beschrijven. In het bijzonder, hebben we onder andere de kernel principale com-ponenten kenmerken gebruikt om de morfologische profielen te construeren, wat tot een significante verbetering heeft geleid van de classificatienauwkeurigheid.
De experimentele analyse die werd uitgevoerd met de nieuwe technieken die in deze thesis werden ontwikkeld, tonen een duidelijke verbetering van de clas-sificatienauwkeurigheid in verschillende toepassingsdomeinen in vergelijking met andere state-of-the-art methoden.
Summary
Recent advances in sensor technology have led to an increased availability of hy-perspectral remote sensing data at very high both spectral and spatial resolutions. Many techniques are developed to explore the spectral information and the spatial information of these data. In particular, feature extraction (FE) aimed at reducing the dimensionality of hyperspectral data while keeping as much spectral infor-mation as possible is one of methods to preserve the spectral inforinfor-mation, while morphological profile analysis is the most popular methods used to explore the spatial information.
Hyperspectral sensors collect information as a set of images represented by hundreds of spectral bands. While offering much richer spectral information than regular RGB and multispectral images, the high dimensional hyperspectal data cre-ates also a challenge for traditional spectral data processing techniques. Conven-tional classification methods perform poorly on hyperspectral data due to the curse of dimensionality (i.e. the Hughes phenomenon: for a limited number of training samples, the classification accuracy decreases as the dimension increases). Clas-sification techniques in pattern recognition typically assume that there are enough training samples available to obtain reasonably accurate class descriptions in quan-titative form. However, the assumption that enough training samples are available to accurately estimate the class description is frequently not satisfied for hyper-spectral remote sensing data classification, because the cost of collecting ground-truth of observed data can be considerably difficult and expensive. In contrast, techniques making accurate estimation by using only small training samples can save time and cost considerably. The small sample size problem therefore becomes a very important issue for hyperspectral image classification.
Very high-resolution remotely sensed images from urban areas have recently become available. The classification of such images is challenging because urban areas often comprise a large number of different surface materials, and conse-quently the heterogeneity of urban images is relatively high. Moreover, different information classes can be made up of spectrally similar surface materials. There-fore, it is important to combine spectral and spatial information to improve the classification accuracy. In particular, morphological profile analysis is one of the most popular methods to explore the spatial information of the high resolution re-mote sensing data. When using morphological profiles (MPs) to explore the spatial information for the classification of hyperspectral data, one should consider three important issues. Firstly, classical morphological openings and closings degrade the object boundaries and deform the object shapes, while the morphological
pro-xxii ENGLISH SUMMARY
file by reconstruction leads to some unexpected and undesirable results (e.g. over-reconstruction). Secondly, the generated MPs produce high-dimensional data, which may contain redundant information and create a new challenge for conven-tional classification methods, especially for the classifiers which are not robust to the Hughes phenomenon. Last but not least, linear features, which are used to con-struct MPs, lose too much spectral information when extracted from the original hyperspectral data.
In order to overcome these problems and improve the classification results, we develop effective feature extraction algorithms and combine morphological fea-tures for the classification of hyperspectral remote sensing data. The contributions of this thesis are as follows.
1. As the first contribution of this thesis, a novel semi-supervised local dis-criminant analysis (SELD) method is proposed for feature extraction in hy-perspectral remote sensing imagery, with improved performance in both ill-posed and poor-ill-posed conditions. The proill-posed method combines unsu-pervised methods (Local Linear Feature Extraction Methods (LLFE)) and supervised method (Linear Discriminant Analysis (LDA)) in a novel frame-work without any free parameters. The underlying idea is to design an op-timal projection matrix, which preserves the local neighborhood informa-tion inferred from unlabeled samples, while simultaneously maximizing the class discrimination of the data inferred from the labeled samples.
2. Our second contribution is the application of morphological profiles with partial reconstruction to explore the spatial information in hyperspectral re-mote sensing data from the urban areas. Classical morphological openings and closings degrade the object boundaries and deform the object shapes. Morphological openings and closings by reconstruction can avoid this prob-lem, but this process leads to some undesirable effects. Objects expected to disappear at a certain scale remain present when using morphological open-ings and closopen-ings by reconstruction, which means that object size is often incorrectly represented. Morphological profiles with partial reconstruction improve upon both classical MPs and MPs with reconstruction. The shapes of objects are better preserved than classical MPs and the size information is preserved better than in reconstruction MPs.
3. A novel semi-supervised feature extraction framework for dimension reduc-tion of generated morphological profiles is the third contribureduc-tion of this the-sis. The morphological profiles (MPs) with different structuring elements and a range of increasing sizes of morphological operators produce high-dimensional data. These high-high-dimensional data may contain redundant in-formation and create a new challenge for conventional classification meth-ods, especially for the classifiers which are not robust to the Hughes phe-nomenon. To the best of our knowledge the use of semi-supervised feature extraction methods for the generated morphological profiles has not been
in-ENGLISH SUMMARY xxiii
vestigated yet. The proposed generalized semi-supervised local discriminant analysis (GSELD) is an extension of SELD with a data-driven parameter. 4. In our fourth contribution, we propose a fast iterative kernel principal
com-ponent analysis (FIKPCA) to extract features from hyperspectral images. In many applications, linear FE methods, which depend on linear projection, can result in loss of nonlinear properties of the original data after reduction of dimensionality. Traditional nonlinear methods will cause some problems on storage resources and computational load. The proposed method is a kernel version of the Candid Covariance-Free Incremental Principal Com-ponent Analysis, which estimates the eigenvectors through iteration. With-out performing eigen decomposition on the Gram matrix, our approach can reduce the space complexity and time complexity greatly.
5. Our last contribution constructs MPs with partial reconstruction on nonlin-ear features. Traditional linnonlin-ear features, on which the morphological profiles usually are built, lose too much spectral information. Nonlinear features are more suitable to describe higher order complex and nonlinear distributions. In particular, kernel principal components are among the nonlinear features we used to built MPs with partial reconstruction, which led to significant improvement in terms of classification accuracies.
The experimental analysis performed with the novel techniques developed in this thesis demonstrates an improvement in terms of accuracies in different fields of application when compared to other state of the art methods.
1
Introduction
1.1
Introduction
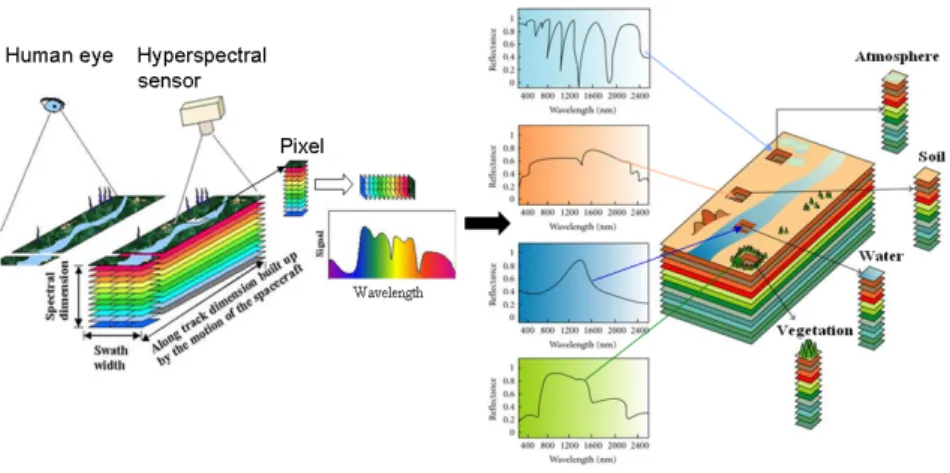
Hyperspectral [1] imaging collects and processes information from across the elec-tromagnetic spectrum. Much as the human eye sees visible light in three bands (red, green, and blue), spectral imaging divides the spectrum into many more bands. This technique of dividing images into bands can be extended beyond the visible spectrum. With the development of technology, hyperspectral sensors have been widely applied in agriculture, mineralogy and surveillance. Hyperspectral sensors look at objects using a vast portion of the electromagnetic spectrum. Cer-tain objects leave unique ‘fingerprints’ across the electromagnetic spectrum, see Fig. 1.1. These ‘fingerprints’ are known as spectral signatures and enable identi-fication of the materials that make up a scanned object. For example, a spectral signature for oil helps mineralogists to find new oil fields.
Recently, with the advancement of sensors, hyperspectral imaging has emerged as a new modality in Earth imaging, leading to the definition of hyperspectral re-mote sensing. Rere-mote sensing is the acquisition of information about an object or phenomenon, without making physical contact with the object. In modern us-age, the term generally refers to the use of aerial sensor technologies to detect and classify objects on Earth (both on the surface, and in the atmosphere and oceans) by means of propagated signals (e.g. electromagnetic radiation emitted from air-craft or satellites) [2]. Hyperspectral remote sensing is a relatively new technology that is currently being investigated by researchers and scientists with regard to the
1-2 INTRODUCTION
Figure 1.1: Each pixel in a hyperspectral image contains a continuous spectrum that is used to identify the materials present in the pixel.
detection and identification of minerals, terrestial vegetation, and man-made ma-terials and backgrounds.
Hyperspectral sensors collect information as a set of ‘images’. Each image represents a range of the electromagnetic spectrum and is also known as a spectral band. These ‘images’ are then combined into a three-dimensional hyperspectral data cube for processing and analysis, see Fig. 1.2. Hyperspectral cubes are gen-erated from airborne sensors like the NASA’s Airborne Visible/Infrared Imaging Spectrometer (AVIRIS), or from satellites like NASA’s Hyperion [3].
The precision of these sensors is typically measured in spectral resolution, which is the width of each band of the spectrum that is captured. If the scanner detects a large number of fairly narrow frequency bands, it is possible to identify objects even if they are only captured in a handful of pixels. However, spatial res-olution is a factor in addition to spectral resres-olution. If the pixels are too large, then multiple objects are captured in the same pixel and become difficult to identify. If the pixels are too small, then the energy captured by each sensor cell is low, and the decreased signal-to-noise ratio reduces the reliability of measured features.
1.1.1
Differences between hyperspectral and multispectral
imag-ing
Hyperspectral imaging belongs to a class of techniques commonly referred to as spectral imaging or spectral analysis. Hyperspectral imaging is related to multi-spectral imaging. The distinction between hyper- and multi-multi-spectral imaging is sometimes based on an arbitrary “number of bands” or on the type of measure-ment, depending on what is appropriate to the purpose.
INTRODUCTION 1-3
Figure 1.2: Hypercube.
Multispectral imaging deals with several images at discrete and somewhat nar-row bands. Being “discrete and somewhat narnar-row” is what distinguishes multi-spectral imaging in the visible spectrum from color photography. A multimulti-spectral sensor may have many bands covering the spectrum from the visible to the long wave infrared. Multispectral images do not produce the “spectrum” of an object. Landsat is an excellent example.
Hyperspectral deals with imaging narrow spectral bands over a continuous spectral range, and produces the spectra of all pixels in the scene. So, a sensor with only 20 bands can also be hyperspectral when it covers the range from 500 to 700 nm with 20 bands each 10 nm wide. (While a sensor with 20 discrete bands covering the VIS, NIR, SWIR, MWIR, and LWIR would be considered multispec-tral).
‘Ultraspectral imaging’ could be reserved for interferometer type imaging sen-sors with a very fine spectral resolution. These sensen-sors often have (but not neces-sarily) a low spatial resolution of several pixels only, a restriction imposed by the high data rate.
1.1.2
Applications of hyperspectral remote sensing.
Hyperspectral remote sensing is used in a wide range of applications. Although originally developed for mining and geology (the ability of hyperspectral imag-ing to identify various minerals makes it ideal for the minimag-ing and oil industries, where it can be used to look for ore and oil) [3, 4], it has now spread into fields as widespread as ecology and surveillance, as well as historical manuscript research, such as the imaging of the Archimedes Palimpsest. This technology is continu-ally becoming more available to the public. Organizations such as NASA and the USGS have catalogues of various minerals and their spectral signatures, and have posted them online to make them readily available for researchers.
1-4 INTRODUCTION
Hyperspectral remote sensing is increasing by used for monitoring the devel-opment and health of crops. For example, hyperspectral images are used to detect grape variety and to develop an early warning system for disease outbreaks [5]. Hyperspectral data can be used to detect the chemical composition of plants [6], and to detect the nutrient and water status of wheat in irrigated systems [7]. An-other application in agriculture is the detection of animal proteins in compound feeds to avoid bovine spongiform encephalopathy (BSE), also known as mad-cow disease [8].
Hyperspectral remote sensing of minerals is well developed. Many miner-als can be identified from airborne images, and their relation to the presence of valuable minerals, such as gold and diamonds, is well understood. Currently, progress is towards understanding the relationship between oil and gas leakages from pipelines and natural wells, and their effects on the vegetation and the spec-tral signatures [9, 10].
Hyperspectral imaging is frequently used in military surveillance too. Aerial surveillance with tethered balloons was used by French soldiers to spy on troop movements during the French Revolutionary Wars, and since that time, soldiers have learned not only to hide from the naked eye, but also to mask their heat sig-natures to blend into the surroundings and avoid infrared scanning. The idea that drives hyperspectral surveillance is that hyperspectral scanning draws information from such a large portion of the light spectrum that any given object should have a unique spectral signature in at least a few out of the many bands that are scanned. Hyperspectral remote sensing has been used to monitor the environment. The Telops Hyper-Cam, an infrared hyperspectral imager, now offers the possibility of obtaining a complete image of emissions resulting from industrial smokestacks from a remote location, without any need for extractive sampling systems. Emis-sion quantification measurements have been achieved with the Hyper-Cam which can now be used to independently, safely and rapidly identify and quantify pollut-ing emissions from a remote location [11].
1.2
Challenges in hyperspectral data processing
While offering much richer spectral information than regular RGB and multispec-tral images, hyperspecmultispec-tral data cubes with large number of specmultispec-tral bands create also a challenge for traditional data processing techniques:
The increasing number of spectral bands causes some problems with storage resources and computational load. Fast computers, sensitive detectors, and large data storage capacities are needed for analyzing hyperspectral data. Significant data storage capacity is necessary since hyperspectral cubes are large datasets, potentially exceeding tens of gigabytes. All of these factors greatly increase the cost of acquiring and processing hyperspectral data. Also, these high-dimensional
INTRODUCTION 1-5
hyperspectral data may contain redundant information.
The small sample size (SSS) problem [12] is an important issue for high-dimensional data classification. The SSS problem states that the number of avail-able training samples is relatively much smaller than the dimensionality of the sample space. Remotely sensed hyperspectral image data, such as AVIRIS (Air-borne Visible InfraRed Imaging Spectrometer) data [13–15] with hundreds of mea-sured features (bands) potentially provide more accurate and detailed information for classification. Some other hyperspectral data from agriculture even have more than thousand spectral bands [16]. However, the cost of collecting ground-truth of remotely sensed hyperspectral image often requires a skilled expert agent to manually classify training examples. The cost associated with the labeling process thus may render a fully labeled training set infeasible.
Very high-resolution remotely sensed images from urban areas have recently become available. The classification of such images is challenging because urban areas often comprise a large number of different surface materials, and conse-quently the heterogeneity of urban images is relatively high. Moreover, different information classes can be made up of spectrally similar surface materials.
1.3
Overview
Some advanced classifiers, such as neural networks [17], SVM [18,19] and random forest classifiers [19], have been shown to deal efficiently with the problems of the high dimension and small sample size (SSS). The approach of [20] addresses a “K-nearest neighbor classifier based on adaptive nonparametric separability” with a distance metric formed by all the NWFE features. In recent years ensemble learning methods such as bagging [21], boosting [22,23], random subspace method (RSM) [24] and their variants have showed some appealing results for improving the classification performance of “weak classifiers” [25–27].
However, common statistical classifiers are often limited to deal with these cases. The increase in dimensionality of hyperspectral data and the limited number of labeled training samples may create a new challenge for conventional classifi-cation methods, especially for the classifiers which are not robust to the Hughes phenomenon [1] (for a limited number of training samples, the classification accu-racy decreases as the dimension increases)). Moreover, with the increasing number of spectral bands, this hyperspectral data may contain redundant information. For this reason, feature extraction (FE) or feature selection, aiming at reducing the dimensionality of data, is a desirable preprocessing tool to reduce the dimension-ality of hyperspectral data for classification. Relatively few bands can represent most information of the data, making feature extraction (FE) or feature selection very useful for classification of remote sensing data [28–32]. The feature selec-tion method [31, 32] aims to select a suitable subset of the original set of features.
1-6 INTRODUCTION
The most important issue relative to feature selection is to find an efficient search strategy for obtaining such a subset for classification. Most of the existing feature selection methods are generally suboptimal [30] because the number of all possible combinations is prohibitive, particularly for high-dimensional data classification. Search strategies to avoid exhaustive search are needed, and the selection of the optimal subset is therefore not guaranteed. Feature extraction uses all the features to construct a transformation that maps the original data to a low-dimensional sub-space. The main advantage of feature extraction above feature selection is that no information of the original features needs to be wasted. Furthermore, feature extraction is easier than feature selection in some situations [30].
A number of approaches exist for feature extraction of hyperspectral images [28,33–36], ranging from unsupervised methods to supervised ones. Unsupervised FE methods do not require any prior knowledge or training data, even though they are not directly aimed at optimizing the accuracy in a given classification task [32]. One of the best known unsupervised methods is Principle Component Analysis (PCA) [37], which is widely used for hyperspectral images [33, 38, 39]. Wang and Chang [40] proposed three Independent Component Analysis (ICA) based dimen-sionality reduction methods for hyperspectral data. Wavelet transforms have been used in hyperspectral data dimensionality reduction [41, 42]. Wavelet transforms can preserve the high and low frequency features during the signal decomposition, hence preserving the spectral signatures. Plaza et al. [39] described sequences of extended morphological transformations for dimensionality reduction and classi-fication of hyperspectral datasets. Harsanyi and Chang [43] investigated hyper-spectral image classification and dimensionality reduction by using an orthogonal subspace projection approach. Phillips et al. [44] and He and Mei [45] used sin-gular value decomposition and random projection, respectively, to reduce the di-mensions of hyperspectral image data. Lower rank tensor approximation [46] and minimum change rate deviation [47] are proposed for hyperspectral image data by taking into account the spatial relation among neighboring image pixels. Re-cently, some local methods, which preserve the properties of local neighborhoods were proposed to reduce the dimensionality of hyperspectral images [33, 48–50], such as Locally Linear Embedding [48], Laplacian Eigenmap [51] and Local Tan-gent Space Alignment [52]. Their linear approximations, such as Neighborhood Preserving Embedding (NPE) [53], Locality Preserving Projection (LPP) [54] and Linear Local Tangent Space Alignment (LLTSA) [55] were recently applied to feature extraction in hyperspectral images [33, 56]. By considering neighborhood information around the data points, these local methods can preserve local neigh-borhood information and detect the manifold embedded in the high-dimensional feature space.
Supervised methods rely on the existence of labeled samples to infer class sep-arability. Two widely used supervised feature extraction methods for
hyperspec-INTRODUCTION 1-7
tral images are the Fisher’s Linear discriminant analysis (LDA) [57] and nonpara-metric weighted feature extraction (NWFE) [35]. Many extensions to both LDA and NWFE have been proposed in recent years, such as modified Fisher’s lin-ear discriminant analysis [58], regularized linlin-ear discriminant analysis [36], mod-ified nonparametric weight feature extraction using spatial and spectral informa-tion [59], and kernel nonparametric weighted feature extracinforma-tion [60].
In real-world applications, labeled data are usually very limited and labeling large amounts of data may sometimes require considerable human resources or expertise. On the other hand, unlabeled data are available in large quantities at very low cost. For this reason, semi-supervised methods [29, 61–66], which aim at improved classification by utilizing both unlabeled and limited labeled data gained popularity in the machine learning community. Some of the representa-tive semi-supervised learning methods include Co-Training [62] and transducrepresenta-tive SVM [63, 64], and Graph-based semi-supervised learning methods [65, 66]. Some semi-supervised feature extraction methods add a regularization term to preserve certain potential properties of the data. For example, semi-supervised discrimi-nant analysis (SDA) [67] adds a regularizer into the objective function of LDA. The resulting method makes use of a limited number of labeled samples to max-imize the class discrimination and employs both labeled and unlabeled samples to preserve the local properties of the data. The approach of [68] proposed a general semi-supervised dimensionality reduction framework based on pairwise constraints, which employs regularization with sparse representation. Other semi-supervised feature extraction methods combine semi-supervised methods with unsuper-vised ones using a trade-off parameter, such as semi-superunsuper-vised local Fisher dis-criminant analysis (SELF) [69]. However, it may not be easy to specify the optimal parameter values in these and similar semi-supervised techniques, as mentioned in [68, 69].
Very high-resolution remotely sensed images from urban areas have recently become available. The classification of such images is challenging because urban areas often comprise a large number of different surface materials, and conse-quently the heterogeneity of urban images is relatively high. Moreover, different information classes can be made up of spectrally similar surface materials. In this case, spatial information is very useful to improve the performances of classifica-tion. Many techniques are developed to explore the spatial information of the high resolution remote sensing data. In particular, mathematical morphology [70, 71] is one of the most popular methods. Pesaresi and Benediktsson [72] proposed the use of morphological transformations to build a morphological profile (MP). Bellens et al. [73] further explored this approach by using both disk-shaped and linear structuring elements to improve the classification of very high-resolution panchromatic urban imagery. The approach of [17] extended the method in [70] for hyperspectral data with high spatial resolution. The resulting method built the
1-8 INTRODUCTION
MPs on the first principal components (PCs) extracted from a hyperspectral image, leading to the definition of extended MP (EMP). The appoach of [39] performs spectral-based morphology using the full hyperspectral image without dimension-ality reduction. In [28], kernel principal components are used to construct the EMP, with significant improvement in terms of classification accuracies compared with the conventional EMP built on PCs. In [74], the attribute profiles (APs) [75] were applied to the first PCs extracted from a hyperspectral image, generating an extended AP (EAP). The approach of [76] improved the classification results by constructing the EAP with the independent component analysis.
However, classical morphological openings and closings degrade the object boundaries and deform the object shapes, which may result in losing some cru-cial information and introducing fake objects in the image. To avoid this problem, one often uses morphological openings and closings by reconstruction [17, 18, 72, 77, 78], which can reduce some shape noise in the image. However, morpho-logical openings and closings by reconstruction lead to some unexpected results for remote sensing images, such as over-reconstruction, as was discussed in [73]. Objects which are expected to disappear at a certain scale remain present when using morphological openings and closings by reconstruction. The approach of [73] proposed a partial reconstruction for the classification of very high-resolution panchromatic urban imagery. Morphological openings and closings by partial re-construction can solve the problem of over-rere-construction while preserving the shape of objects as much as possible.
1.4
Objectives and novel contributions of the thesis
The work presented in this thesis aims at investigating and defining novel tech-niques based on feature extraction for the classification of hyperspectral remote sensing images. State of the art techniques have already proven that the use of feature extraction and morphological features are effective for the classification of hyperspectral data. Nevertheless, several limitations exist (e.g., a very limited labeled samples, very high dimensionality of the data, very high-resolution of the data, high cost on storage and computation, etc.). The work presented in this dis-sertation attempts to overcoming those limitations.
The novel contributions of this thesis are as follows:
1. Definition of a novel framework for semi-supervised feature extraction [79,
80].
The proposed semi-supervised local discriminant analysis (SELD) method combines unsupervised methods and supervised method without any free parameters. It can find the optimal projection matrix, which preserves the
INTRODUCTION 1-9
local neighborhood information, while simultaneously maximizing the class discrimination of the data.
2. Application of morphological profiles with partial reconstruction [81] to
hyperspectral remote sensing images.
In some applications simultaneous preserving of both size and shape infor-mation in the scene is desirable. Therefore, we have applied morpholog-ical profiles with partial reconstruction to the classification of very high-resolution hyperspectral data from the urban area.
3. Pioneering the use of semi-supervised feature extraction to reduce the
di-mension of generated morphological profiles [81].
To the best of our knowledge, the use of semi-supervised feature extraction to reduce the dimension of generated morphological profiles was not yet reported in the remote sensing field before our work of [81].
4. Application of a nonlinear feature extraction method based on fast iterative
kernel principal component analysis to the classification of hyperspectral
data [82].
High cost of storage and computational time limit the use of nonlinear meth-ods in hyperspectral data. We proposed a fast iterative kernel principal com-ponent analysis to extend the limitations of some nonlinear methods by solv-ing the eigenvectors through iteration.
5. Investigation of extended morphological profiles with partial reconstruction
built on kernel principal components [83].
In many applications, the preservation of both higher order complex and nonlinear distributions in the extracted features, which will be later used to constructed the extended morphological profiles, is desirable. Thus, we have investigated extended morphological profiles with partial reconstruc-tion built on kernel principal components for the classificareconstruc-tion of very high-resolution hyperspectral data from the urban area.
1.5
Outline
This dissertation is organized in six chapters.
Some work related to ours is reviewed in Chapter 2, including some unsu-pervised feature extraction methods, suunsu-pervised feature extraction methods and semi-supervised methods.
In Chapter 3, a novel supervised feature extraction method, called semi-supervised local discriminant analysis (SELD), is described in detail.
Experi-1-10 INTRODUCTION
mental results on both synthetic data and real hyperspectral data are presented to demonstrate its performances.
Morphological profiles with partial reconstruction and proposed semi-supervised feature extraction, are shown in Chapter 4. Experimental results on hyperspectral data from the urban area demonstrates its performance.
The fast iterative kernel principal component analysis and extended morpho-logical profiles with partial reconstruction built on kernel principal components is clearly deduced in Chapter 5. The standard kernel principal component analysis performs eigen decomposition on Gram matrix. Instead, the proposed fast itera-tive kernel principal component analysis solves the eigenvectors through iteration, which can reduce the space complexity and time complexity greatly. Extended morphological profiles with partial reconstruction built on kernel principal com-ponents were investigated with the demonstration of experimental results.
Chapter 6 presents a general discussion of the work described in this thesis reviewing the main contributions of this research. Specific concluding remarks on the research topics treated in the dissertation are also given. Perspectives on possible future developments of the work are presented.
1.6
Publications
1.6.1
Publications in international journals
1. Wenzhi Liao, Aleksandra Piˇzurica, Paul Scheunders, Wilfried Philips, Youguo
Pi, “Semi-Supervised Local Discriminant Analysis for Feature Extraction in Hyperspectral Images,” IEEE Transactions on Geoscience and Remote
Sensing, accepted.
2. Wenzhi Liao, Rik Bellens, Aleksandra Piˇzurica, Wilfried Philips, Youguo
Pi, “Classification of Hyperspectral Data over Urban Areas Using Direc-tional Morphological Profiles and Semi-supervised Feature Extraction,”IEEE Journal of Selected Topics in Applied Earth Observations and Remote Sens-ing, vol. 5, no. 4, 14 pages, 2012.
1.6.2
Publications in international conferences
1. Wenzhi Liao, Aleksandra Piˇzurica, Wilfried Philips, Youguo Pi, “A fast
iter-ative kernel PCA feature extraction for hyperspectral images,”Proceedings
of 2010 IEEE 17th International Conference on Image Processing (ICIP2010),
Hongkong, China, pp. 1317-1320, 2010.
2. Wenzhi Liao, Aleksandra Piˇzurica, Wilfried Philips, Youguo Pi, “Feature
discrim-INTRODUCTION 1-11
inant analysis,”Joint Urban Remote Sensing Event (JURSE 2011), Munich, Germany, pp. 401-402, 2011.
3. Wenzhi Liao, Rik Bellens, Aleksandra Piˇzurica, Wilfried Philips and Youguo
Pi, “Classification of hyperspectral data over urban areas based on extended morphological profile with partial reconstruction, ”Proceedings of ACIVS 2012, submitted.
2
Related work
Hyperspectral sensors collect information as a set of images represented by hun-dreds of spectral bands. While offering much richer spectral information than regular RGB and multispectral images, this large number of spectral bands cre-ates a challenge for traditional spectral data processing techniques. Conventional classification methods perform poorly on hyperspectral data due to the curse of dimensionality (i.e. the Hughes phenomenon [1]: for a limited number of training samples, the classification accuracy decreases as the dimension increases). Feature extraction aims at reducing the dimensionality of hyperspectral data while keeping as much intrinsic information as possible. Relatively few bands can represent most information of the hyperspectral images [33], making feature extraction very use-ful for classification, detection and visualization of remote sensing data [29,33,34]. This Chapter presents the background and a brief overview on some related feature extraction methods for the classification of hyperspectral data.
2.1
Introduction
A number of approaches exist for feature extraction of hyperspectral images [28, 33–36], ranging from unsupervised methods to supervised ones. Unsupervised FE methods do not require any prior knowledge or training data, even though they are not directly aimed at optimizing the accuracy in a given classification task [32]. One of the best known unsupervised methods is Principle Component Analysis (PCA) [37], which is widely used for hyperspectral images [33, 38, 39].
2-2 RELATED WORK
The purpose of PCA is to reduce dimensionality according to what percentage of the overall variance can be captured. The kernel-based PCA (KPCA) is to find the directions by performing the PCA in the kernel feature space [84]. Indepen-dent component analysis (ICA) is a statistical technique for separating the inde-pendent signals from overlapping signals [85]. ICA is related to PCA but is more powerful and capable of finding the underlying factors or sources even when the principal-component approach fails. ICA defines a generative model for the ob-served multivariate data, which is typically given as a large database of samples. In the model, the data variables are assumed to be linear mixtures of some unknown latent variables, and the mixing system is also unknown. The latent variables are assumed non-Gaussian and mutually independent, and they are called the indepen-dent components of the observed data. These indepenindepen-dent components, also called sources or factors, can be found by [85]. Further techniques, based on image pro-cessing approaches, have been proposed in [86] and [87] by combining PCA/ICA and morphological transformations in the context of the classification of hyper-spectral images of urban areas. Recently, Wang and Chang [40] proposed three Independent Component Analysis (ICA) based dimensionality reduction methods for hyperspectral data. They have shown better results using their methods than using PCA and MNF.
Wavelet transforms have been used in hyperspectral data dimensionality reduc-tion [41, 42]. Wavelet transforms can preserve the high and low frequency features during the signal decomposition, hence preserving the spectral signatures. Plaza et al. [39] described sequences of extended morphological transformations for di-mensionality reduction and classification of hyperspectral datasets. Harsanyi and Chang [43] investigated hyperspectral image classification and dimensionality re-duction by using an orthogonal subspace projection approach. Phillips et al. [44] and He and Mei [45] used singular value decomposition and random projection, re-spectively, to reduce the dimensions of hyperspectral image data. Lower rank ten-sor approximation [46] and minimum change rate deviation [47] are proposed for hyperspectral image data by taking into account the spatial relation among neigh-boring image pixels. Recently, some local methods, which preserve the properties of local neighborhoods were proposed to reduce the dimensionality of hyperspec-tral images [33, 48–50], such as Locally Linear Embedding [48], Laplacian Eigen-map [51] and Local Tangent Space Alignment [52]. Their linear approximations, such as Neighborhood Preserving Embedding (NPE) [53], Locality Preserving Projection (LPP) [54] and Linear Local Tangent Space Alignment (LLTSA) [55] were recently applied to feature extraction in hyperspectral images [33, 56]. By considering neighborhood information around the data points, these local methods can preserve local neighborhood information and detect the manifold embedded in the high-dimensional feature space.
sep-CHAPTER2 2-3
arability. Two widely used supervised feature extraction methods for hyperspectral images are the Fisher’s Linear discriminant analysis (LDA) [57] and nonparamet-ric weighted feature extraction (NWFE) [35].
Linear discriminant analysis (LDA) [88–92] is a powerful classical supervised feature-extraction method for classification, even if it has been proposed for over 70 years. It is also called the parametric feature extraction method in [90], since LDA uses the mean vector and covariance matrix of each class. Usually,
within-class,between-class, and mixture scatter matrices are used to formulate the
cri-terion of class separability. A kernel-based LDA called generalized discriminant analysis (GDA) was proposed by [93] using a kernel approach. There are three drawbacks of LDA.
1. One is that it works well only if the distributions of classes are normal-like distributions. When the distributions of classes are non normal like or mul-timodal mixture distributions, the performance of LDA is not satisfactory; 2. The second disadvantage of LDA is that the rank of the between-class scatter
matrix is less than or equal toC−1, whereCis the number of the classes in the image. Hence, assuming sufficient number of observations, the rank of within-class scatter matrix isr≤d, then onlyrfeatures can be extracted; 3. The third limitation is that, if the within-class covariance is singular, which
often occurs in high-dimensional problems, LDA will have a poor perfor-mance on classification.
Lee and Landgrebe [94] proposed the Decision-Boundary Feature Extraction (DBFE) that can extract both discriminately informative features and discrimi-nately redundant features from the decision boundary. The approach uses the train-ing samples directly to determine the location of the decision boundary and em-ploys information about the decision hypersurfaces associated with a given clas-sifier to define an intrinsic dimensionality for the classification problem. Then, the corresponding optimal linear mapping can be obtained. NWFE was proposed in [35] to solve the problems of LDA. It also absorbs the idea of DBFE for deter-mining the location of the decision boundary by training samples. The basic ideals of NWFE are asigning different weights on every sample to compute the “weighted means” and compute the distance between samples and their weighted means as their “closeness” to boundary, then defining nonparametricbetween-classand
within-classscatter matrices which put large weights on the samples close to the
boundary and deemphasize those samples far from the boundary. The experimen-tal results of [17] and [87] show that NWFE outperforms LDA and DBFE. In [86] and [95], the authors suggest replacing DBFE by NWFE to obtain more effective features. Other papers show that NWFE outperforms LDA, approximated pairwise accuracy criterion linear dimension reduction, nonparametric discriminant analy-sis [35], and DBFE [96] in remote-sensing data sets.
2-4 RELATED WORK
Many extensions to both LDA and NWFE have been proposed in recent years, such as modified Fisher’s linear discriminant analysis [58], regularized linear dis-criminant analysis [36], modified nonparametric weight feature extraction using spatial and spectral information [59], and kernel nonparametric weighted feature extraction [60].
In real-world applications, labeled data are usually very scarce and labeling large amounts of data may sometimes require considerable human resources or expertise. On the other hand, unlabeled data are available in large quantities at very low cost. For this reason, semi-supervised methods [29, 61–66], which aim at improved classification by utilizing both unlabeled and limited labeled data gained popularity in the machine learning community.
Some of the representative semi-supervised learning methods include Co Train-ing [62] and transductive SVM [63, 64], and Graph-based semi-supervised learn-ing methods [65, 66]. Some semi-supervised feature extraction methods add a regularization term to preserve certain potential properties of the data. For ex-ample, semi-supervised discriminant analysis (SDA) [67] adds a regularizer into the objective function of LDA. The resulting method makes use of a limited num-ber of labeled samples to maximize the class discrimination and employs both labeled and unlabeled samples to preserve the local properties of the data. The ap-proach of [68] proposed a general semisupervised dimensionality reduction frame-work based on pairwise constraints, which employs regularization with sparse representation. Other semi-supervised feature extraction methods combine super-vised methods with unsupersuper-vised ones using a trade-off parameter, such as semi-supervised local Fisher discriminant analysis (SELF) [69]. However, it may not be easy to specify the optimal parameter values in these and similar semi-supervised techniques, as mentioned in [68, 69].
2.2
Feature extraction for hyperspectral images
An image pixel vectorxiis composed of all pixel valuesx1i, x1i,· · ·, x1N at one corresponding pixel location of the hyperspectral image data, see Fig. 2.1(a). The dimension of that image vector is equal to the number of hyperspectral bands. For a hyperspectral image with NR rows and NC columns there will beN =
NR×NC such vectors, namelyi = 1,2,· · · , N, see Fig. 2.1(b). Let{xi}Ni=1, xi ∈ <ddenote high dimensional data,{zi}Ni=1, andzi ∈ <rits low dimensional representations withr≤d. In our application,dis the number of spectral bands of hyperspectral images, andris the dimensionality of the projected subspace. The assumption is that there exists a mapping functionf :<d → <r, which can map every original data pointxitozi =f(xi)such that most information of the high dimensional data is kept in a much lower dimensional projected subspace. This mapping is usually represented by ad×rprojection matrixW:
CHAPTER2 2-5
(a) (b)
Figure 2.1: Hyperspectral image, (a) a pixel vector; (b) transfer the 3D hypercube into 2D matrix. zi =f(xi) =WTxi (2.1) zi= z1i z2i .. . zri = w11 w12 · · · w1r · · · w1d w21 w22 · · · w2r · · · w2d .. . ... ... ... ... ... wr1 wr2 · · · wrr · · · wrd x1i x2i .. . xri .. . xdi
where pixel vectorzi(i= 1,2,· · · , N)will form the firstrbands of the extracted features.
In many feature extraction methods, the projection matrixWcan be obtained by solving the following optimization problem, wherewdenotes one of the columns in the projection matrixW:
wopt= arg max
w
wTSw
wTSw (2.2)
The matricesSandShave specific meaning in different methods as we discuss later in the text. The solution to (2.2) is equivalent to solving the following gener-alized eigenvalue problem:
2-6 RELATED WORK
Or equivalently:
S−1Sw=λw (2.4)
The projection matrixW= (w1,w2,· · ·,wr)is made up by thereigenvectors of the matrixS−1Sassociated with the largestreigenvaluesλ1≥λ2≥ · · · ≥λr.
2.3
Unsupervised feature extraction methods
Unsupervised feature extraction methods deal with cases where no labeled sam-ples are available, aiming to find another representation of the data in lower di-mensional space by satisfying some given criterion. One of the best known unsu-pervised methods is Principle Component Analysis (PCA) [37], which is widely used for hyperspectral images [33, 38, 39]. Recently, some local methods, which preserve the properties of local neighborhoods were proposed to reduce the dimen-sionality of hyperspectral images [33, 48–50], such as Locally Linear Embedding [48], Laplacian Eigenmap [51] and Local Tangent Space Alignment [52]. Their linear approximations, such as Neighborhood Preserving Embedding (NPE) [53], Locality Preserving Projection (LPP) [54] and Linear Local Tangent Space Align-ment (LLTSA) [55] were recently applied to feature extraction in hyperspectral images [33, 56]. By considering neighborhood information around the data points, these local methods can preserve local neighborhood information and detect the manifold embedded in the high-dimensional feature space.
2.3.1
PCA
Principal Component Analysis (PCA) [37] performs feature extraction through analyzing the covariance matrix of the original data. The eigenvalues of the co-variance matrix are considered to be an indicator of the information content. Large values suggest more information content and low values indicate the presence of mostly noise. Due to its low complexity and the absence of parameters, PCA has been widely used for feature extraction in hyperspectral images [17]. In mathe-matical terms, PCA attempts to find a linear mappingwthat:
maxwTStw (2.5)
S.t. wTw=I
where the covariance matrix isSt = PNi=1(xi−u)(xi−u)T,u = N1 PNi=1xi is the mean of the vector,Iand1are the identity matrix. The constraint can be enforced by introducing a Lagrange multiplier λ. Therefore, an unconstrained maximization is performed as:
CHAPTER2 2-7
Component Eigenvalue (%) Cumulative (%)
1 72.48 72.48
2 24.64 97.13
3 1.73 98.86
4 0.37 99.23
5 0.2 99.42
Table 2.1: Eigenvalues and cumulative variance in percentages for AVIRIS Indian Pines with 220 bands.
wcan be got by differentiating the above function towand setting the result to 0, which results in:
df(w) dw = d dw(w T Stw+λ(1−wTw)) = 0 ⇒Stw−λw= 0 ⇒Stw=λw
The projection matrixWP CA = (w1,w2,· · ·,wr)can be optimized as fol-lows: wP CA= arg max w wTS tw wTw (2.7)
By setting S = St andS = I, we obtain the projection matrixWP CA =
(w1,w2,· · ·,wr)as in (2.2). The features extracted by PCA have the highest contrast or variance in the first band and the lowest contrast or variance in the last band. Therefore, the firstrPCA bands often contain the majority of information residing in the original hyperspectral images and can be used for more effective and accurate analyses because the number of image bands and the amount of image noise involved are reduced, see Fig. 2.2 and Table. 2.1.
2.3.2
LLFE
The above subsection presented PCA method for feature extraction which attempts to retain global properties of the data. In contrast, local nonlinear techniques like Isomap [97], Local Linear Embedding (LLE) [98, 99], Laplacian Eigenmaps (LE) [51] and Local Tangent Space Analysis (LTSA) [100], try to find a low-dimensional data representation by preserving local properties of the manifold. They applications to hyperspectral data can be found in [49]. However, when using these nonlinear local methods, one always encounter the following two problems: 1. “Out of sample” problem: this is a phenomenon in such that new samples