University of Massachusetts Amherst University of Massachusetts Amherst
ScholarWorks@UMass Amherst
ScholarWorks@UMass Amherst
Doctoral Dissertations Dissertations and Theses
November 2017
Spreadsheet Tools for Data Analysts
Spreadsheet Tools for Data Analysts
Daniel W. Barowy
University of Massachusetts Amherst
Follow this and additional works at: https://scholarworks.umass.edu/dissertations_2 Part of the Programming Languages and Compilers Commons
Recommended Citation Recommended Citation
Barowy, Daniel W., "Spreadsheet Tools for Data Analysts" (2017). Doctoral Dissertations. 1045. https://scholarworks.umass.edu/dissertations_2/1045
This Open Access Dissertation is brought to you for free and open access by the Dissertations and Theses at ScholarWorks@UMass Amherst. It has been accepted for inclusion in Doctoral Dissertations by an authorized administrator of ScholarWorks@UMass Amherst. For more information, please contact
SPREADSHEET TOOLS FOR DATA ANALYSTS
A Dissertation Presented by
DANIEL W. BAROWY
Submitted to the Graduate School of the
University of Massachusetts Amherst in partial fulfillment of the requirements for the degree of
DOCTOR OF PHILOSOPHY September 2017
c
Copyright by Daniel W. Barowy 2017
SPREADSHEET TOOLS FOR DATA ANALYSTS
A Dissertation Presented by
DANIEL W. BAROWY
Approved as to style and content by:
Emery D. Berger, Chair
Michael Ash, Member
Andrew McGregor, Member
Alexandra Meliou, Member
James Allan, Chair
ACKNOWLEDGMENT
First, I must thank my parents, Bill and Judy. You instilled me with the desire
to be a scientist at an early age1. Second, thanks to my little brother, Adam. You
enrolled in a graduate program before me, engendering a great deal of envy on my
part. Clearly you were having more fun. Thanks to you, I realized that a major life change was in order.
Many people helped me through the winding path to graduate school. Thanks to Peter D’Errico and Alan Gaitenby of the UMass Legal Studies Department, and Jae Young Lee, Wayne Snyder, and John Day of the Boston University Metropolitan College Computer Science Department.
I am honored to consider many fellow graduate students my friends: Charlie Curtsinger, John Altidor, Kaituo Li, John Vilk, Tongping Liu, Marianna Rapoport, Emma Tosch, Rian Shambaugh, Bobby Powers, and Sam Baxter. I hope that all of you appreciate the extent to which you made coming to work every day fun.
To Leeanne Leclerc and the UMass CS administrative staff: you rock! In addition to ensuring that I always dotted my i’s and crossed my t’s, you endured my many requests for equipment (e.g., projectors), frequently for questionable extracurricular activities (e.g., “PLASMA Movie Night”).
Many thanks to my mentors and collaborators Ben Zorn, Sumit Gulwani, Ted Hart, Eric Chung, Daniel Goldstein, Siddharth Suri, and Rodric Rabbah from whom I learned how to be a professional computer scientist. Thanks to the faculty who liberally offered me their advice and encouragement over the years, especially David
Jensen, Andrew McGregor, Yuriy Brun, Alexandra Meliou, Scott Kaplan, Steve Freund, Margaret Robinson, Heather Pon-Barry, and Jack Wileden.
I am incredibly fortunate to have ended up with Emery Berger as my advisor. Emery is much more than a research mentor. He pushed me to improve myself in ways I was neither aware of nor fully appreciated until afterward. Emery, working with you was fun and hard—exactly what I wanted from graduate school. Thank you.
Finally, my wife Karen deserves more thanks than anybody. Karen, you and I dreamed up the “Dan and Karen plan” a long time ago, and we stuck with it. I think that this is more of a testament to your character than it is to mine. For example,
you are serenely dealing with the fact as I write this that I neglected (again) to make
dinner. Newton once said “If I have seen further than others, it is by standing upon the shoulders of giants.” Having never married, Newton had a poor selection of giants. You are my giant. I honestly do not know how I could have done this without you.
ABSTRACT
SPREADSHEET TOOLS FOR DATA ANALYSTS
SEPTEMBER 2017
DANIEL W. BAROWY B.Sc., BOSTON UNIVERSITY
M.Sc., UNIVERSITY OF MASSACHUSETTS AMHERST Ph.D., UNIVERSITY OF MASSACHUSETTS AMHERST
Directed by: Professor Emery D. Berger
Spreadsheets are a natural fit for data analysis, combining a simple data storage and presentation layer with a programming language and basic debugging tools. Because spreadsheets are accessible and flexible, they are used by both novices and experts. Consequently, spreadsheets are hugely popular, with more than 750 million copies of Microsoft Excel installed worldwide. This popularity means that spreadsheets
are the most popular programming language on the planet and the de facto tool for
data analysis.
Nevertheless, spreadsheets do not address a number of important tasks in a typical analyst’s pipeline, and their design frequently complicates them. This thesis describes
three key challenges for analysts using spreadsheets. 1) Data wrangling is the process
of converting or mapping data from a “raw” form into another form suitable for use
with automated tools. 2) Data cleaning is the process of locating and correcting
spreadsheet program errors. These three tasks combined are estimated to occupy more than three quarters of a data analyst’s time. Furthermore, errors not caught during these steps have led to catastrophically bad decisions resulting in billions of dollars in losses. Advances in automated techniques for these tasks may result in dramatic savings in both time and money.
Three novel programming language-based techniques were created to address these
key tasks. The first, automatic layout transformation using examples, is a program
synthesis-based technique that lets spreadsheet users perform data wrangling tasks
automatically, at scale, and without programming. The second, data debugging, is
technique for data cleaning that combines program analysis and statistical analysis to
automatically find likely data errors. The third, spatio-structural program analysis
unifies positional and dependence information and finds spreadsheet errors using a kind of anomaly analysis.
Each technique was implemented as an end-user tool—FlashRelate,
Check-Cell, and ExceLint respectively—in the form of a point-and-click plugin for
Mi-crosoft Excel. Our evaluation demonstrates that these techniques substantially improve user efficiency. Finally, because these tools build on each other in a complementary fashion, data analysts can run data wrangling, cleaning, and formula auditing tasks together in a single analysis pipeline.
TABLE OF CONTENTS
Page
ACKNOWLEDGMENT . . . .iv
ABSTRACT. . . .vi
LIST OF TABLES. . . .xiv
LIST OF FIGURES. . . xv CHAPTER INTRODUCTION. . . .1 0.0.1 Data wrangling . . . 1 0.0.2 Data cleaning . . . 2 0.0.3 Formula auditing . . . 2 0.0.4 Contributions . . . 2 1. BACKGROUND . . . .4
1.1 Data wrangling: Automation is layout sensitive . . . 5
1.1.1 Related Work . . . 8
1.1.1.1 Programming-By-Example . . . 9
1.1.1.2 Language Approaches . . . 9
1.1.1.3 Algorithmic Approaches . . . 9
1.1.1.4 Machine Learning . . . 10
1.2 Data cleaning: Input errors . . . 10
1.2.1 Related Work . . . 11
1.2.1.1 Database Cleaning . . . 11
1.2.1.2 Statistical Outlier Analysis . . . 12
1.3 Formula auditing: Formula reference errors . . . 13
1.3.1 Spreadsheet Error Detection . . . 15
1.3.2 Related Work . . . 16
1.3.2.1 Microsoft Excel . . . 17
1.3.2.2 Spreadsheet “Smells” . . . 19
1.3.2.3 Type and Unit Checking . . . 20
1.3.2.4 Other Approaches to Spreadsheet Correctness . . . 20
1.3.2.5 Anomaly Analysis . . . 21
2. FLASHRELATE: EXTRACTING RELATIONAL DATA FROM SEMI-STRUCTURED SPREADSHEETS USING EXAMPLES. . . 23
2.1 Approach . . . 24
2.2 The FlareTransformation Language . . . 24
2.2.1 Example . . . 26 2.2.2 Constraints . . . 27 2.2.2.1 Cell Constraints . . . 27 2.2.2.2 Spatial Constraints . . . 28 2.2.2.3 Geometric Descriptors . . . 28 2.3 Algorithm . . . 29 2.3.1 Synthesis Goals . . . 30 2.4 FlashRelate Implementation . . . 31 2.4.0.1 Ranking . . . 31 2.4.0.2 Pruning . . . 32 2.4.0.3 Data Structures . . . 32 2.5 Evaluation . . . 32 2.5.0.1 Benchmark Selection . . . 33 2.5.0.2 Expressiveness . . . 33 2.5.0.3 Synthesizer Experiments . . . 33 2.5.1 Results . . . 34 2.6 Conclusion . . . 35
3. CHECKCELL: DATA DEBUGGING FOR SPREADSHEETS. . . 37 3.1 Approach . . . 37 3.1.1 Example . . . 38 3.2 Algorithms . . . 39 3.2.1 Dependence Analysis . . . 40 3.2.2 Impact Analysis . . . 40 3.2.2.1 Function Classes . . . 40
3.2.2.2 Non-Parametric Methods: The Bootstrap . . . 41
3.2.3 Impact Scoring . . . 42 3.3 Analysis . . . 43 3.3.1 Number of Resamples . . . 43 3.3.2 Efficiency of Caching . . . 43 3.4 CheckCellImplementation . . . 44 3.5 Evaluation . . . 45 3.5.0.1 Experimental Methodology . . . 45
3.5.0.2 Quantifying User Effort . . . 46
3.5.0.3 Quantifying Error . . . 46
3.5.0.4 Classifier Accuracy . . . 47
3.5.0.5 Error Generator . . . 47
3.5.1 Experimental Results . . . 47
3.5.1.1 Precision and Recall . . . 47
3.5.1.2 Effort . . . 50
3.5.1.3 Execution Time . . . 50
3.5.1.4 Summary . . . 50
3.5.2 Case Study: The Reinhart and Rogoff Spreadsheet . . . 51
3.6 Conclusion . . . 52
4. EXCELINT: DEBUGGING SPREADSHEETS WITH SPATIAL AND STRUCTURAL ANALYSIS . . . 53
4.1.0.1 1st Phase: Discovering Formula Reference
Behavior . . . 54
4.1.0.2 2nd Phase: Finding Likely Reference Invariants . . . 56
4.1.0.3 3rd Phase: Finding Likely Bugs . . . 56
4.1.1 Contributions . . . 58
4.1.2 Spatio-Structural Analysis . . . 59
4.1.3 Reference Bugs . . . 60
4.1.3.1 Bug Duals . . . 61
4.2 Algorithms . . . 62
4.2.1 Parsing and Data Dependence Analysis . . . 62
4.2.1.1 Parsing . . . 62 4.2.1.2 Dependence Analysis . . . 63 4.2.2 Data References . . . 64 4.2.3 Reference Vectors . . . 65 4.2.3.1 Addressing Modes . . . 66 4.2.3.2 Vector Form . . . 67 4.2.3.3 Computational Agnosticism . . . 68 4.2.3.4 Relative Vectors . . . 68 4.2.3.5 Reference Conversion . . . 69 4.2.4 Vector Fingerprints . . . 69 4.2.4.1 Location-Free Fingerprints . . . 70 4.2.4.2 Location-Sensitive Fingerprints . . . 71 4.2.5 Vector Clustering . . . 71 4.2.5.1 Rectangular Decomposition . . . 72
4.2.5.2 Rectangular Decomposition Algorithm . . . 73
4.2.5.3 Adjacency Coalescing . . . 75
4.2.6 Proposed Fixes . . . 75
4.2.7 Entropy-Based Error Model . . . 76
4.2.7.1 Re-clustering . . . 78
4.2.7.2 Producing a Set of Fixes . . . 79
4.2.7.3 Fix Distance . . . 85
4.2.7.4 Entropy Reduction Impact Score . . . 86
4.3 ExceLintImplementation . . . 86
4.3.1 Visualizations . . . 87
4.3.1.1 Regularity Map . . . 87
4.3.1.2 Proposed Fixes . . . 90
4.3.2 Optimizations . . . 92
4.3.2.1 Programming Language Issues . . . 93
4.3.2.2 Grid Preprocessing . . . 94 4.3.2.3 Bitvector optimization . . . 95 4.4 Evaluation . . . 97 4.4.1 Goals . . . 97 4.4.2 Result Summary . . . 97 4.4.3 Evaluation Platform . . . 98
4.4.4 RQ1: Does ExceLint’s Regularity Map Find New Bugs? . . . 98
4.4.4.1 Procedure . . . 99
4.4.4.2 Results . . . 101
4.4.5 RQ2: Is the ExceLintProposed Fix Tool Precise? . . . 102
4.4.5.1 Procedure . . . 102
4.4.5.2 Results . . . 102
4.4.5.3 Summary . . . 106
4.4.6 RQ3: How Does ExceLintCompare Against CUSTODES? . . . 106
4.4.6.1 Procedure . . . 106
4.4.6.2 Results . . . 107
4.4.6.3 Summary . . . 109
4.4.7 RQ4: Is ExceLintFast? . . . 110
4.4.8 Case Study: The Reinhart and Rogoff Spreadsheet . . . 111
4.5 Conclusion . . . 115
5. FUTURE DIRECTIONS . . . 119
6. CONCLUSIONS. . . 121
6.0.1 Data Wrangling . . . 121
6.0.3 Formula Auditing . . . 122
APPENDICES
A. FLARE SEMANTICS AND FLASHRELATE
ALGORITHMS. . . 124 B. NUMBER OF RESAMPLES . . . 129
LIST OF TABLES
Table Page
4.1 ExceLintand CUSTODES precision for reference bugs. . . 115
4.2 ExceLintand CUSTODES precision for smells. . . 116 4.3 ExceLintand CUSTODES analysis run times. . . 117
LIST OF FIGURES
Figure Page
1.1 A semi-structured spreadsheet excerpt with two sample tuples
highlighted. . . 5
1.2 A normalized spreadsheet excerpt with two sample tuples highlighted. . . 6
1.3 A Visual Basic for Applications program for extracting spreadsheet data into a normal form. . . 7
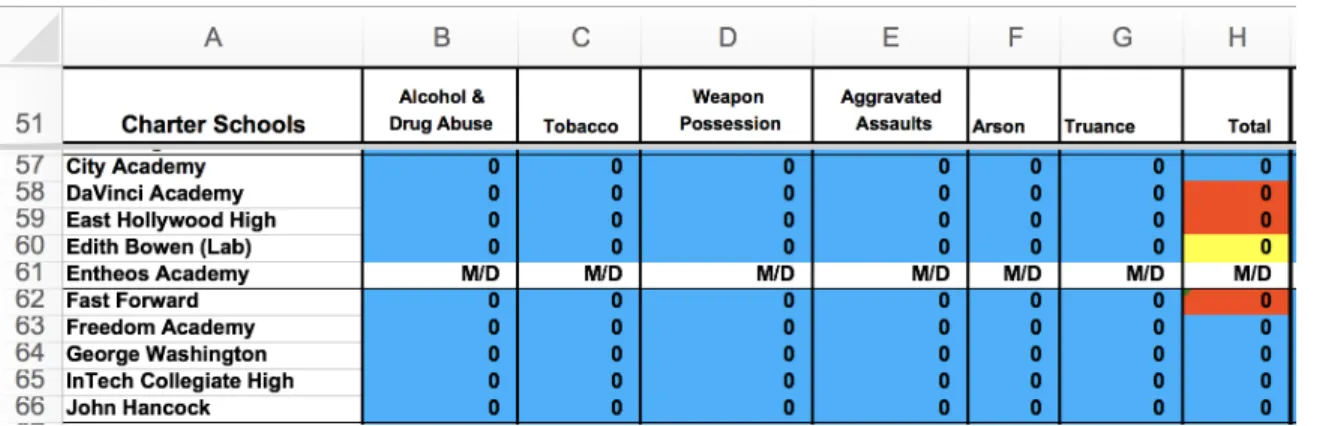
1.4 An example spreadsheet containing several errors. . . 16
1.5 Errors are obscured in Excel’s default view. . . 16
1.6 Error checking rules provided by Microsoft Excel 2013. . . 17
1.7 An Excel false positive. . . 18
2.1 Flaresyntax. . . 25
2.2 Flareprogram that converts Figure 1.1 into Figure 1.2. . . 26
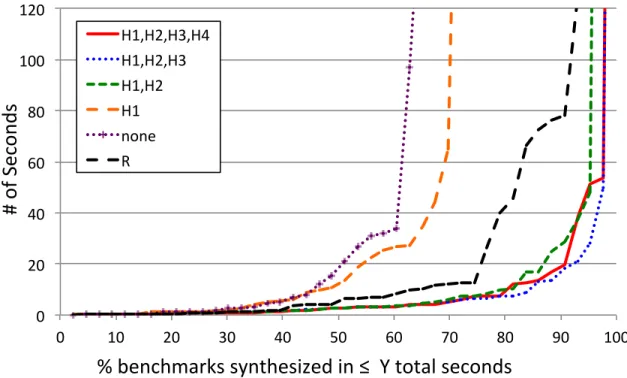
2.3 FlashRelate synthesis run time. . . 35
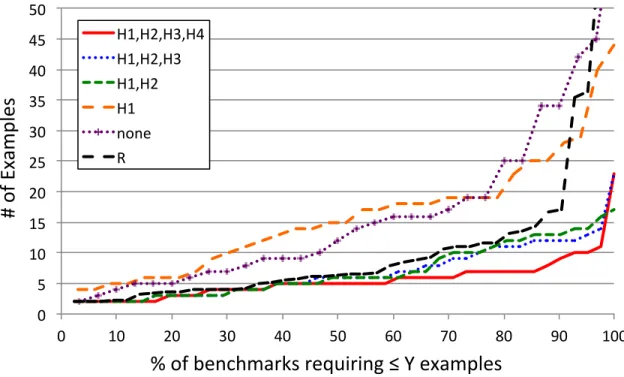
2.4 Number of examples needed for FlashRelate. . . 36
3.1 A typical gradesheet containing an error. . . 38
3.2 CheckCellonly requires that a user specify the maximum percentage of spreadsheet inputs to audit. . . 38
3.3 The distribution of input errors. . . 48
3.4 Precision and recall. . . 48
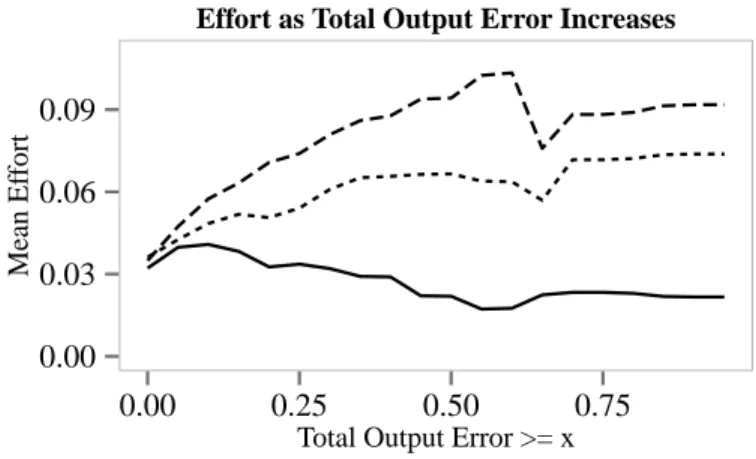
3.5 For errors that cause a small total error,CheckCell requires about the same mean effort as NAll. . . 49
4.1 Finding a bug using ExceLint’s regularity map. . . 59
4.2 Finding a bug using ExceLint’s proposed fix tool. . . 59
4.3 Spreadsheet dependence analysis algorithm. . . 64
4.4 The set of reference vectors for a formula. . . 65
4.5 BinaryMinEntropyTreealgorithm. . . 74
4.6 A spreadsheet with an unusual invariant. . . 83
4.7 An example with high entropy invariant clusters. . . 84
4.8 The ExceLinttoolbar. . . 87
4.9 A buggy spreadsheet shown with Excel’s formula view. . . 88
4.10 A buggy spreadsheet shown using ExceLint’s regularity map. . . 88
4.11 The Hue-Saturation-Luminosity (HSL) color model. . . 90
4.12 ExceLintuses complementary colors to highlight adjacent clusters. . . 91
4.13 The proposed fix tool in use. . . 91
4.14 The complete set of candidate bugs for an example spreadsheet. . . 92
4.15 ExceLint’s bug finder visualization. . . 100
4.16 ExceLint’s precision finding reference bugs across the CUSTODES benchmark suite. . . 103
4.17 CUSTODES’ precision finding reference bugs across the CUSTODES benchmark suite. . . 104
4.18 ExceLint’s mix of true and false positives finding reference bugs for the CUSTODES suite. . . 107
4.19 CUSTODES’s mix of true and false positives finding reference bugs for the CUSTODES suite. . . 108
4.21 ExceLint’s performance across the CUSTODES benchmark
suite. . . 111
4.22 Reinhart-Rogoff reference anomalies. . . 112
4.23 Reinhart-Rogoff reference invariant. . . 113
A.1 Types for a simple abstract spreadsheet model. . . 125
A.2 Formal semantics for the Flare language. . . 126
A.3 Synthalgorithm. . . 126
A.4 FlashRelate’s program search procedure. . . 127
A.5 LearnC algorithm. . . 127
INTRODUCTION
Spreadsheets are one of the most popular applications on the planet, with more than 750 million estimated users of Microsoft Excel alone. Their point-and-click interface and intuitive interaction model means that novice users can start using them quickly and with little training. Their apparently simplicity belies a sophisticated dynamic, functional programming language, a reactive presentation layer, automated processing and debugging facilities, and many other features. Given these features,
spreadsheets are also appealing to many experts, and are therefore thede facto tool
of choice for data analysis.
Unfortunately, a number of key tasks in a typical data analysis pipeline are not well supported by spreadsheets. This dissertation addresses three tasks that remain
challenging in the context of spreadsheets: data wrangling, data cleaning, and formula
auditing. Collectively, these three tasks comprise the majority of a data analysts’s
time.
0.0.1 Data wrangling
The first problem arises because spreadsheets allow users great flexibility in storing data. This flexibility comes at a price: users often treat spreadsheets as a poor man’s database, leading to creative solutions for storing high-dimensional data. The trouble occurs when users need to answer queries. Data manipulation tools make strong assumptions about data layouts and cannot read these ad hoc databases. Converting
data into an appropriate layout, a task called data wrangling, requires programming
0.0.2 Data cleaning
The second problem is that data inputs frequently contain errors and omissions.
Addressing these data issues, a task called data cleaning, is necessary to ensure that
the ensuing calculations are correct. Finding data errors is complicated by the size of datasets and the fact that it is typically impossible to know a priori which inputs are wrong, since data rarely comes with precise specifications. Worse, some calculations are sensitive to input errors while others are not, meaning that there is not necessarily a correlation between the magnitude of the input error and the effect that error has on the calculation that depends on it.
0.0.3 Formula auditing
The third problem is that, like ordinary programs, spreadsheet programs frequently contain programming errors. Spreadsheet environments encourage poor programming practices. For example, spreadsheets lack high-level abstractions like user-defined functions, encouraging programmers to manually copy formulas to perform repeated calculations, so the number of formulas scales with the input data. Consequently, it is increasingly difficult to ensure correctness as spreadsheets grow.
0.0.4 Contributions
This dissertation presents three techniques that address the key data analysis tasks outlined above. Collectively, these techniques substantially reduce the effort required for data analysts to produce large-scale, bug-free spreadsheets.
1. Automatic layout transformation using examples is a program synthesis-based technique that lets ordinary users convert ad hoc layouts into relational tables without programming. Instead, users supply examples of the desired
output rows. At its core is Flare, a novel extraction language that extends
algorithm generates Flareprograms in seconds from a small set of examples in
a wide variety of real-world scenarios. FlashRelate, an interactive tool for
Microsoft Excel, builds on these core techniques, letting end users extract data by pointing and clicking.
2. Data debuggingis an approach that combines program analysis and statistical
analysis to automatically find likely data errors. Testing and static analysis can
help root out bugs in programs, but not in data. Since it is impossible to know a priori whether data are erroneous, data debugging instead locates data that has a disproportionate impact on the computation. Such data is either very important
or wrong. CheckCell, the first data debugging tool for Microsoft Excel, was
built to evaluate this approach. CheckCell is more precise and efficient than
standard outlier detection techniques, and it automatically identifies a key flaw in the infamous Reinhart and Rogoff spreadsheet.
3. Spatio-structural program analysis is a hybrid statistical and static
pro-gram analysis for spreadsheet formulas, designed to locate data reference errors,
a common form of spreadsheet program bug. The analysis leverages the obser-vation from conventional programming languages that anomalous code is often wrong. Spatio-structural analysis extends this finding to spreadsheet programs by learning likely data reference invariants; deviations from these invariants often
indicates a data reference error. We built ExceLint, a spatio-structural bug
finding tool for Microsoft Excel. Evaluated against 29 real-world spreadsheets,
ExceLint dramatically reduces the effort needed to audit spreadsheets and it
improves on the state of the art by providing a high precision, user-friendly tool that finds three times the number of reference bugs identified by previous state of the art tools.
CHAPTER 1
BACKGROUND
Despite the availability of tools and techniques for programming data analyses using spreadsheets, this task remains a challenge. An end-to-end view of the data analysis pipeline is illustrative. Problems often start at the very beginning, when importing data. Users must choose a layout for their data, often before they know exactly how the data will be used. Revising these layouts, in order to make an analysis
possible, is called data wrangling. Next, data quality must be addressed as users
discover that their data contains errors, missing values, and other irregularities. This
activity is calleddata cleaning. After writing analysis code, programs are often flawed.
Programmers remove these errors by debugging their programs. Programmers rarely
perform these activities in a linear fashion, revisiting the same steps over and over. Data wrangling and data cleaning are estimated to comprise anywhere from 50-80% of an analyst’s time [65]. Debugging is conservatively estimated to comprise 50% of an
analyst’s remaining time [95]. At best, an analyst spends a meager 25% of their time
actually developing the desired data analysis code. Even worse, errors sometimes go completely unnoticed during development, meaning that flawed analyses are produced and relied upon for critical decision-making.
This dissertation aims to improve analyst productivity and effectiveness by intro-ducing techniques designed to reduce the amount of time spent doing these ancillary activities and to support the development of correct analyses. The following sections expand on these problems and detail prior attempts at resolving them.
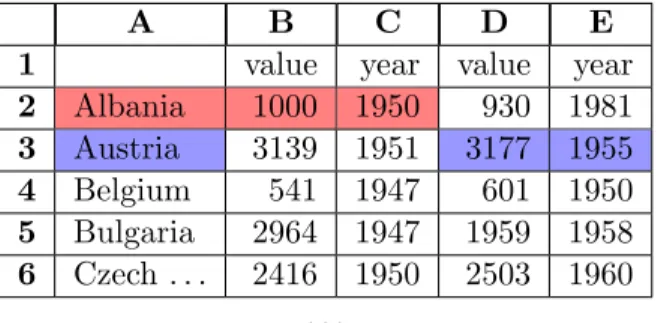
A B C D E
1 value year value year
2 Albania 1000 1950 930 1981 3 Austria 3139 1951 3177 1955 4 Belgium 541 1947 601 1950 5 Bulgaria 2964 1947 1959 1958 6 Czech. . . 2416 1950 2503 1960 . . .
Figure 1.1: A semi-structured spreadsheet excerpt with two sample tuples highlighted. The first tuple (red) represents the timber harvest (per 1000 hectares) for Albania in 1950. The second tuple (blue) represents the timber harvest for Austria in 1950.
1.1
Data wrangling: Automation is layout sensitive
Spreadsheets combine their data model and view, a combination that gives sheet creators a high degree of freedom when laying out their data. Although
spread-sheets are tabular and ostensibly two-dimensional tables, end users may store any
high-dimensional data in a spreadsheet as long as they can devise a spatial layout (using, e.g., headers, whitespace, and relative positioning) that projects that data into two dimensions. As a result, while spreadsheets allow compact and intuitive visual representations of data well suited for human understanding, their flexibility compli-cates the use of powerful data-manipulation tools (e.g., relational queries) that expect
data in a certain form. We refer to these spreadsheets as semi-structured because
their data is in a regular format that is nonetheless inaccessible to data-processing
tools. Unless semi-structured data can be decoded into the appropriate normal form
expected by these tools, data is effectively “locked-in” to the user’s format.
This lock-in problem is widespread. Research suggests that few spreadsheets are trivially convertible to database relations. Only 22% of 200 randomly-chosen spreadsheets scraped from the web can be converted by performing “Export as CSV.” [23] For a user with data trapped in one of these formats, little hope is available in the form of off-the-shelf tools.
Country Harvest Date Albania 1000 1950 Albania 930 1981 . . . Austria 3139 1951 Austria 3177 1955 . . . Belgium 541 1947 Belgium 601 1950 . . .
Figure 1.2: A normalized spreadsheet excerpt with two sample tuples highlighted. The highlighted tuples are the same as shown in Figure 1.1.
The spreadsheet shown in Figure 1.1 pairs timber harvest values with their year in a structure that repeats to the right for each country listed in the column on the left.
While this spreadsheet may be convenient to answer certain queries1, for others it
presents difficulties. For example, the simple query “How many years did the timber harvest exceed 2000?” cannot be answered without complex selection logic like the kind shown in the Visual Basic for Applications program in Figure 1.3. By contrast, the same data, laid out in the form shown in Figure 1.2, trivially answers the same query using Microsoft Excel’s point-and-click “wizard” tools.
Users are faced with a difficult choice. One option is to choose the layout best
suited for processingbefore any data entry has started. The other option is to reformat
data after entry. Assuming that the user even knows what queries they intend to run, the first option makes processing easy but may require data entry using an inconvenient form. Furthermore, knowing the right database “normal form” requires formal training in database theory, which is not likely to be common given that the majority of spreadsheet users are not professional programmers. The alternative facilitates data entry and may be visually appealing, but users must either write
F u n c t i o n E x t r a c t () As C o l l e c t i o n ... Set T u p l e s = New C o l l e c t i o n r Y e a r . P a t t e r n = " ^ 1 9 [ 0 - 9 ] { 2 } $ " r V a l u e . P a t t e r n = " ^ [ 0 - 9 ] + $ " For E a c h ws In W o r k s h e e t s For E a c h c e l l In ws . U s e d R a n g e x = c e l l . C o l u m n y = c e l l . Row x _ r t = x + 1 If r Y e a r . T e s t ( c e l l . V a l u e ) _ And r V a l u e . T e s t ( _ ws . C e l l s ( y , x _ r t ). V a l u e ) T h e n Dim t u p l e C o o r d s t u p l e C o o r d s = A r r a y ( ws . Index , x , _ y , x_rt , y ) T u p l e s . Add ( c e l l C o o r d s ) End If N e x t N e x t E x t r a c t = T u p l e s End F u n c t i o n
Figure 1.3: A Visual Basic for Applications program for extracting spreadsheet data into a normal form. This program contains navigation logic and must maintain a tabular data structure (a collection of tuples). This program produces the extraction shown in Figure 1.2. Variable declarations and driver code are omitted for brevity.
selection code—well beyond the capabilities of most spreadsheet users—or be willing to manually reformat (i.e., re-enter) the data. Given that many users make the wrong layout choice with respect to automation, many spreadsheets are effectively “locked”
into ad hoc formats.
Finally, it is frequently the case that analysts are forced to work with data in the form that is given to them. For instance, the U.S. federal government’s Open Data Policy transparency initiative requires that all newly-generated data to be machine readable, and except in certain circumstances, publicly available. As of the time of this dissertation, there are more than 15,000 datasets in the CSV spreadsheet format
available on their website, data.gov. Nonetheless, given the set of queries that a
user has in mind, this freely-accessible data may not be simple to query without first
changing the layout. Although data.govis a large-scale effort to make data available,
this data is still inaccessible to a large number of interested parties—e.g., journalists, policy makers, and educators—because these parties may not possess skills needed to automatically reformat the data.
1.1.1 Related Work
There are many approaches to data wrangling. By contrast to the techniques
described below, this dissertation proposes a solution for arbitrary transformations
(relying on no database of patterns) that need not be hierarchical. We believe that this dissertation presents strong evidence that the appropriate transformation schema is task-dependent; in other words, there is no single “best” transformation. Finally, our approach does not require that users understand the transformation logic itself, which may be complex. Users need only understand the end result of transformation
logic, instead driving the transformation process by supplying sample transformed
1.1.1.1 Programming-By-Example
The area of programming by example (which includes FlashRelate) promises
to enhance productivity for end users [46, 64]. The most closely related work is
ProgFromEx [50], which performs tabular transforms for spreadsheets already in
tabular format using a version-space algebra and input-output example pairs. Another
recent technology, Quicksilver [66], synthesizes relational algebra queries over
normalized spreadsheet tables. Quicksilver cannot handle any of the transformation
tasks in our benchmarks. FlashExtract is a by-example framework for extracting
data from text files [63]. FlashExtract uses only relative string positions, so it
cannot make use of 2D spatial information (including the motivating example in
Fig. 1.1). FlashExtract programs are strictly hierarchical, so multiple constraints
cannot refer to “overlapping” regions.
1.1.1.2 Language Approaches
SXPath[75] includes spatial primitives in its queries. ThePADSproject simplifies
ad hoc data-processing tasks for programmers by developing DSLs and learning
algorithms to extract data from textual formats [40]. OpenRefine helps users clean
and transform their spreadsheet data into relational form, but requires that users program [89]. None of these synthesize extraction programs.
1.1.1.3 Algorithmic Approaches
An important related body of work focuses on extracting relational data from data
on web pages [16,39]. WhileSILA[74] defines spatial abstractions likeFlashRelate,
it extracts records algorithmically, and not from examples. Gyro[52] expresses spatial
constraints in the form of geometric regions. Gyro’s inference algorithm is based on
1.1.1.4 Machine Learning
Wrappers are procedures to extract data from Internet resources. Wrapper
in-duction automatically constructs such wrappers [62]. There has been a wide variety
of work in this area, ranging from supervised systems [57, 62, 72], semi-supervised
systems [19], to unsupervised systems [27]. Senbazuru [21] automatically infers
hierarchical structure in spreadsheets using a set of classifiers. By contrast,
FlashRe-late can be used to performarbitrary extraction tasks from arbitrary spreadsheets.
HaExcel [28] focuses on recovering the true relational schema from the spreadsheet
data. Wrangler automatically infers likely transformation rules and presents them
in natural language. Two pitfalls with Wrangler are that users must be
under-stand the potential effects of the available transforms, and must be capable of finding
alternate transforms in the event that the inference is wrong.
1.2
Data cleaning: Input errors
After an analyst has the data in the right form, it must be inspected to ensure that is error-free. Regardless of the source of the data, data errors are common. Prior work has shown that data errors often arise from the following sources [51]: 1) Data entry errors, including typographical errors and transcription errors from illegible text. 2) Measurement errors, when the data source itself, such as a disk or a sensor, is faulty or corrupted. 3) Data integration errors, where inconsistencies arise due to the mixing of different data, including unit of measurement mismatches.
For typographical errors alone, users make a mistake for every 0.5% to 1.23% of characters typed on average [11, 77]. For spreadsheets, this translates to data cells containing errors at a rate of approximately 5% [77, 78]. Unfortunately, this means that for spreadsheets of even a modest size (at least 50 cells), at least one error is highly likely (72%) [76, 78].
Manual checking scales poorly with data input size. Existing automatic approaches
to data cleaning include statistical outlier detection, cross validation, andinput
val-idation. Outlier detection reports data anomalies by comparing them to a known
distribution. Spreadsheets do not supply information about input distributions and it is unlikely the spreadsheet users know them. Cross-validation requires fault-free comparison data, which may difficult or impossible to procure. Programmers perform input validation by writing validation routines that mechanically check that inputs match a specification. Beside being difficult to define precisely—data rarely comes with a precise specification—no commonly-used spreadsheet package currently has this capability.
Finally, none of these techniques capture an entire class of important subtle errors: inputs that would pass automated checking but that nonetheless cause unusual program behavior. Depending on the computation, an input error could be an outlier
that has no effect (e.g., MIN() of a set of inputs containing an erroneously large
value), or a non-outlier that affects a computation dramatically (e.g., IF A1 = 0,
"All is Well", "Fire Missiles"). Like regular programs, spreadsheets are often a mix of functions that consume and produce both numbers and strings. Automatic error-checking therefore must be capable of handling a wide variety of data types while ideally being sensitive to the effect the error has on the program.
1.2.1 Related Work
1.2.1.1 Database Cleaning
Most past work on locating or removing errors in data has focused on data cleaning
for database systems [48, 80]. Standard approaches include statistical outlier analysis for removing noisy data [94], interpolation (e.g., with averages), and cross-correlation with other data sources [54].
A number of approaches have been developed that allow data cleaning to be expressed programmatically or applied interactively. Programmatic approaches include
AJAX, which expresses a data cleaning program as a DAG of transformations from
input to output [44]. Data Auditor applies rules and target relations entered by
a programmer [45]. A similar domain-specific approach has been employed for data
streams to smooth data temporally and isolate it spatially [59]. Potter’s Wheelis an
interactive tool that lets users visualize and apply data cleansing transformations [81]. To identify errors, Luebbers et al. describe an interactive data mining approach based on machine learning that builds decision trees from databases. It derives logical
rules (e.g., “BRV = 404 ⇒ GBM = 901”) that hold for most of the database, and
marks deviations as errors to be examined by a data quality engineer [67]. Raz et
al. describe an approach aimed at arbitrary software that uses Daikon to infer
invariants about numerical input data and then report discrepancies as “semantic anomalies” [35, 82]. Data debugging is orthogonal to these approaches: rather than searching for latent relationships in or across data, it measures the interaction of data with the programs that operate on them.
1.2.1.2 Statistical Outlier Analysis
Outlier analysis dates to the earliest days of statistics, with some of its earliest uses found in making nautical measurements more robust. Widely-used approaches include Chauvenet’s criterion, Peirce’s criterion, and Grubb’s test for outliers [10]. For spreadsheets specifically, Benford’s Law [73] is frequently used by forensic analysts to
detect fraudulent data [15, 73]. All of these techniques are parametric: they require
that the data belong to a known distribution, e.g., Gaussian (normal). Unfortunately, input data does not neatly fit into a predefined statistical distribution. Moreover, identifying outliers leads to false positives when they do not materially contribute to
the result of a computation (i.e., have no impact). By contrast, data debugging only reports data items with a substantial impact on a computation.
1.2.1.3 Sensitivity Analysis
Sensitivity analysis is a method used to determine how varying an input affects a model’s range of outputs. Most sensitivity analyses are analytic techniques; however, the one-factor-at-a-time technique, which systematically explores the effect of a single parameter on a system of equations, is similar to data debugging in that it seeks to numerically approximate the effect of an input on an output. Recent research employing techniques from sensitivity analysis in static program analyses seeks to determine whether programs contain “discontinuities” that may indicate a lack of program robustness [4, 20, 47].
Data debugging differs from sensitivity analysis in two important respects. First, data debugging is a fully-automated black-box technique that requires only dependence information. Second, unlike sensitivity analysis, data debugging does not vary a parameter through a known range of valid values, which must be parameterized by an analyst. Instead, data debugging infers an output distribution via a nonparametric statistical approach that does not require analysts to supply parameters.
1.3
Formula auditing: Formula reference errors
The last step in an analyst’s pipeline is to write code that performs an analysis. Like other programming tasks, data analyses can have bugs. Nonetheless, despite many years of research into automatically detecting and correcting programming errors, spreadsheet users still make programming logic errors at an alarmingly high rate. Recent work shows that 5% of all spreadsheet formulas contain an error, a figure that is consistent with traditional (non-spreadsheet) programs [77]. Many of these errors go uncaught because automated analysis tools for spreadsheets are particularly
ineffective. A recent study of commercial static analysis tools for spreadsheets found that they discovered formula errors at an extremely low rate: only 0.52% of errors were correctly identified [8].
An important class of formula errors arereference errors, an error that occurs when
a formula fails to refer to the correct set of inputs. One way that reference errors occur is because of a shortcoming in spreadsheet languages: spreadsheets have no facility for function abstraction or subroutines. Users repeat calculations by copying and pasting formula strings. When a user fails to update references during this copy-and-paste workflow, reference errors occur. The likelihood of making an error increases as the size of repeated calculations grows, making these errors hard to find.
Excel’s “formula fill” feature is intended to mitigate this problem by automatically copying and updating formulas. Unfortunately, to operate correctly, users must
manually insert address mode annotations into the original formula. For example,
when using formula fill to copy the formula =A1 * B1 from cell C1 to cells C2, ...,
C10such that the copies refer toB2, ..., B10 respectively, but that the reference to
cell A1 remains constant2, users must first modify the original formula. Using Excel’s
“absolute addressing mode” annotation,$, the original formula should be changed to
=$A$1 * B1before invoking formula fill. If this modification is not performed, formula
fillinserts reference errors. For example, using the unmodified formula, it generates
the formulas =A2 * B2, =A3 * B3, =A4 * B4, and so on.
Another form of reference error is a failure to refer to all of the relevant data in a range of cells. These kinds of omissions, referred to by one researcher as “the most dangerous type of error,” are especially insidious because there is nothing obviously wrong with the spreadsheet [77]. Inadvertent omissions were a key contributor to the
2
flawed conclusion in the infamous Reinhart-Rogoff spreadsheet, whose logic was used to justify flawed fiscal austerity measures in the European Union [55].
1.3.1 Spreadsheet Error Detection
The unconstrained nature of spreadsheets, in contrast to most conventional pro-gramming languages, complicates automatic error checking. Spreadsheets have only rudimentary dynamic datatypes, no facilities for structured or object-oriented pro-gramming, and no user-defined functions. Beyond obvious errors like unparseable formulas or math errors like division by zero, in general, knowing whether a given formula is in error requires knowing user intent, which is well beyond the capabilities of state of the art program analyses. While it is sometimes possible to glean this information from semantic cues, such as headers (e.g., a column with the header “Totals” probably contains numeric sums), this evidence is at best circumstantial.
Nonetheless, upon inspection, humans can often reason about user intent and find unambiguously incorrect programs that produce wrong output. This work refers to
these bugs as manifest errors. A second, more pernicious form of error is a latent
error, which produces the correct output, but only by accident. This second class of
errors surfaces as manifest errors only later in the life cycle of a spreadsheet when
data values are updated. Reference errors, the focus of this work, can be found both
as manifest and latent errors.
Cell H58 in Figure 1.4 shows a manifest error. The programmer’s intent was to
compute a row total, however an off-by-one reference error means that the total displayed is for the wrong row. Note that in Excel, this problem can only be spotted by first switching to “formula view” and then by clicking on the reference inside the formula, which highlights it. For large spreadsheets, this approach does not scale.
Cell H57 in Figure 1.4 shows a latent error. While it happens to be true that the
Figure 1.4: An example spreadsheet containing several errors. This spreadsheet was
drawn from the FUSE corpus [9], shown here using Excel’s “formula view”. Cell H58
is a manifest error, computing a total for the wrong row (H59 andH60 have the same
bug). Cell H57 shows a more subtle latent error—a missing formula—which will only
appear when data inB57 through G57 are updated.
Figure 1.5: Errors are obscured in Excel’s default view. The same spreadsheet shown in Figure 1.4. Errors are harder to spot because formulas are hidden.
the user of the spreadsheet to later update the values in B57through G57, the total
would be wrong.
Neither of these errors are obvious as is shown in Figure 1.5, which shows that Excel’s default view obscures them. In both cases, Excel’s built-in error checking feature fails to flag these cells.
1.3.2 Related Work
Conventional error-checking tools for spreadsheets, like those found in Microsoft
Excel, rely onad hoc patterns that are believed to be indicative of errors. Recent work
in the software engineering community focuses on detecting spreadsheet smells, which
like error rules are anti-patterns that reflect violations of best practices. Much like source code “linters,” flagged items are not necessarily errors. While this work discusses
Figure 1.6: Error checking rules provided by Microsoft Excel 2013. See Chapter 1.3.2.2.
only one smell tool at length—CUSTODES—other tools adopt similar approaches [24,
30, 53]. We also discuss data type-based approaches and some approaches that exploit user markup for context. Finally, we discuss the anomaly-based approach that forms the basis for this dissertation.
1.3.2.1 Microsoft Excel
Figure 1.6 shows the error detection rules that Microsoft Excel employs [92], each of which may be selectively enabled or disabled. Excel’s approach is based on recognizing common pre-defined patterns of errors and flagging specific cells that the patterns identify as potentially wrong.
The Excel user interface applies these rules and then uses an unobtrusive visual cue—a green triangle in the upper left corner of the cell—to highlight cells with
potential issues3. The user can then consult a pop-up message that provides more
details about the error along with a contextual menu that offers hardcoded fixes to the potential problem (e.g., to copy an adjacent formula into the cell). In addition, Excel provides a rudimentary formula dependence visualization, an “arrow” overlay pointing to (or from) a formula’s (non-transitive) dependencies.
3Oddly, the slightly more intrusive red triangle sometimes seen in the upper right corner of a cell
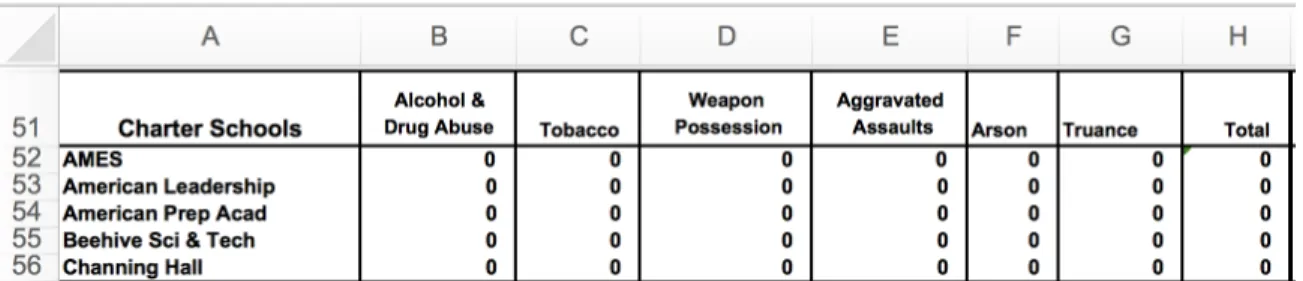
Figure 1.7: An Excel false positive. Excel flags the error in cell H52because it does not reference all available data in row 53 (see green triangle in upper left of cell).
While H52is incorrect for other reasons (it references the wrong row altogether), this
rule is a clear false positive.
These rules fall into several categories. Some rules check the contents of cells. For example, they check that the result of a computation is not itself an error (i.e., the expression cannot be evaluated), or that a value that appears to be a date is not represented as a 2-digit number. Other rules involve the relationship between cells. For example, formulas may omit cells in a contiguous region. The fixed set of rules that Excel employs is intended to cover real-world cases that are perceived by Excel’s developers to be both common and likely to be actual errors.
Figure 1.7 shows an example of Excel’s error reporting. In this example, Excel
flags cell H52as problematic with a green triangle. The reason, according to Excel’s
error detector, is because the formula “omits adjacent cells.” While the flagged cell is indeed problematic (as with the example in Figure 1.4, it sums the wrong row), Excel’s
fix is wrong: it suggests that the formula be updated to sum over B53:N53. Strangely,
the fix itself violates Excel’s rule that flags formulas that are inconsistent with other formulas in a region, since the “fixed” formula becomes the only such formula on the spreadsheet.
1.3.2.2 Spreadsheet “Smells”
CUSTODES4 [24] is a command-line tool written in Java that identifies
anti-patterns, commonly referred to as “code smells,” using a combination of rules and
cluster analysis. CUSTODES is available for free online and includes a data set
of ground truth spreadsheets containing annotations for spreadsheet smells.
CUS-TODES attempts to detect four types of spreadsheet smells:
• Missing Formula Smell. Cells that contain hard-coded constants when neigh-boring cells in rows and columns contain formulas are suspicious [24, 30]. • Dissimilar Reference Smell. Cells that reference different cells than their
neighbors are suspicious. The canonical example is an omitted cell from a range reference.
• Dissimilar Operation Smell. Cells that use different functions than their
neighbors are suspicious. The canonical example is using SUM instead of +.
• Hard-coded Constant Smell. This is a more granular version of the Missing
Formula Smell. A cell is marked as suspicious when its abstract syntax tree
(AST) contains a hard-coded constant where a neighboring cell uses a function call.
CUSTODES is command-line tool written in Java. CUSTODESfirst clusters
cells in a worksheet using features such as cell layout, formatting, and AST similarity.
The tool then categorizes each cell, conditioned on its cluster. Note thatCUSTODES
outputs no smell labels: it only prints the set of “smelly” cells. CUSTODES also
has no visualization. Users must consult the command-line output and compare it against their spreadsheet manually.
Pattern-based and smell checkers are inherently limited. By definition, they cannot uncover errors that do not fall into an existing pattern, even if a spreadsheet contains
unusual constructs. Cluster-based smell detectors like CUSTODES rely on rigid
structures and strong consistency within logical spreadsheet regions. Unfortunately, Excel’s rules can fail to detect many serious formula errors in real spreadsheets.
Fun-damentally, smell detectors like CUSTODES employ essentially the same approach
as Excel’s, but use some statistical approaches to “relax” the rules in order to improve recall.
Spreadsheet smells are largely orthogonal to spreadsheet anomaly detection: smells are not necessarily anomalous, and vice versa. Unlike smell detection approaches, our approach can detect arbitrary inconsistencies in spatial and structural reference
patterns. Further, unlike CUSTODES, our approach is based entirely on a unified
spatial and structural abstraction and does not rely on heuristics or domain knowledge.
1.3.2.3 Type and Unit Checking
Past work on detecting errors in spreadsheets has focused on inferring units and
relationships (has-a, is-a) from information like structural clues and column headers,
and then checking for inconsistencies [1, 3, 5, 18, 36, 37, 38, 60]. For example, XeLda
checks that formulas process values with incorrect units or if derived units clash with unit annotations. There also has been considerable work on testing tools for spreadsheets [17, 41, 56, 60, 85, 86].
These analyses can and do find real bugs in spreadsheets, but they are largely orthogonal to the our approach In fact, many of the bugs that we find in this work would be considered type- and unit-safe.
1.3.2.4 Other Approaches to Spreadsheet Correctness
Other approaches to spreadsheet correctness include creating stronger specifications for a computation (such as creating models, using templates [2,33], or using declarative
approaches to describing the computation, etc.). While these approaches may be effective, they require additional programmer expertise, extra effort, and depending on the technique, may not be applicable to existing spreadsheets. This dissertation aims to support data analysis tasks for non-programmers and as many existing spreadsheets as possible to create the greatest benefit for the spreadsheet user community.
Another promising approach is to create more informative visualizations of the computation being performed so that the user can find errors by inspecting the visualization (e.g. [58] is one example). This dissertation explores several visualizations
of reference behavior and of likely bugs. Many other visualizations are possible5.
1.3.2.5 Anomaly Analysis
An alternative to pattern based bug detectors are anomaly-based approaches. Anomaly analysis leverages the observation from conventional programming languages that anomalous code is often wrong [25, 29, 34, 49, 82, 93]. This lets an analysis circumvent the difficulty of obtaining program correctness rules. For spreadsheets, rules used by pattern detectors are either very general (e.g., expressions must evaluate) or imprecise (e.g., adjacent cells should have the same formula). Anomaly analysis circumvents this problem by instead reasoning about the relative frequency of features found in code.
The canonical example of anomaly analysis is whether an omitted statement to release a lock on a data structure is an error or not [34]. Knowing whether the programmer intended to omit such a call requires knowing what effect the programmer
wanted to obtain, information that is unavailable to any program analysis. Nonetheless,
if in 999 out of 1,000 instances, lockstatements are followed by an unlockstatement,
it is reasonable to conclude that the omitted unlock is likely to be an error.
Hard-5We explored many visualizations during the development of this dissertation, but only present
the best visualizations here. Some interesting but ultimately sub-par visualizations included error heatmaps, reference “spectra”, and reference “edge detection” plots.
coding such a relationship as a rule is likely to suffer from precision problems in general, as program control flow can sometimes obscure even rigidly-followed invariants. But
learning such a rule from a given codebase adjusts for a programmer’s idiosyncratic
code constructs.
Instead, anomaly analysis mines likely invariants using generic templates—a kind of statistical feature—that describe relationships between program constructs. By comparing the relative frequencies of violations of the extracted rule, likely errors can be flagged without needing to know programmer intent. For example, a feature
might be of the formstatement ais always followed by statement b. The analysis does
not need to know how to instantiate variables a and b a priori. The analysis then
applies the template across a code base, learning both a and b. For example a could
be “a lockstatement” and b might be “anunlock statement.” If such a relationship
is as common as its contradiction (“a lock statement is not always followed by an
unlock statement.”), then the relationship is unlikely to be meaningful. However, if the relationship is frequently maintained with few violations, those violations likely indicate a real error.
Anomaly analysis was developed primarily for conventional programming languages like C or Java, not spreadsheets. This dissertation extends the anomaly-based approach to spreadsheets, in particular, by observing spatial relationships between formulas and their inputs in spreadsheet layouts.
CHAPTER 2
FLASHRELATE: EXTRACTING RELATIONAL DATA
FROM SEMI-STRUCTURED SPREADSHEETS USING
EXAMPLES
The previous chapter outlined challenges in three stages of data analysis. This chapter presents an automated approach designed to facilitate spreadsheet layout preparation for data analysts of all skill levels.
This chapter introduces automatic layout transformation using examples1, a
pro-gram synthesis-based technique that lets ordinary users transform structured relational
data from spreadsheets without programming. At its core is Flare, a novel
transfor-mation language that extends regular expressions with geometric constructs. Users transform data by supplying examples of output relational tuples, and the algorithm synthesizes a program guaranteed to satisfy those examples.
We built FlashRelate to evaluate our technique. This chapter makes the
following contributions: 1) the identification of a critical step in data analysis that
benefits from automation; 2) the Flare domain-specific language and runtime that
makes transformations possible; 3) theFlashRelatealgorithm that generates correct
Flareprograms in seconds from a small set of examples; 4) an intuitive point-and-click
interface for layout transformation that requires no programming expertise; and 5)
finally, demonstration thatFlashRelateis effective for a large number of real-world
scenarios, many of which are drawn from Excel user help forums.
2.1
Approach
The FlashRelate tool relies on two core technologies to make automatic
trans-formation of input spreadsheets possible. The first is a formal language called Flare
that defines all possible layout transformation operations. The second is a search
algorithm that finds a valid Flare program given a set of example tuples given
by the user. The combination of formal language and search, a technique called
counterexample-guided inductive synthesis (CEGIS), is known to be complete for the
class of finite programs2. Nonetheless, na¨ıve pairings of formal languages and search
algorithms are not likely to produce useful program synthesizers, as CEGIS’s combi-natorial nature means that search may run for an unacceptably long amount of time.
FlashRelatedefines asufficiently expressive formal language with a domain-specific
search technique and search pruning heuristics. These refinements mean that despite the inherent combinatorial nature of the approach, satisfactory programs can often be found quickly (typically under 2 seconds) and with few input examples (typically 4). As a result, is it possible to build an interactive user interface on top of these core technologies that is fast enough to be useful, providing novice users with a practical technology for data wrangling tasks.
2.2
The Flare Transformation Language
Flare is a domain specific language designed to support transformations. A Flare program takes a spreadsheet as input and returns a set of tuples (a relational
table) as output. The Flare language defines the set of transformations possible
using the FlashRelate system.
The design of Flareis inspired by scripting languages with regular expression
capabilities. While regular expressions are a powerful language-based mechanism for
2“A finite program is one whose input is bounded and which terminates on all inputs after a
<prog> ::= <cpair>|<cpair> "[" <pseq> "]" <cpair> ::= <spatialc> <cellc>
<pseq> ::= <cpair>|<cpair> "," <pseq> <cellc> ::= <regx> <anchor>|<capture>
<capture> ::= "<" <name> "," <regx> ">" <anchor> <anchor> ::= ":" <spatialc> <regx>|a
<regx> ::= "/" String "/" <name> ::= String
<spatialc> ::= <vert> <horiz> <vert> ::= <vdir> <quant> <horiz> ::= <hdir> <quant>
<vdir> ::= "u"|"d"|v
<hdir> ::= "l"|"r"|h
<quant> ::= "*"|"*?"|"*#" | "+"|"+?"|"+#" | "{"N"}"|q
Figure 2.1: Flaresyntax. Flareextends regular expressions with spatial constraints.
String represents any string literal. Nrepresents a positive integer literal. Flare is
< Harvest ,¬w>: u +/ v a l u e /
[ r < Date ,¬w> , l * < Country ,αw> ]
Figure 2.2: AFlare program that converts the table shown in Fig. 1.1 to the table
shown in Fig. 1.2. The subexpression “αw” is shorthand for the regular expression
that matches alphabetic characters and whitespace while “¬w” is shorthand for the
regular expression that matches any character except whitespace.
capturing and transforming string data, they are not powerful enough to capture relational information encoded in spreadsheets without additional support code. This is because spreadsheets are more than strings; they are strings embedded in a
two-dimensional matrix. Flare augments regular expressions with geometric constraints
needed to capture and transform spreadsheet data into relational tables without support code. The key insight is that geometric constraints like direction and distance concisely express the spatial relationships underpinning the desired table extraction.
In a nutshell, the execution of a Flare program constructively enumerates all
possible combinations of cells from the input spreadsheet that satisfy the set of con-straints described by the program. As with regular expressions, only those constructs
that satisfy the constraints are candidates for transformation. Flarehas two kinds of
constraints: 1) a cell constraint defines the set of valid strings belonging to acolumn
of the output table, and 2) a spatial constraint defines the set of permissible spatial
relationshipsbetween two columns of the output table. These two constraints
may be composed according to the syntax rules shown in Fig. 2.1.
2.2.1 Example
The Flare program written in Fig. 2.2 transforms the spreadsheet shown in
Fig. 1.1 into the “long” format spreadsheet shown in Fig. 1.2. In general, the right layout depends on the query, so unless a user can anticipate all possible future queries,
no perfectly-suited layout can be chosen a priori. With FlashRelate, this choice is
transfor-mations, FlashRelate automatically produces Flaretransformation programs like
the one shown in Fig. 2.2. FlashRelate frees the user to enter their data in any
layout that they find convenient.
2.2.2 Constraints
The following section discusses each constraint and its details informally. A formal
definition of Flare semantics may be found in Chapter A.
2.2.2.1 Cell Constraints
InFlare, cell constraints (<cellc>in Fig. 2.1) are essentially regular expressions3.
Regular expressions are enclosed by a pair of slashes, //. For example, the expression
/^[0-9]+$/ matches a string that contains only numbers. From here on, we refer to
this expression asNum.
Informally, a cell constraint is a boolean function that takes a spreadsheet and a
cell location as parameters and returns true if and only if the constraint is satisfied
by the cell at that location. Lines 6 and 7 in Fig. A.2 in the Appendix describe the meaning of cell constraints formally.
As with many regular expression implementations, a Flare cell constraint may
either merely constrain or constrain and capture data (<capture> in Fig. 2.1).
Cap-turing means that cell data is returned in an output tuple in addition to being used as a constraint. Capture is denoted by enclosing a cell constraint within a pair of
angle brackets, <>. A valid Flareprogram must contain at least one capturing cell
constraint. A captured cell must also be associated with a <name>; this name defines
anoutput column.
3
2.2.2.2 Spatial Constraints
Spatial constraints describe the relative spatial relationships between two output
columns (<spatialc>, Fig. 2.1) Spatial constraints are also the mechanism used
to compose two subprograms. An n-tuple subprogram composed with an m-tuple
subprogram yields ann+m-tuple subprogram.
The essential component of a spatial constraint is a geometric descriptor (<vdir>
and <hdir> in Fig. 2.1). There are four basic descriptors, up, down, left, and right,
denoted by "u","d", "l", and "r" respectively. A spatial constraint may contain up
to two geometric descriptors, one for the vertical direction, and one for the horizontal direction. One may informally think of a spatial constraint as a boolean function that
takes two cell locations as parameters and returnstrue if and only if those two cells
satisfy the specified geometry in the spreadsheet. Line 11 in Fig. A.2 in the Appendix describes the meaning of spatial constraints formally.
Spatial constraints are directed, declaring that a functional spatial relationship
exists between a parent cell and child cell. For example, a child cell is “to the
left” of the parent cell. Strictly speaking, the child-of operator declares a spatial
relationship between the cells yielded by twoFlaresubprograms (2nd rule for<prog>,
Fig. 2.1). The operator is denoted by a pair of square brackets []; the cells matching
the constraints listed inside the brackets are children of the cells matched by the
constraint outside and to the left of the brackets. When separated by commas, multiple child subprograms are allowed inside brackets. Each child subprogram therefore defines a spatial constraint with the same parent.
2.2.2.3 Geometric Descriptors
Geometric descriptors may be appended with a constant quantity (<quant>,
Fig. 2.1), for example, r{5}, indicating that the child cell should be 5 cells to the
spatial relationship of indeterminate distance from its parent (e.g., “somewhere to the right”), and Kleene stars can be used for this purpose. As with many regular expression implementations, the Kleene star can be interpreted in several different
ways. The language supports match-all, greedy, and non-greedy semantics using *,
*#, and*? respectively.
2.3
Algorithm
Layout transformation synthesis automatically generates a Flare program as
output given a spreadsheet and a set of positive and negative examples of tuples as
input. The synthesized Flare program is guaranteed to extract all of the positive
tuple examples and none of the negative tuple examples supplied by the user. We frame
the problem of finding a satisfactory program as a search over all valid combinations
of constraints that satisfy the positive and negative examples. Algorithm pseudocode is shown in Figs. A.3, A.4, A.5, and A.6 in the Appendix.
Let P be the set of user-provided tuples representative of the desired relational
table, otherwise known as positive examples. LetN be the set of user-provided tuples
representing counterexamples, otherwise known asnegative examples. The space of
all possible transformation programs over the columns in P and N is a graph called
the column graph. Let each column in the output table be a vertex in this graph. Let
constraints be directed edges between vertices; each edge encodes a (spatial constraint, cell constraint) pair. Since spatial constraints relate columns, edges are directed. Cell constraints define valid strings in the target column.
In order to correctly perform a transformation, a valid Flareprogram must 1)
refer to every column in the output table, and 2) define functional spatial dependence for every column, except the first column, which is the “root”. This resulting structure is a spanning tree over the column graph.
The spanning tree search must also satisfy the examples in P and N. The fact that Flare programs have a tree structure means that a blind, combinatorial search can be avoided. Instead, the program search procedure, shown in Fig. A.4, is an adaptation of Kruskal’s minimum-weight spanning tree algorithm [61].
By construction, all programs in the search space satisfy the positive examples, but not the negative examples. To quickly find a program that satisfies both, heuristics
assign weights to edges such that the user’sintended program islikely to be a
minimum-weight spanning tree. When this intuition is correct, greedy search pays off. When it is not, the search must backtrack. Heuristics are described in Chapter 2.4.
There may be many spanning trees that satisfy the examples given by the user.
While all of these programs are correct with respect to the user’s examples, not all of
them are what the user wants. Inferring user intent from incomplete specifications
is a difficult problem. Our heuristics also attempt to guide the search toward con-straints most likely intended by users, reducing the number of examples needed (see Chapter 2.4).
2.3.1 Synthesis Goals
Informally, the synthesizer must perform the following tasks, given P and N: 1)
For column each i in the output table, learn the set of all cell constraints that satisfy
P (Fig. A.5). 2) For column pairi, j, learn the set of all spatial constraints that satisfy
the user’spositive examples (Fig. A.6). 3) Any combination of learned cell and spatial
constraints that form a spanning treeT over all columns satisfies the user’s positive
examples, but many of them include tuples in N. The last step is to exclude any T
2.4
FlashRelate Implementation
The efficient operation of the synthesis algorithm depends on three key
implemen-tation ideas. Ranking schemes prioritize the search for likely good constraints over
likely bad constraints. Pruning reduces the size of the search space, making search
more efficient. Compact data structures based on bitvectors ensure that search uses
little memory and logical operations are performed efficiently.
2.4.0.1 Ranking
At every step in the search, FlashRelate must choose between candidate
con-straints. Some constraints are more general while others are more specific. This choice impacts both the speed of the synthesizer and the number of examples required by the user. Favoring specific constraints may make the search fast, because they are more likely to rule out negative examples. Specific constraints may also mean that the user must provide more positive examples before the correct program is found. Conversely, favoring general constraints may fail to exclude negative examples, causing the search to backtrack frequently, slowing search. General constraints may require a user to provide more negative examples.
FlashRelate has a strong bias toward specificity. This enables users to focus on
what they want, instead of what they don’t want, which is a more natural form of interaction. This choice also allows for faster search. Constraints are ranked by the
following heuristics, in this order: 1) H1Excluding more negative examples is favored
over excluding few. 2) H2 Specific spatial constraints are favored over general ones.
This implies that multiple positive examples are required to learn non-constant-length
spatial constraints. 3) H3Simpler geometric layouts (i.e, fewer “turns”) are favored
over complex ones. 4) H4Cells above and to the left of positive examples are implicit
moving rightward and downward. Implicit negative examples are abandoned whenever they contradict positive examples.
2.4.0.2 Pruning
The naive approach of enumerating all possible geometric descriptors fails when one considers that there are an infinite number of possible constant-length descriptors. Instead, the enumeration phase of the search returns the smallest possible set of descriptors consistent with all the positive examples. Many descriptors can be ruled out based observations of user examples. For example, if in two positive examples, two cells belonging to the same column share a single candidate parent cell, constant-amount geometric descriptors are not possible and can be pruned.
2.4.0.3 Data Structures
When interpreted over a spreadsheet a cell constraint evaluates to a set of cells. This set of matching cells is represented as a bit vector, mapping a linear traversal of the spreadsheet to “1” (match) or “0” (no match) to bitvector indices. This representation is efficient for three reasons: 1) Match results are stored efficiently, and can also be cached efficiently, since many programs share subprograms that do not need to be re-evaluated. 2) Satisfiability can be answered using bit vector arithmetic. 3) Operations
requiring bit-counting, which is used heavily in our heuristics, isO(# bits set) [90].
2.5
Evaluation
This section evaluates the design of Flare and FlashRelate on a variety of
real-world spreadsheets. We answer the following questions: 1) It is possible to
manually write Flare programs to perform a diverse set of extraction tasks? 2) Can
FlashRelateautomatically infer equivalent programs to the hand-written programs?
3) How effective are heuristics at reducing the time and number of examples required by the synthesizer?
![Figure 1.4: An example spreadsheet containing several errors. This spreadsheet was drawn from the FUSE corpus [9], shown here using Excel’s “formula view”](https://thumb-us.123doks.com/thumbv2/123dok_us/9956144.2488173/34.918.160.815.106.247/figure-example-spreadsheet-containing-errors-spreadsheet-corpus-formula.webp)