The Role of Intangible Human Factors in Business Success in South Asian Ethnic Minority Small Businesses
Muhibul HAQ
Submitted for the Degree of Doctor of Philosophy
Faculty of Management and Law University of Bradford
i
Abstract
Muhibul Haq
The Role of Intangible Human Factors in Business Success in South Asian Ethnic Minority Small Businesses
Keywords: Intangible Human Factors, South Asian ethnic minority small
businesses, Ethnic minority entrepreneurship, Small businesses in West Yorkshire, South Asian ethnic culture, the culture-induced entrepreneurship model.
Extant scholarship has paid considerable attention to exploring the impact of people-dependent intangible resources on business success but in large organisations only. Research about the role of these resources in small businesses, in general, and in ethnic minority small businesses, in particular, is scarce. The current study attempts to narrow this gap. Since it is impossible to study all the ethnic minority small businesses, this study uses a case study strategy that focuses on South Asian ethnic minority small businesses that deal in fashion. The study adopts a qualitative research methodology, it uses the semi-structured in-depth interview method to collect data, and it espouses an inductive thematic technique for coding/analysis of the data. Five overarching themes emerged from the interview data. These are: business success; compassionate customer service; relationships; knowledge, experience, training and education; and ethnic culture and the wider economic and political environment.
Discussion of these themes leads to the formation of the culture-induced entrepreneurship model. According to this model, the continued success of these businesses is driven by the ethnic culture, while the existence of these businesses helps to maintain the culture in return. However, overdependence on the coethnic base might risk the future success of these businesses. This thesis concludes by highlighting its theoretical contributions to the culturalist view and the mixed embeddedness model of ethnic minority entrepreneurship and small business literature. The implications of this study for researchers, practitioners, and policy-makers, as well as its limitations and the possible future research paths, are also discussed.
ii
Acknowledgement
All the praises are to Allah, the Lord of the worlds Who is my Creator, Sustainer, and Cherisher. He created me one of the many human beings about whom He says ‘Verily We have honoured the children of Adam. We carry them on the land and the sea, and have made provision of good things for them, and have preferred them above many of those whom We created with a marked preferment’ (Al-Quran 17:70).
If I have to describe my supervisor Professor Nancy Harding in one word, I will utter without hesitation ‘amazing.’ She is amazing because the way she trains people. Her advice is always timely and to the point. She has a unique style of telling someone off in a constructive, professional and non-offending manner. She criticised my work at times in a way that forced me to take a step back and think all over again. She knew I needed that and I understood her criticism and took that on board wholeheartedly. That made my work more fine-tuned. Certainly, I am not the first and surely will not be the last having such a good experience with her and a perception of her style of providing research training. Many thanks, Professor Harding, May God bless you. I am also grateful to my second supervisor Dr. Janine Williams. Her valuable advice helped me to refine this thesis.
The role that was played by Professor Nelarine Cornelius (my previous supervisor) in the early stages of this study has been equally amazing. Without her intellectual support, I could have lost my way during the literature review. In addition, I thank Dr. James Wallace (my second ex-supervisor). He helped me to embark on this journey. Finally, I would like to thank Professor Jackie Ford, Professor Carole Howorth and Dr. Robert Perrett (all from School of Management, University of Bradford) for the informal and invaluable support they extended when I needed it.
iii
Dedication
I dedicate this work to my mother Salami Bibi (late) and my father Mohammed Ismail Khan; my wife Nazia Kanwal Haq; my brothers Lajbar Khan, Abdul Hafiz and Usman Ghani; and my sisters Laheeda, Zuma, Waheeda and Zuli. These people have played a direct role in my life in different ways and helped me to earn not just this Ph. D., but to be where I am today. Others who deserve to be mentioned and who helped me indirectly or motivated me to achieve a doctorate in social sciences, include my sons Mazharul Haq, Mahbabul Haq and Mamon Haq, my daughter Laurabe Haq, my daughter-in-law Arzoo Mazharul Haq, and my grandsons Mohammad Taahaul Haq, Muhammad Ibrahim Haq, and Haroon Yahya Haq.
In addition, a little part of this work is dedicated to our family cat, Shunu Zidan. He, for the last four years (since we rescued him from a busy street, which he brought to a standstill because of his hunger and distress when he was a tiny baby), has been seeing us off every morning by standing on the stairs and staring at us while slowly blinking his eyes, then waiting for us by the front entrance door every evening. His waiting in the evenings might be informed by his desire to be petted and/or his need for food, but he makes us believe that he loves us, therefore, waits for us to come home and give him company. This may not be the only interpretation of his behaviour.
iv
Abstract ... i
Acknowledgement ... ii
Dedication ... iii
Abbreviations and Acronyms ... xi
Chapter 1: Introduction ... 1
1.1 Research aim and research question ... 1
1.2 Research motivation/justification ... 2
1.2.1 Gap in the literature ... 2
1.2.2 Demographics and market conditions ... 5
1.3 Intangible Human Factors ... 6
1.4 Organisation of the thesis ... 9
Chapter 2: South Asians in the UK ... 12
2.1 South Asian ethnic minority population in the UK ... 12
2.2 South Asian entrepreneurship in the UK ... 14
2.3 Historical decline of South Asian entrepreneurship ... 15
2.4 Recent trends of South Asian entrepreneurship ... 16
2.5 A shift from self-employment to paid-employment ... 20
2.6 Chapter summary ... 21
Chapter 3: Literature review ... 23
3.1 A general overview of entrepreneurship ... 23
3.2 Relevant theoretical models/concepts ... 25
3.2.1 The enclave theory ... 25
3.2.2 The middlemen theory ... 27
3.2.3 The interactive model ... 28
3.2.4 The mixed embeddedness model ... 29
3.2.5 The market disadvantage theory ... 31
3.2.6 The culturalist view ... 31
3.2.7 The human capital theory ... 32
3.2.8 The resource-based view of the firm ... 33
3.2.9 Theoretical framework ... 35
3.3 Resources ... 36
v
3.2.1.1 Human capital ... 38
3.2.1.2 Cultural capital ... 40
3.2.1.3 Social capital ... 43
3.2.2 Ethnic resources ... 46
3.2.2.1 Collective life and collective action ... 48
3.2.2.2 Bounded solidarity ... 48
3.2.2.3 Inter-group unionisation... 50
3.2.3 Differences between class and ethnic resources ... 51
3.2.4 Knowledge and knowledge sharing ... 52
3.2.5 Relational capital ... 55
3.2.5.1 Family and gender relationships ... 56
3.2.5.1.1 Family social capital ... 57
3.2.5.1.2 Role of gender ... 59
3.2.5.2 Employee relationships ... 60
3.3 Chapter summary ... 62
Chapter 4: Methodology ... 64
4.1 Research strategy - case study ... 64
4.2 Qualitative research ... 66
4.3 Data collection ... 68
4.3.1 Purposive sampling ... 68
4.3.2 Snow-balling ... 69
4.3.3 Pilot interviews and the interview guide ... 69
4.3.4 The participants ... 70
4.3.5 The semi-structured interviews ... 71
4.3.6 Transcription ... 73
4.4 Data coding and analysis ... 74
4.4.1 Data organisation ... 74
4.4.2 Data analysis ... 75
4.4.3 The first phase of coding ... 78
4.4.4 The second phase of coding ... 81
4.4.5 The third phase of coding ... 83
4.5 Ethical issues ... 84
4.6 Problems encountered ... 86
4.7 Validity and reliability ... 87
vi
Chapter 5: Business success ... 90
5.1 The concept of business success ... 90
5.2 The meaning of success in the context of the current study ... 91
5.2.1 Making a profit as success ... 92
5.2.2 Growth as success ... 93
5.2.3 Survival as success ... 96
5.3 Chapter summary ... 96
Chapter 6: Compassionate customer service ... 98
6.1 Adopting a customer-conscious approach ... 98
6.2 Being empathetic with customers ... 106
6.3 Being patient with customers ... 108
6.4 Let the customers make the buying decision ... 111
6.5 Dealing with difficult customers/situations amicably ... 113
6.6 Chapter summary ... 116
Chapter 7: Relationships ... 123
7.1 Relationships with customers ... 124
7.2 Relationships with suppliers ... 131
7.3 Relationships with the wider community ... 136
7.4 Relationships with employees ... 140
7.5 Gender relationships/differences ... 146
7.6 Chapter summary ... 149
Chapter 8: Knowledge, Experience, Training, and Education ... 154
8.1 Knowledge ... 154
8.1.1 Knowledge as an IHF ... 154
8.1.1.1 Knowledge about products ... 155
8.1.1.2 Knowledge about customers ... 159
8.1.2 Knowledge sharing ... 162
8.1.2.1 Education and knowledge sharing ... 164
8.1.2.2 Interpersonal relationships and knowledge sharing ... 166
8.1.2.3 Ethnic culture and knowledge sharing ... 168
8.2 Experience ... 173
8.3 Training ... 178
vii
8.5 Chapter summary ... 189
Chapter 9: Ethnic Culture and the Wider Economic and Political
Environment ... 195
9.1 Ethnic culture ... 195
9.1.1 Role of South Asian ethnic culture ... 196
9.1.2 Role of religion ... 201
9.2 Competitive market environment ... 207
9.2.1 The impact of competition ... 207
9.2.2 The impact of the economic downturn ... 213
9.2.3 Coping with the competition and the economic downturn ... 218
9.3 Chapter summary ... 225
Chapter 10: Discussion ... 231
10.1 The culture-induced entrepreneurship model ... 232
10.1.1 Business success ... 235
10.1.2 Facilitating factors - ethnic resources ... 236
10.1.2.1 Compassionate customer service ... 236
10.1.2.2 Interpersonal relationships ... 240
10.1.2.3 Knowledge and knowledge sharing ... 242
10.1.2.4 Previous relevant experience ... 244
10.1.2.5 Training ... 246
10.1.2.6 Education ... 247
10.1.3 Structural factors ... 249
10.1.3.1 Ethnic culture ... 249
10.1.3.2 Religion ... 253
10.1.3.3 The caste system ... 253
10.1.3.4 Competitive environment and the economic downturn ... 255
10.1.4 The simplified model ... 260
10.1.5 Inter-construct similarities and relationships ... 261
10.2 Ethnicity, culture, and entrepreneurship ... 263
10.3 The uniqueness of the culture-induced entrepreneurship model 266 10.3.1 The culturalist view ... 267
10.3.2 The mixed embeddedness model ... 268
10.3.3 The enclave theory ... 269
10.3.4 The middlemen theory ... 269
viii
10.3.6 The market disadvantage theory ... 271
10.3.7 The human capital theory ... 271
10.3.8 The resource-based view of the firm ... 272
10.4 The risks of maintaining a narrow focus ... 273
10.5 Theoretical positioning of the thesis ... 278
10.6 Chapter summary ... 279
Chapter 11: Thesis Conclusion ... 282
11.1 Contributions and extensions to the existing literature ... 282
11.1.1 Contribution and extension to the culturalist view ... 283
11.1.2 Contribution and extension to the mixed embeddedness model ... 284
11.2 Contributions to methodology ... 285
11.3 Implications of the current study ... 286
11.3.1 Implications for researchers ... 286
11.3.2 Implications for practitioners ... 287
11.3.3 Implications for policy-makers ... 288
11.4 Limitations ... 289
11.5 Possible future research paths ... 291
11.6 Concluding remarks ... 293
References ... 294
Appendices ... 320
Appendix 1: Defining key concepts ... 320
Competitive advantage ... 320 Innovation ... 320 Resources ... 321 Human capital ... 321 Social capital ... 321 Relational capital ... 322 Cultural capital ... 322 Culture ... 322 Cultural manifestations ... 323 Cultural values ... 323 Norms ... 323
ix Society... 323 Knowledge ... 324 Entrepreneurship ... 324 Ethnic entrepreneurs ... 325 Immigrant entrepreneurship ... 325
Ethnic minority businesses ... 325
Founder, business owner, and employee-manager ... 325
Ethnicity ... 326
Ethnic people ... 326
South Asian ethnic minority ... 326
Class resources ... 327
Ethnic resources ... 327
Rotating credit association ... 328
Mixed embeddedness ... 328
Globalization ... 328
Appendix 2: Participant information sheet ... 329
Appendix 3: Covering letter ... 331
Appendix 4: Participant consent form ... 333
Appendix 5: Sample demographic data collection form ... 334
Appendix 6: Sample qualitative semi-structured interview guide ... 337
Appendix 7: A sample screenshot of data organisation leading to initial/open coding ... 342
Appendix 8: An exemplary screenshot of an analytic memo ... 343
Appendix 9: An example of a process memo during the third phase of coding leading to themes identification ... 344
Appendix 10: An exemplary screenshot of themes identification process during the third phase of coding ... 347
x List of Tables
Table 1: Ethnic minority population forecast in the UK ... 14
Table 2: Ethnic Minority SMEs in the UK and ethnicity of their directors/partners (in numbers, 2001 Census Data) ... 17
Table 3: Ethnic Minority SMEs in the UK and ethnicity of their directors/partners (in percentage, 2001 Census Data) ... 17
Table 4: Self-employed individuals of ethnic groups of age 16 and over in West Yorkshire (2001 Census Data) ... 18
Table 5: Self-employed individuals of ethnic groups of age 16 and over in England and Wales (2001 Census Data) ... 19
Table 6: Self-employment Indians and native white community in the UK ... 20
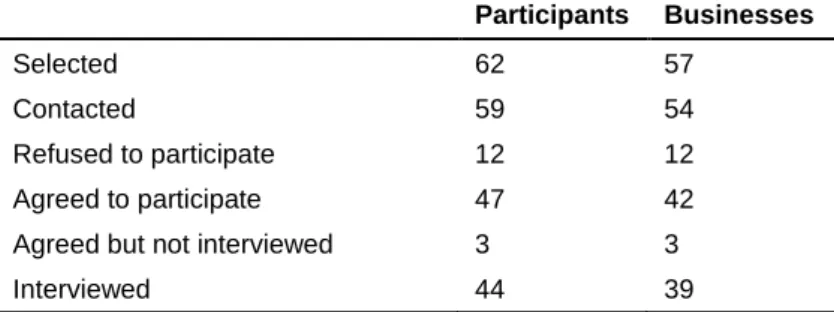
Table 7: Breakdown of participating individuals and businesses ... 71
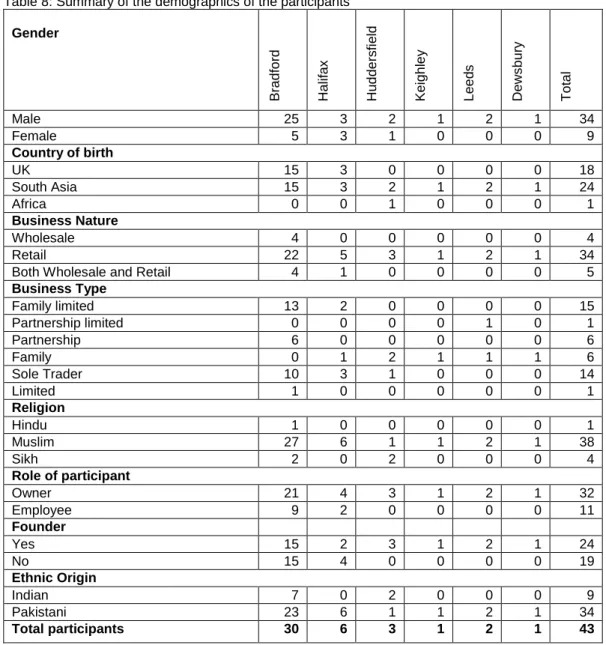
Table 8: Summary of the demographics of the participants ... 72
Table 9: The six step process in thematic analysis/coding ... 76
Table 10: Main topics identified before data collection ... 79
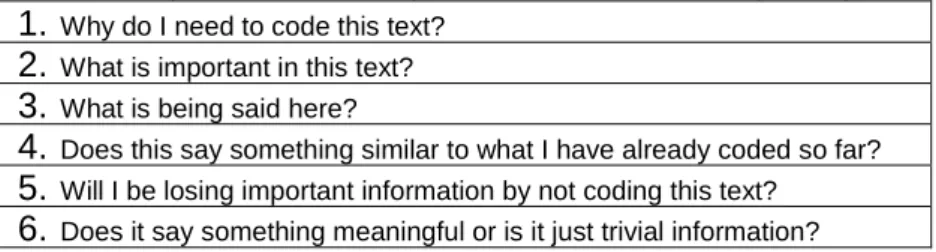
Table 11: Six questions consistently asked about the data during coding ... 80
Table 12: Description of the themes ... 84
Table 13: Three evaluative questions asked during the third phase of coding - 13/03/2015 ... 345
Table 14: Prioritization of the categories identified during the third phase of coding - 13/03/2015 ... 346
Table 15: Data reduction during the third phase of coding (categories excluded) - 16/03/2015 ... 346
Table 16: Data reduction during the third phase of coding(categories included)- 17/03/2015 ... 347
List of Figures Figure 1: The case study geography area ... 1
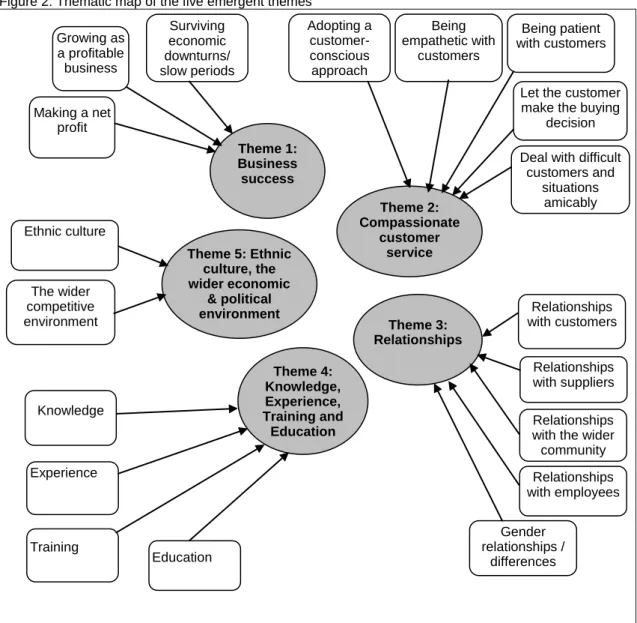
Figure 2: Thematic map of the five emergent themes ... 83
Figure 3: Visual representation of the culture-induced entrepreneurship model (CIEM) ... 233
Figure 4: Visual comparison of SAEM fashion shops in the UK and in Mirpur 251 Figure 5: Modified/simplified version of the culture-induced Entrepreneurship model (CIEM) ... 260
Figure 6: Visual representation of inter-construct relationships ... 262
xi
Abbreviations and Acronyms
BBC - British Broadcasting Corporation
BIS - Department for Business Innovation and Skills
CA - Competitive Advantage
CEO/CEOs - Chief Executive Officer/Officers
CIEM - Culture-induced Entrepreneurship Model
EU - European Union
FSB - Federation of Small Businesses
HC - Human Capital
HCR - Human Capital Resources HCT - Human Capital Theory IHFs - Intangible Human Factors ONS - Office for National Statistics RVB - Resource-based View of the firm SAEM - South Asian Ethnic Minority/Minorities
SCA - Sustained/Sustainable Competitive Advantage SHCR - Strategic Human Capital Resources
SME/SMEs - Small and Medium Enterprise/Enterprises
UK - United Kingdom
1
Chapter 1: Introduction
1.1 Research aim and research question
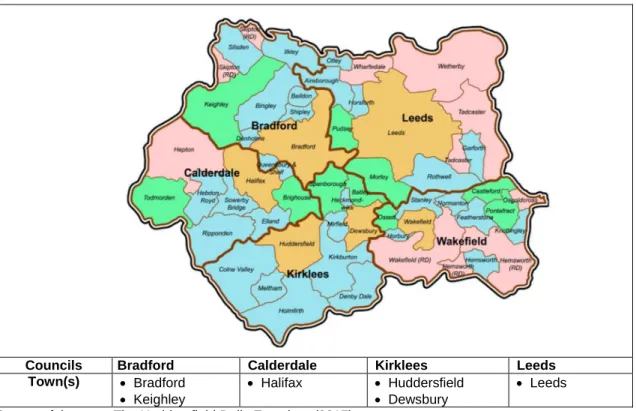
This study aims to explore how people-dependent intangible resources, referred to as Intangible Human Factors (IHFs1) in this study, are perceived to contribute (or not) to business success in ethnic minority small businesses. It is impossible to include all ethnic minority small businesses in one study. Hence, the current research adopts a case study approach - the South Asian ethnic minority small businesses that are dealing in fashion-related items such as textiles, garments, footwear, and related accessories. The case study geographic area consists of six towns from four councils within West Yorkshire (cf. Figure 1).
Figure 1: The case study geography area
Councils Bradford Calderdale Kirklees Leeds Town(s) Bradford
Keighley
Halifax Huddersfield
Dewsbury
Leeds
Source of the map: The Huddersfield Daily Examiner (2017)
The research question that this case study aims to address is:
How do intangible human factors contribute to business success in ethnic minority small businesses?
1
2
To define the concept of business success, scholars use different terms such as sustained success, long-term success, competitive advantage, sustained competitive advantage, and firm performance (Simpson et al., 2004 ; Soriano and Castrogiovanni, 2012). Some of these notions are considered broader than others. For example, the term performance may refer to financial turnover, net profit, innovation, customer satisfaction, relative market share, survival, or expansion (Hansen and Wernerfelt, 1989 ; Santos and Brito, 2012 ; Saeidi et al., 2015). The concept of business success in this study is understood by participants as the situation in which a net profit is earned from business operations, or the business continues to exist as a potentially profitable business, even if it meets breakeven only at a given point in time due to situations such competition and an economic downturn. The concept of business success is discussed in detail in Chapter 5 in light of the data that were collected and analysed in this study. The motives for choosing the research topic and question are explained next.
1.2 Research motivation/justification
As a practitioner, I am interested to contribute to the field of ethnic minority small businesses through addressing the above research question. I want to explore how owners and managers in ethnic minority small businesses perceive the importance of IHFs in the success of their businesses. Specifically, my choice of the research topic is informed by: (1) a gap in the literature; and (2) the demographics and recent changes in the market conditions in the United Kingdom (UK). These are summarised below, but explained in more detail in Chapters 2 (contextual background) and 3 (literature review).
1.2.1 Gap in the literature
Scholars from strategy and strategic human resource management (e.g., Hatch and Dyer, 2004 ; Barney et al., 2011 ; Crook et al., 2011 ; Maritan and Peteraf, 2011 ; Machlup, 2014 ; Nyberg et al., 2014) argue that people-dependent intangible resources play an important role in achieving and sustaining business success and competitive advantage. Economists (e.g., Schultz, 1961 ; Becker, 1962 ; Blaug, 1976 ; Becker, 1996a ; Goldin, 2016) also make a similar
3
argument. However, these scholars have traditionally focused on mainstream large organisational settings. There seems to be a general lack of research in small businesses, in general, and ethnic minority small businesses, in particular. For instance, Goldenberg and Kline (1999, p. 365) believed ‘there is a paucity of existing theoretical frameworks and data’ regarding the ‘perceptions of success and survival of small businesses.’ It still seems to be the case nearly two decades later with few exceptions (e.g., Van Praag, 2003 ; Simpson et al., 2004 ; Reijonen and Komppula, 2007). Even these exceptions rarely deal with the notion of ethnic minority small business success.
Van Praag (2003) investigated business success and survival amongst young White male small business owners in the United States. He focused on person-oriented determinants of self-employment, but did not explore what role, if any, IHFs play in the success of self-employment - a proxy for entrepreneurship or small business ownership (Wang and Altinay, 2012). Simpson et al. (2004) explored the role of education, training, development, prior knowledge, and prior experience in (the mainstream) small service sector businesses in the United States. They felt that further research would develop ‘a formal theory of success in a small business context’ (Simpson et al., 2004, p. 490). While Reijonen and Komppula (2007) explored the effects of the perception of non-financial measures of business success on financial performance amongst small business owners in Finland, they did not explore how IHFs contribute to business success.
Light and Dana (2013, p. 604) summarised the general paucity of research in ethnic minority businesses, let alone the usefulness of IHFs, as: ‘We examined the 18 issues of Entrepreneurship Theory and Practice, published between 2008 and 2010. Of the 144 articles in these 18 issues, only two dealt with ethnic or racial minorities.’ Millan et al. (2014) found that the level of education of an entrepreneur in the European Union affects the individuals’ success, but they did not explore how informally gained forms of people-dependent intangible resources (such as experience and training) affect entrepreneurial and firm performance.
4
While a limited number of studies attempted to explore the impact of IHFs on business success, they all focused on mainstream small businesses. Little, if anything, is known about IHFs in ethnic minority small businesses. However, another group of scholars attempted to conceptually highlight the role of intangible resources in ethnic minority small businesses, but their focus remained limited to what is known as class and ethnic resources (defined in Appendix 1, also defined and explained in Chapter 3) (Light and Gold, 2000). Some scholars (e.g., McKelvie and Davidsson, 2009) even ignored all micro firms, let alone ethnic minority small firms, believing that such firms would not generate any useful data. Yet, others scholars (e.g., Jones and Ram, 2013 ; Barrett et al., 2002 ; Kloosterman et al., 1999 ; Basu, 1998) have substantially contributed to the field of ethnic minority small business, but their focus remained on how these businesses perform in general.
The study, seemingly closest to the current research, by Chand and Ghorbani (2011) found that ethnic culture has a profound positive effect on the way Indian and Chinese ethnic minority entrepreneurs run their businesses in the US. But they examined the effects of cultural social capital only and omitted other forms of IHFs such as knowledge, experience, training, and education.
It is perhaps a consequence of this apparent gap that Thompson et al. (2010) asked for more specific sectoral-based research to bring out nuances and understand attitudes of specific ethnic minority groups towards entrepreneurship and small business. They were followed by Clark et al. (2015, p. 23), who also asked for ‘More detailed sectoral analysis… to shed further light on the extent to which’ self-employment amongst ethnic minority groups in the UK ‘can be achieved.’
This case study takes a step towards addressing the aforementioned gap by exploring how South Asian fashion small businesses perceive the role of IHFs in business success. In doing so, it responds to the limitations identified by other scholars (e.g., Thompson et al., 2010 ; Clark et al., 2015). Besides the gap itself, some demographic factors and market changes appear to make addressing it more urgent now than perhaps ever before.
5
1.2.2 Demographics and market conditions
Statistics indicate that South Asian ethnic minority leads all other ethnic minorities both in population and entrepreneurial or self-employment or small business representation in the UK. For example, drawing on statistics from Office for National Statistics, Haq (2015, p. 498) argued that the population of people with Bangladeshi, Indian, and Pakistani descent in the UK ‘will increase from 2.569 million in 2006 to 6.059 million in 2031 and 10.001 million in 2056, which is equivalent to 4.24%, 8.54% and 12.81% respectively of the total UK population’, whereas ‘British and Irish populations will shrink from 87.1% to 67.1% and 2.5% to 2.1% respectively from 2001 to 2051.’ Moreover, he presented that out of 4.7952 million private sector businesses in the UK in the year 2010, 8% belonged to ethnic minorities ‘out of which 46% belonged to Indians whereas 18% and 9% were owned by Pakistanis and Bangladeshis respectively’ (Haq, 2015, p. 499; BIS, 2010).
In addition, having worked for over a decade in this sector, I noticed that there is a feeling of uneasiness amongst owners and managers of South Asian ethnic minority small businesses in and around Bradford, due to saturated competition. The 2008 credit crunch, followed by the recession or economic downturn (hereafter the economic downturn2), perhaps made the competition rifer causing decreased sales for these businesses.
These statistics and the developments in the market conditions imply that we need (as researchers) to understand more about how this ethnic minority community (though it may be required in other communities too) approaches self-employment, entrepreneurship, and small business success for at least two reasons. First, this group has the potential of having an unprecedented impact on our economy in the future in the form of entrepreneurs, consumers, and a labour force. Second, understanding these small businesses might help us (policy-makers and practitioners) to understand small business dynamics. This
2 I coincidently happen to interview these participants in the aftermath of the economic downturn that was
triggered by the 2008 banking crises, and its effects were still being felt in 2014/15, the time when I was interviewing the participants.
6
is because, according to Chand and Ghorbani (2011, p. 594), ‘the creation of small to medium sized ventures often rises during periods of economic slowdown.’ Van Praag (2003, p. 1) believe that governments generally stimulate self-employment to decrease unemployment, but of every 100 new businesses, only 50% survive the first three years.
In sum, the aforementioned gap, together with the demographic dynamics of South Asians in the UK and the recent economic downturn, which apparently led to the widespread competition, provided an interesting and, potentially, important research opportunity. The research gap is problematised in the form of this research question: ‘how do intangible human factors contribute to business success in ethnic minority small businesses?’ Through exploring this research question, this study also unravels how these owners/managers understand the importance of people-dependent intangible resources for the success of their businesses. However, the conceptualisation of people-dependent intangible resources in the existing literature is very complex and confusing. To simplify this concept and to develop a broader understanding of it, at least in this study, I use an alternative term - Intangible Human Factors (IHFs).
1.3 Intangible Human Factors
Scholars from different academic fields either used different labels to point to the same type of intangible resources, or the same labels to refer to different types of intangible resources. For example, people-dependent intangible resources are known as class and ethnic resources in ethnic minority entrepreneurship literature (Boissevain et al., 1990 ; Light and Gold, 2000 ; Wang and Altinay, 2012). Strategic entrepreneurship literature broadly calls them human capital (Barney, 1991 ; Wright and McMahan, 2011 ; Hatch and Dyer, 2004), followed by human capital resources and strategic human capital resources (Wright et al., 2014 ; Ployhart et al., 2014 ; Nyberg et al., 2014). The interest from many disciplines, such as strategic management (Hatch and Dyer, 2004 ; Barney et al., 2011 ; Crook et al., 2011 ; Maritan and Peteraf, 2011 ; Machlup, 2014 ; Nyberg et al., 2014), economics (Schultz, 1961 ; Becker, 1962
7
; Blaug, 1976 ; Becker, 1996a ; Goldin, 2016) and human resource management (Ulrich, 2013 ; Wright and McMahan, 2011 ; Zidan, 2001 ; Guest, 1997 ; Wright et al., 1994), in exploring/investigating the role of intangible resources has resulted in the production of a wide repertoire of vocabulary and jargon, which are often overlapping in conception and or confusing in meaning. See Haq (2016, pp. 264-5) - a copy is attached at the end of this thesis (print version) - for a review of how different scholars have used the notion of the impact of intangible resources on firm performance, and their meanings in different disciplines.
Specifically, on a conceptual level, many scholars, including Wernerfelt (1984), Barney (1991), Wright et al. (1994) and Nyberg et al. (2014), strove to make a compelling case that some intangible resources have superior value for organisations than others because of their valuable, unique, inimitable and non-substitutable characteristics. But their focus remained on specific forms of intangible resources, which they generically called human capital and typically included firm-specific experience, training, education, how, and know-what3. Others consider that human capital represents educational levels, which in return is a manifestation of industry-specific knowledge and general business knowledge (Soriano and Castrogiovanni, 2012). Yet others, such as Light and Gold (2000), go as far as considering financial capital as part of human capital, in contrast to Barney (1991) who seems to consider financial capital a part of physical capital. Also, Barney (1991) considers relationships a part of human capital and relations a part of organisational capital, not explaining whether the two are the same concept or different concepts. Therefore, there seems to exist a confusion as to what the term ‘human capital’ should or should not include and whether or not other constructs such as knowledge, social capital, and relational capital should be considered as parts of human capital.
In an attempt to provide a more concise theoretical underpinning, Ployhart and Moliterno (2011) labeled these terms collectively as Knowledge, Skills, Abilities, and Other characteristics (KSAOs). But this term too can be challenged
3
The terms know-how and know-what refer to experience-based knowledge and task based knowledge respectively (Ipe, 2003; Liu et al., 2010; Haq, 2016).
8
because of the Os (Other characteristics), which is very vague as the authors do not precisely explain what the Os stand for. However, it can be assumed that, in theory, the Os can include anything from language skills to social capital and from general physical health to mental health and anything and everything in between. Moreover, in a recent article, Soriano and Castrogiovanni (2012, pp. 333-4) used a similar term ‘human capital factors’ in an attempt to ‘investigate the effects of entrepreneurial human capital on SME performance’ within the context of mainstream SMEs in the European Union. The term they used, is by no means a substitute for the term I use in this study. They did not define what the term ‘human capital factors’ stands for.
In addition, in an even more recent theoretical article Haq (2016) seemed to suggest another alternative term (KSAs - Knowledge, Skills and Abilities) and argued that the term ‘Abilities’ should be considered to encompass all kinds of abilities, and capabilities including physical and mental health abilities. The current study challenges that argument too and posits that it may be too simplistic because it fails in clearly spelling out which type of knowledge, skills and abilities one should refer to as a bundle of intangible (human) resources. As an alternative, I offer the term Intangible Human Factors (IHFs). The use of this term is an attempt to bring a number of related concepts together and refer to them with one encompassing label. In this spirit the notion of IHFs is conceptualized and defined as:
All people-depended (in other words personal to individuals) intangible (non-financial) resources that have the potential to create value (financial or otherwise) for the person who possesses them and for the organisation the person (or such persons) works for as an owner/employee.
Typically, these factors include education, experience, training, knowledge, relationships, and social capital including cultural and ethnic social capitals. Other intangible resources which were considered but not included in this study are organisational reputation and status of individuals including CEOs and top management teams (Ertug and Castellucci, 2015 ; Roberts and Dowling, 2002)
9
because they are not typically personal to people. They are as much related to one’s position in an organisation, if not more, as they are to one’s personal characteristics or traits.
By offering the above phrase and a comprehensive definition of it, I under no circumstance claim that this will help to avoid the use of multiple, yet conflicting, terms to refer to the same concept of intangible resources. Neither do I aim to close, nor narrow down, the debate what should, or should not, be included in the list of intangible resources. However, it is my belief that this term will give me and may be others too, the flexibility to choose a combination of the intangible resources according to specific contexts, while acknowledging certain exclusions in light of the above definition. This study deals with several key concepts, which are defined in Appendix 1. The organisation of the rest of this thesis is as follows.
1.4 Organisation of the thesis
Chapter 2 (contextual background) highlights: the role of SMEs in general; the role of ethnic minority SMEs in the UK with focus on South Asian ethnic minority SMEs in particular; the demographic landscape of South Asian Ethnic Minority (SAEM) population in the UK and in West Yorkshire; and the historical trends of SAEM entrepreneurship in the UK.
Chapter 3 (literature review) discusses the concept of people-dependent intangible resources, referred to as Intangible Human Factors in this study. It analyses the state of the existing knowledge base pertinent to the research question that this study aims to explore and the constructs that are related to IHFs.
Chapter 4 (methodology) begins with a discussion of what social researchers call ‘case study’ as a research strategy. I collected data from a purposefully selected sample of owners and managers from six towns within the case study area. A total of 33 business owners and 11 employee managers were
10
interviewed from 40 businesses (one interview was excluded). Inductive thematic analysis of the data resulted in five overarching themes:
(1) Business success
(2) Compassionate customer service (3) Relationships
(4) Knowledge, experience, training, and education (5) Social and economic factors
Chapters 5 to 9 present findings in the form of the five overarching themes, which emerged from the data analysis. Each chapter develops insights by using illustrative and exemplary quotes from the interview data. These insights are interwoven, and together they develop a coherent argument that leads to the development of the model that is built and presented in Chapter 10. Variations/contradictions in the data are also highlighted in these chapters.
Specifically, Chapter 5 deals with the concept of business success. Chapter 6 highlights the importance of compassionate customer services and how these participants feel they develop long-lasting relationships through providing good customer service in a face-to-face environment. Chapter 7 takes the concept of relationships further, and explores how the participants seem to develop social and instrumental relationships with a variety of external and internal stakeholders. Chapter 8 deals with another three types of IHFs namely, knowledge including knowledge sharing, experience, and training. This chapter also explores how participants expressed mixed views about the importance of academic qualifications for the success of their businesses. Finally, Chapter 9 sheds light on how societal and economic factors, both within this ethnic community and the outside wider society, influence the success of these businesses.
Chapter 10 (discussion) offers a critical analytic account of the findings presented in the preceding five chapters. It offers a conceptualisation of how ethnic minority small business owners and managers perceive business success through a model called ‘the culture-induced entrepreneurship model
11
(CIEM).’ According to this model, ethnic culture and cultural resources seemingly act as driving forces in the success of the sample businesses. Through comparing and contrasting this model with some of the widely used theoretical concepts in ethnic minority entrepreneurship, this chapter endeavours to make an original theoretical contribution to ethnic minority entrepreneurship and extends extant scholarship surrounding the culturalist view and the mixed embeddedness model. This thesis unravels the narrow approach that these businesses have adopted so far, which has the potential of inhibiting their future business success.
Chapter 11 (conclusion) recaps the theoretical contributions of this study and highlights the implications of this study for researchers, practitioners, and policy-makers. Limitations of this study are also discussed along with future research.
Appendices: this last section consists of some auxiliary information, including definitions of key concepts that are relevant to this case study and copies of various documents that were used during data collection. This section also includes examples of how the coding process was carried out. Two review articles, that were written and published in peer-reviewed journals during this study, are also mentioned in this section.
12
Chapter 2: South Asians in the UK
This chapter highlights South Asian ethnic minority population in the UK, followed by their entrepreneurial success and presumed decline. It concludes with a discussion on recent trends of entrepreneurship and self-employment in this ethnic group. The term South Asian ethnic minority refers to the people living in the UK with ethnic descent from Bangladesh, India, and Pakistan (cf. Appendix 1).
2.1 South Asian ethnic minority population in the UK
Political and cultural relationships began between the people of India and Britain after the establishment of the East India Company by the British Empire in the early seventeenth century in India, first as a trading enterprise but later as a military and administrative force (Knott, 2011). The relationship manifested itself in the form of movement of traders, administrators, and army personnel from Britain to India, and the movement of students, intellectuals, seafarers (Lascars), nannies (Ayahs), politicians, Nawabs, Rajas, and merchants from India to Britain (Knott, 2011 ; Husainy, 2011).
Immigration on a large scale from South Asia to Britain occurred after partition of the Indian subcontinent in 1947, which formed Bangladesh, India, and Pakistan (Husainy, 2011). The so-called ‘full employment’ and ‘pull incentives’ in the UK economy in the 1950s and 60s attracted a large number of immigrants from ex-British colonies including Bangladesh, India, and Pakistan (Hansen, 2003 ; Lupton et al., 2004). Most of these immigrant workers, especially from Bangladesh and Pakistan, went to smaller towns in Yorkshire and Lancashire to fill the demand for labourers in the 24-hour-operated mills (Lupton et al., 2004). Their families joined them later. This is how South Asians settled in Britain (Simpson et al., 2008).
The second influx of people with South Asian descent came from Kenya and Uganda during the late 1960s and early 70s, when authorities in these countries terminated settlement rights of immigrants, many of them having Indian subcontinent origin (Husainy, 2011). These people were brought to work in the
13
sugar mills in Africa by the British imperial colonials from the Indian subcontinent in the nineteenth century as indentured labourers to fill the labour shortage that was created due to the abolition of slavery in 1834 (Husainy, 2011 ; National Archives, 2013). Around 5,000 British passport-holder South Asians emigrated to the UK from Kenya in 1968, followed by 21,000 from Uganda in 1971 (Pearson, 2013). Since then the population of South Asians in the UK has grown steadily.
The ethnic minority population of South Asian descent increased from 0.23% of the total UK population in 1961 to 4% in 2001 (Ballard, 2004). Out of the 4%, 2.7% were of Indian origin whereas those of Pakistani and Bangladeshi descent were 1.5% and 0.5% respectively (Pearson, 2013). According to the UK Census 2001, the South Asian population in the UK grew from under 1.5 million in 1991 to over 2 million in 2001 (Ballard, 2004 ; Pearson, 2013). The increment is attributed to three factors: increased immigration mainly because of family reunion; increased birth rate; and decreased death rate (Ballard, 2004). The most rapid increase happened amongst the Bangladeshi community (74%), followed by the Pakistanis (57%), whereas the Indian ethnic minority population increased by 24% (Ballard, 2004). The UK Census 2011 reveals that people from Indian, Pakistani, and Bangladeshi origin increased from 2%, 1.4% and 0.5% in 2001 (BBC, 2011 ; Census, 2001) to 2.5%, 2.0%, and 0.8% respectively (ONS, 2012), a combined increase of 5.3%, higher than other ethnic groups.
The forecast suggests that Indian, Pakistani and Bangladeshi population in the UK will reach 3.172 million, 2.074 million and 0.813 million by 2031 and then 5.318 million, 3.386 million and 1.297 million respectively by 2056 (Coleman, 2010). These figures would represent 4.47%, 2.92%, and 1.15% of the total UK population by 2031, and 6.81%, 4.34%, and 1.66% by the year 2056 respectively (cf. Table 1) (Coleman, 2010). The forecast also suggests that the overall White British population will decrease from 86.87% of the total UK population in 2006 to 71.56% by 2031 and then to 56.03% by 2056 (cf. Table 1).
14
Table 1: Ethnic minority population forecast in the UK
Ethnic
Groups Population in 2006 Population in 2031 Population in 2056
Numbers % Numbers % Numbers %
Indian 1,295,000 2.14 3,172,000 4.47 5,318,000 6.81 Pakistanis 924,000 1.53 2,074,000 2.92 3,386,000 4.34 Bangladeshis 350,000 0.58 813,000 1.15 1,297,000 1.66 Black Caribbean 596,000 0.98 737,000 1.04 812,000 1.04 Black African 707,000 1.17 2,093,000 2.95 3,769,000 4.83 Chinese 414,000 0.68 1,177,000 1.66 2,025,000 2.59 White British 52,629,000 86.87 50,763,000 71.56 43,726,000 56.03 Others 3,672,000 6.05 10,107,000 14.25 17,714,000 22.70 Total UK 60,587,000 100.00 70,936,000 100.00 78,047,000 100.00
Copied from: Haq (2015, p. 498)
The predictions made by Coleman (2010) are supported by the findings of a study of 352 local authorities in England - the non-White ethnic minorities will be 20% of the total UK population by 2051, an increase from 8% in 2001; and White British and Irish populations will shrink from 87.1% to 67.1% and 2.5% to 2.1% respectively between 2001 and 2051 (Leeds.ac.uk, 2010 ; BBC, 2010). Other White groups are expected to increase from 2.5% in 2001 to 9.9% by 2051 (Tran, 2010), perhaps due to the European Union enlargement (at the time when these studies were conducted). During this period, the South Asian ethnic population is expected to increase more rapidly than others (Leeds.ac.uk, 2010 ; BBC, 2010). The entrepreneurial presence of South Asians in the UK portrays a similar picture.
2.2 South Asian entrepreneurship in the UK
South Asians came to the UK on a large scale on two occasions, in the 1950s and 60s typically to fill the labour shortage, and in the late 1960s and early 70s from Kenya and Uganda (already mentioned). Whatever were the reasons, they came without any substantial amount of money, but with a spirit to be successful in a foreign land where finance, language, and availability of well-paid jobs were serious problems they faced (Basu, 1998). By the late 1980s they were in the ownership of around one-third of the independent retail outlets (Basu, 1998 ; Jones and Ram, 2003). This achievement was applauded by distinguished individuals and the media (Jones and Ram, 2003).
15
Their entrepreneurial success was acknowledged in the 1991 Census, where it was revealed that 7.21% employment in the SME industry was offered by SAEM SMEs compared with 3.89% employment offered by SMEs belonging to the mainstream White community (Basu, 1998). This trend continued until the late 1990s, when a period of slow growth was experienced by almost all businesses in OECD countries (Blanchflower, 2004). While this downturn hit Asian businesses harder than the mainstream enterprises because Asian businesses were already involved in low value and subsistence entrepreneurship, they managed to maintain their superiority in self-employment (Jones and Ram, 2003). This success was attributed to favouring conditions such as the increased trend of subcontracting in the manufacturing industry and the eating-out lifestyle changes amongst masses with a preference to South Asian traditional cuisine (Jones and Ram, 2003). Consequently, South Asian curry houses in the UK increased from around 1,000 in the 1970s to around 8,300 in 1998 and their combined gross turnover in 1999 was recorded as £1.73 billion (Jones and Ram, 2003). Some researchers, however, dispute the apparent historical success of South Asian small businesses.
2.3 Historical decline of South Asian entrepreneurship
Some scholars have argued that the successful SAEM businesses in the UK are not a representative sample because unemployment, underemployment, and outright poverty are still common in this community (Brah, 1996). Others highlighted the decline of South Asian businesses and argued that after the 1990s they struggled to survive, because of two reasons, according to Jones and Ram (2003).
First, a large part of their market share was taken away by the rapid growth of the large supermarkets. Second, the introduction of forecourt retailers in the motorway service stations and petrol stations made success for these small businesses more difficult and caused their quantitative decline. The repeal of the 1950 Shops Act in 1994, which allowed all shops/supermarkets to operate on Sundays and/or 24 hours a day during weekdays, made the quantitative decline of small businesses, including those owned by South Asians (Jones and
16
Ram, 2003). However, scholars do not consider this quantitative decline a failure per se.
2.4 Recent trends of South Asian entrepreneurship
The total number of private sector businesses in the UK increased from around 3.5 million in 2000 to around 4.8 million in 2010 (cf. Table 2 below) (Rhodes, 2013), which is an increase of about 40%. According to BIS (2012) and FSB (2013), 99.9% of these businesses belong to SMEs, whose combined contribution was 34.4% of the total private sector turnover, and they accounted for nearly half of all private sector employment. According to CREME (2013), ethnic minority enterprises contribute an estimated £25 to £32 billion each year to the UK economy. A recent survey revealed that 10% of small businesses employing people are owned by ethnic minority groups in England (Whitehead et al., 2006). Another survey showed that ethnic minority small businesses in the UK are more likely to export and are more profitable than mainstream small businesses (Bank of England, 1999). A more recent survey in the US found that ethnic minority entrepreneurship is almost double (0.53%) than the mainstream White persons’ entrepreneurship (0.28%) (Chand and Ghorbani, 2011). The same survey shows that between 1996 and 2008 Asian American ethnic minority entrepreneurship increased from 0.29% to 0.35%, whereas entrepreneurship owned by White persons decreased from 0.33% to 0.31%, and that of the Black Americans only increased from 0.21% to 0.22%.
These figures show that while the rates of entrepreneurship amongst ethnic minorities may vary from one context to another, the entrepreneurial journey of South Asians continues to be an upward phenomenon. For example, out of the 4.8 million total SMEs in the UK (mentioned above), it is estimated that 8% belong to ethnic minorities, out of which 46% are managed or owned by Indians, 18% by Pakistanis and 16% by black Caribbean and Africans together (BIS, 2010). Statistics also indicate that ethnic minority business prospects in the UK are encouraging because in spite of the recent financial downturn, 60% of them maintained pre-recession staffing levels, 21% even employed more, and only 19% employed fewer people (BIS, 2011). Moreover, 56% of them
17
expected to maintain the same staffing levels, 25% hoped to employee more, while only 18% expected to employ fewer staff (BIS, 2011). These figures show a continued positive-growth pattern of ethnic minority businesses (as shown in the following tables), even during a period when several mainstream businesses experienced inevitable squeeze.
Table 2: Ethnic Minority SMEs in the UK and ethnicity of their directors/partners (in numbers, 2001 Census Data) S u rv e y Total p ri v a te s e c to r e n te rp ris e s in th e U K Total S M E s in t h e UK Eth n ic mi n o rit y S M E s Ethnicity of directors/partners In d ian P a k is ta n i B a n g lad e s h i C a ribb e a n A fr ic a n C h ine s e 2006/07 4,500,000 4,495,500 359,640 161,838 53,946 7,193 7,193 14,386 25,175 2007/08 4,680,000 4,675,320 374,026 164,571 71,065 11,221 37,403 18,701 22,442 2010 4,800,000 4,795,200 383,616 176,463 69,051 34,525 23,017 34,525 15,345 2012 4,799,400 4,794,601 335,622 83,906 57,056 3,356 20,137 20,137 30,206
Table 3: Ethnic Minority SMEs in the UK and ethnicity of their directors/partners (in percentage, 2001 Census Data) S u rv e y Total p ri v a te s e c to r e n te rp ris e s in th e U K Total S M E s in th e U K E th n ic mi n o rit y S M E s Ethnicity of directors/partners In d ian P a k is ta n i B a n g lad e s h i C a ribb e a n A fr ic a n C h ine s e 2006/07 4.50 million 99.9% 8% 45% 15% 2% 2% 4% 7% 2007/08 4.68 million 99.9% 8% 44% 19% 3% 10% 5% 6% 2010 4.8 million 99.9% 8% 46% 18% 9% 6% 9% 4% 2012 4.7994 million 99.9% 7% 25% 17% 1% 6% 6% 9%
Sources: (BIS, 2009 ; BIS, 2011 ; BIS, 2013); Copied from: Haq (2015, p. 499)
The above tables show that SAEM SMEs in the UK dominate ethnic minority owned/managed SMEs from 2006 to 2012, but there is a big drop in 2012 compared with the previous two years. During this period (2006/12), the number of SMEs owned/managed by Pakistanis remained relatively high, whereas those of Indians and Bangladeshis have dropped. The relative stability of Pakistani SMEs and the drop of Indian SMEs confirm past research. Most Indians, in contrast to many other ethnic groups, including Pakistanis, have switched from self-employment to highly-paid jobs in the mainstream job market, thanks to their high levels of (UK earned) education (Jones and Ram, 2003 ; Jones et al., 2012).
18
Specifically, according to Clark and Drinkwater (2010), as of 2003/06 the rates of self-employment for Indian males fall from 23.7% to 21.4%, whereas it was recorded highest amongst Pakistani men (31.1%) among eight ethnic groups - White, Black Caribbean, Black African, Indian, Pakistani, Bangladeshi, Chinese, and Others. As for Bangladeshis, their self-employment rate increased from 18.8% in 1991 to 19.1% in 2001 and then decreased to 15.7% in 2003/06 (Clark and Drinkwater, 2010). The 2011 Census data showed a similar pattern, i.e., self-employment amongst Indian, Pakistani, and Bangladeshi men changed from 21.4%, 31.1% and 19.1% in 2001 to 19.8%, 31.9% and 20.5% in 2011 (Clark and Drinkwater, 2010 ; Clark et al., 2015), confirming it remained highest amongst Pakistani men. Self-employment among women from 1991 to 2001 narrowed overall for all three South Asian ethnic groups (Clark and Drinkwater, 2010). However, it decreased from 10.3% to 10% among Indians, but increased from 9.9% and 5.9% to 10.6% and 7.3% for Pakistani and Bangladeshi women respectively (Clark and Drinkwater, 2007 ; Clark et al., 2015).
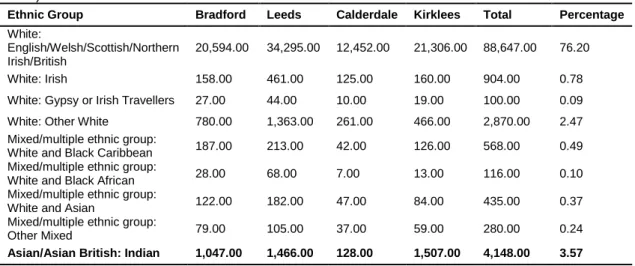
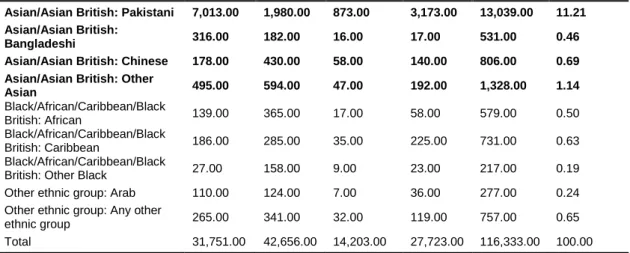
Besides the UK-wide picture, self-employment of Pakistani origin individuals is highest in Bradford (7013 or 22.09%), Leeds (1980 or 5%), Calderdale (873 or 6%) and Kirklees (3173 or 11%) (cf. Table 4). Overall, self-employment of Pakistani descent people in these towns is 11.21%, followed by Indians and other White people (3.57% and 2.47%, respectively), excluding the main White community which is 76.20%.
Table 4: Self-employed individuals of ethnic groups of age 16 and over in West Yorkshire (2001 Census Data)
Ethnic Group Bradford Leeds Calderdale Kirklees Total Percentage
White:
English/Welsh/Scottish/Northern Irish/British
20,594.00 34,295.00 12,452.00 21,306.00 88,647.00 76.20
White: Irish 158.00 461.00 125.00 160.00 904.00 0.78
White: Gypsy or Irish Travellers 27.00 44.00 10.00 19.00 100.00 0.09 White: Other White 780.00 1,363.00 261.00 466.00 2,870.00 2.47 Mixed/multiple ethnic group:
White and Black Caribbean 187.00 213.00 42.00 126.00 568.00 0.49 Mixed/multiple ethnic group:
White and Black African 28.00 68.00 7.00 13.00 116.00 0.10 Mixed/multiple ethnic group:
White and Asian 122.00 182.00 47.00 84.00 435.00 0.37
Mixed/multiple ethnic group:
Other Mixed 79.00 105.00 37.00 59.00 280.00 0.24
19
Asian/Asian British: Pakistani 7,013.00 1,980.00 873.00 3,173.00 13,039.00 11.21 Asian/Asian British:
Bangladeshi 316.00 182.00 16.00 17.00 531.00 0.46
Asian/Asian British: Chinese 178.00 430.00 58.00 140.00 806.00 0.69 Asian/Asian British: Other
Asian 495.00 594.00 47.00 192.00 1,328.00 1.14 Black/African/Caribbean/Black British: African 139.00 365.00 17.00 58.00 579.00 0.50 Black/African/Caribbean/Black British: Caribbean 186.00 285.00 35.00 225.00 731.00 0.63 Black/African/Caribbean/Black
British: Other Black 27.00 158.00 9.00 23.00 217.00 0.19 Other ethnic group: Arab 110.00 124.00 7.00 36.00 277.00 0.24 Other ethnic group: Any other
ethnic group 265.00 341.00 32.00 119.00 757.00 0.65
Total 31,751.00 42,656.00 14,203.00 27,723.00 116,333.00 100.00 Source: (Nomis, 2013).
Self-employment in England and Wales among these ethnic communities shows a similar entrepreneurial picture (cf. Table 5). In short, South Asian ethnic minority entrepreneurship in the UK continues to be a growing phenomenon (cf. Tables 4 and 5), therefore, is worth researching.
Table 5: Self-employed individuals of ethnic groups of age 16 and over in England and Wales (2001 Census Data)
Ethnic Group Total Self-employed Percentage of total
White: English/Welsh/Scottish/Northern Irish/British 3,254,197 80.46
White: Irish 45,866 1.13
White: Gypsy or Irish Travellers 4,685 0.12
White: Other White 269,618 6.67
Mixed/multiple ethnic group: White and Black
Caribbean 14,114 0.35
Mixed/multiple ethnic group: White and Black African 6,162 0.15
Mixed/multiple ethnic group: White and Asian 15,155 0.37
Mixed/multiple ethnic group: Other Mixed 14,666 0.36
Asian/Asian British: Indian 107,487 2.66 Asian/Asian British: Pakistani 84,145 2.08 Asian/Asian British: Bangladeshi 20,154 0.50
Asian/Asian British: Chinese 31,863 0.79
Asian/Asian British: Other Asian 53,157 1.31
Black/African/Caribbean/Black British: African 42,625 1.05
Black/African/Caribbean/Black British: Caribbean 29,972 0.74
Black/African/Caribbean/Black British: Other Black 10,867 0.27
Other ethnic group: Arab 12,079 0.30
Other ethnic group: Any other ethnic group 27,501 0.68
Total 4,044,313 100.00
Source: (Nomis, 2013).
The following section further highlights the shift from self-employment to paid-employment, specifically amongst British Indians.
20
2.5 A shift from self-employment to paid-employment
The number of self-employed persons within the South Asian community in the UK, more so among people of Indian descent than other South Asians, started declining in the 1970s and continues till today, which might seem a failure at face value, but is actually a success of another kind (Jones et al., 2012 ; Jones and Ram, 2003 ; Clark and Drinkwater, 2000). This shift is contributed to two interrelated factors.
First, around half of the total British Indians are British-born (Jones et al., 2012), who do not face the same, or a similar, level of discrimination in the labour market as their parents did because of their UK-specific qualifications and skills (Jones and Ram, 2003 ; Clark and Drinkwater, 2010). Second, the participation rates of this new breed in post-compulsory education is far greater than even the native White community (Jones and Ram, 2003), let alone their Pakistani and Bangladeshi counterparts (Basu, 1998 ; Clark and Drinkwater, 2010). A comparison of educational attainment between British Indians and the native White community is given in Table 6.
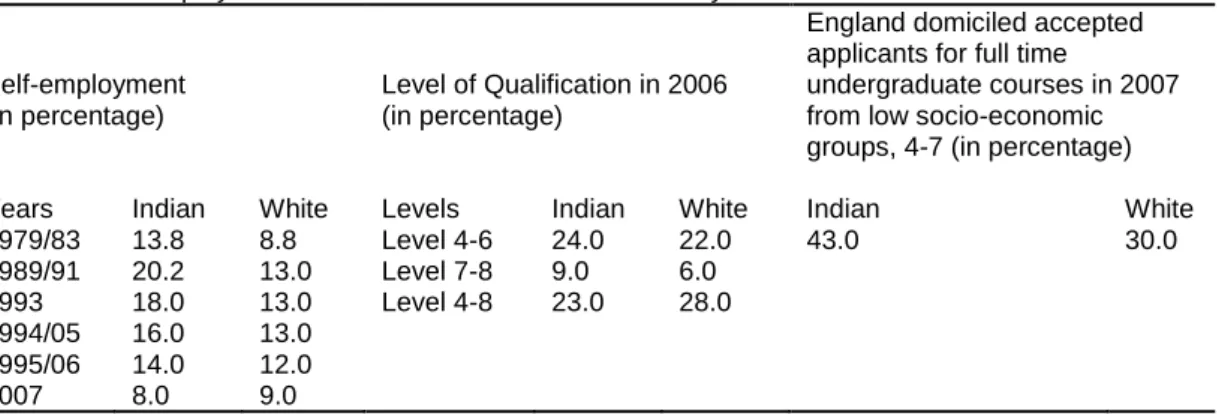
Table 6: Self-employment Indians and native white community in the UK
Self-employment (in percentage)
Level of Qualification in 2006 (in percentage)
England domiciled accepted applicants for full time
undergraduate courses in 2007 from low socio-economic groups, 4-7 (in percentage)
Years Indian White Levels Indian White Indian White
1979/83 13.8 8.8 Level 4-6 24.0 22.0 43.0 30.0 1989/91 20.2 13.0 Level 7-8 9.0 6.0 1993 18.0 13.0 Level 4-8 23.0 28.0 1994/05 16.0 13.0 1995/06 14.0 12.0 2007 8.0 9.0
Qualification levels: 4 = Certificate; 5 = Diploma/Foundation Degree; 6 = BA/BSc; 7 = MA/MSc; 8 = Ph. D. Sources: (Jones et al., 2012 ; Jones and Ram, 2013).
As shown in Table 6 above, the level of self-employment amongst the mainstream (White) community increased from 8.8% in 1979/83 to 13.0% in 1989/91, remained unchanged until after 1994/2005, then decreased for the next more than a decade. Likewise, it increased from 13.8% in 1979/83 to 20.2% in 1989/91 amongst Indians, and then decreased continuously for the
21
next more than a decade. It decreased to the lowest ever levels of 9% and 8% for both the White and Indian communities respectively by 2007. In contrast to self-employment, the overall participation in higher education amongst Indians increased. They outperformed their White counterparts, especially in the higher education among the low socio-economic groups (Jones et al., 2012), i.e., 43% compared to 30% respectively.
With regard to (better-paid) employment, according to Jones et al. (2012), the number of salaried White-collar workers amongst Indians increased from 25.89% (men) and 17.88% (women) in 1972/82 to 36.95% (men) and 29.24% (women) in 1994/2004. White-collar employment amongst White professionals during this period shows a similar increase, except for women. Salaried employment for White women increased from 16.79% during 1972/82 to 33.9% during 1994/2004, which is a bigger increase compared with the employment for Indian women (29.24%). However, the significant change in employment took place amongst Indian men as it increased from 20.44% to 26.01% in intermediate work, whereas it decreased from 53.37% to 37.40% in the low skilled labour work during the same period. Thus, the British Indian community has widened their opportunities by achieving higher levels of qualifications and have preferred better paid-employment over long hours of self-employment with low earnings per hour.
2.6 Chapter summary
Although SAEM entrepreneurship declined since it reached its peak in the 1990s, it still leads the race amongst all ethnic minorities in the UK, in proportion to their population growth. While their success is an encouraging story, the evidence comes from big metropolitan centres only, mostly from Greater London, Birmingham, and surrounding areas (Basu and Altinay, 2002 ; Basu, 1998 ; Basu, 2011). Also, it may be argued, based on statistics, that this ethnic community in other regions, such as West Yorkshire, ostensibly operates various successful enterprises. But, there is no empirical evidence, including in the already researched bigger cities, as to what factors are responsible for their apparent business success. Therefore, there is a need (and scope) for an
22
empirical enquiry into these businesses in terms of how they perceive business success and what factors they discern important for entrepreneurial and small business success. This gap is already highlighted in the previous chapter and will be further qualified in the next chapter, which also articulates some of the contemporary themes that are being debated in the ethnic minority entrepreneurship literature.
23
Chapter 3: Literature review
This chapter reviews scholarship surrounding entrepreneurship, in general, and ethnic minority entrepreneurship/small business, in particular. It discusses some of the major theoretical debates in this area of literature, including those related to this thesis’s theoretical underpinnings, i.e., the culturalist view and the mixed embeddedness model of ethnic minority entrepreneurship. The chapter then discusses various class, ethnic and intangible resources, and prepares the way for the data analysis.
3.1 A general overview of entrepreneurship
Entrepreneurs are persons who have ‘a propensity toward risk-taking, high achievement, or an internal locus of control, are thought to be leaders of innovation or catalysts who provide the “spark” for economic growth and development’ (Lee and Peterson, 2001, p. 402). According to Uhlaner et al. (2012, p. 2), ‘the essence of entrepreneurship is the pursuit of increasing the value of a business’s assets by seeking out and/or creating new business opportunities.’ As to why people become entrepreneurs, scholars (such as Basu, 1998 ; Dana et al., 2009 ; McPherson, 2010 ; Dyer and Handler, 1994 ; Clark and Drinkwater, 2010 ; Hamilton et al., 2008 ; Pio and Dana, 2014) have provided many reasons, which Haq (2015, p. 502) has summarised as:
… non-for-profit motives… self-esteem… desire for conquering new markets and or earning fame through business success in a new venture or filling a gap in the market which could be beneficial for consumers… to keep their family members together and in employment through a coordinated family strategy… and to gain social status in their community…
Not all enterprises that are established and operated by immigrants can be called ethnic minority entrepreneurship. Some can be categorised as international or transnational entrepreneurship. The former refers to businesses carried out by people (including immigrants) across national boundaries; the latter to businesses carried out by people who emigrate from one country to
24
another for business purposes and maintain businesses in both countries (Drori et al., 2009).
Ethnic minority entrepreneurship points to business activities of immigrants who share a common cultural heritage with their customers and/or suppliers (Drori et al., 2009 ; Light and Gold, 2000). ‘Ethnic minority’ is not the same as ‘immigrant’, although the two terms are used interchangeably. Immigrants are typically people who have recently emigrated from one country to another and have not yet received nationality or the equivalent status in the host country (Volery, 2007). ‘Ethnic minority’ refers to a segment who are in the minority in a society and who share a common culture that is different from that of the mainstream society in the same time and space (Yinger, 1985 ; Volery, 2007).
Culture is defined as: ‘the collective programming of the mind distinguishing the members of one group or category of people from others’ (Hofstede, 1993, p. 89). According to Thomas (2003, pp. 24-25), ‘Culture is… an organized system of values, attitudes, beliefs, and meanings that are related to each other and to the environmental context… culture is something that a group has in common that is not normally available to people outside the group.’ Based on this conception of culture, this thesis defines an ethnic minority group as:
A group of immigrant people who come from a particular region/country with a common cultural heritage to another region/country, irrespective of their legal status in the host society. For the sake of argument, the local/host country born/bred descendants of immigrant people are also considered immigrants in this thesis.
Underpinned by the above definition, it is believed in this thesis that ethnic minority entrepreneurs are different from international/transnational entrepreneurs. The latter are economic-opportunity-seeking individuals whose mobility is informed by a desire for economic gains. In contrast, ethnic minority individuals, who later may become entrepreneurs, typically find themselves emigrating to another country due to either: (a) disasters, political instability, or other unfriendly conditions in the country of origin; and/or (b) as a family reunion