San Jose State University
SJSU ScholarWorks
Master's Projects Master's Theses and Graduate Research
Spring 5-22-2017
Mining Frequency of Drug Side Effects Over a
Large Twitter Dataset Using Apache Spark
Dennis Hsu
San Jose State University
Follow this and additional works at:https://scholarworks.sjsu.edu/etd_projects Part of theArtificial Intelligence and Robotics Commons
This Master's Project is brought to you for free and open access by the Master's Theses and Graduate Research at SJSU ScholarWorks. It has been accepted for inclusion in Master's Projects by an authorized administrator of SJSU ScholarWorks. For more information, please contact
Recommended Citation
Hsu, Dennis, "Mining Frequency of Drug Side Effects Over a Large Twitter Dataset Using Apache Spark" (2017).Master's Projects. 549.
DOI: https://doi.org/10.31979/etd.8nyb-36sv
Mining Frequency of Drug Side Effects
Over a Large Twitter Dataset
Using Apache Spark
By: Dennis Hsu
Advisor: Melody Moh
CS 298 Report
Department of Computer Science
San Jose State University
San Jose, CA, U.S.A.
© 2017
Dennis Hsu
The Designated Project Committee Approves the Project Titled
Mining Frequency of Drug Side Effects Over a Large Twitter Dataset Using Apache Spark
By
Dennis Hsu
APPROVED FOR THE DEPARTMENT OF COMPUTER SCIENCE
SAN JOSE STATE UNIVERSITY
May 2017
Dr. Melody Moh
Department of Computer Science, SJSU
Dr. Teng Moh
Department of Computer Science, SJSU
ABSTRACT
Despite clinical trials by pharmaceutical companies as well as current FDA reporting systems, there are still drug side effects that have not been caught. To find a larger sample of reports, a possible way is to mine online social media. With its current widespread use, social media such as Twitter has given rise to massive amounts of data, which can be used as reports for drug side effects. To process these large datasets, Apache Spark has become popular for fast, distributed batch processing. In this work, we have improved on previous pipelines in sentimental analysis-based mining, processing, and extracting tweets with drug-caused side effects. We have also added a new ensemble classifier using a combination of sentiment analysis features to increase the accuracy of identifying drug-caused side effects. In addition, the frequency count for the side effects is also provided. Furthermore, we have also implemented the same pipeline in Apache Spark to improve the speed of processing of tweets by 2.5 times, as well as to support the process of large tweet datasets. As the frequency count of drug side effects opens a wide door for further analysis, we present a preliminary study on this issue, including the side effects of simultaneously using two drugs, and the potential danger of using less-common combination of drugs. We believe the pipeline design and the results present in this work would have great implication on studying drug side effects and on big data analysis in general.
Keywords—classification, machine learning, sentiment analysis, opinion mining, Apache Spark, Twitter, natural language processing, supervised learning, adverse drug event
ACKNOWLEDGEMENTS
I would like to thank Dr. Melody Moh for guiding me through this project and helping me find my path relevant to my interests. Without her, I would have been lost and overwhelmed many times. She has been so kind, patient, and helpful; and I am grateful to have her as my advisor.
I am very thankful to Dr. Teng Moh for helping me through the technical details of my project. His guidance along with his master’s project group meetings really helped me whenever I had tough problems or became stuck in the project.
I would also like to thank Dr. Thomas Austin for being my committee member. He was one of my very first professors at San Jose State University, and his classes really began my interests into branching out into the numerous fields within computer science, and I am very grateful for his support in my time as a graduate student.
Finally, I would like to thank my family for continually supporting me through graduate school and allowing me the opportunity to pursue a degree in computer science. They have always been there for me and provided me with their emotional support and constant encouragement.
TABLE OF CONTENTS
ABSTRACT………...4
ACRONYMS……….7
LIST OF FIGURES AND TABLES………8
CHAPTER 1: INTRODUCTION………9
CHAPTER 2: RELATED WORKS………..11
2.1 Sentiment Analysis using N-Grams……….………..11
2.2 Sentiment Analysis on Twitter for Drug Side Effects………...11
2.3 Adverse Drug Events………..………....11
2.4 Apache Spark………..………...…12
CHAPTER 3: DESIGN AND APPROACH………...14
3.1 Mining and Filtering Twitter through Livestream………..…………..14
3.2 Data Preprocessing………14
3.3 Feature Extraction……….…14
3.4 Machine Learning Classification………..16
3.5Frequency Extraction………...16
3.6Large Dataset Processing with Spark……….…...17
CHAPTER 4: EXPERIMENT SETUP……….19
4.1Pipeline Setup……….19
4.2Spark Setup………19
CHAPTER 5: RESULTS………21
5.1Accuracy………...…21
5.2Pipeline Speed Comparison………...22
5.3Frequency of Drug Side Effects………....…22
5.4Challenges and Limitations………...24
CHAPTER 6: NEXT STEPS: APPLICATIONS OF DRUG SIDE EFFECT FREQUENCY ANALYSIS……….….26
6.1Most Frequently Reported Side Effects……….………....26
6.2Side Effects Caused by More Than One Drug………...…...26
6.3Side Effects Caused by Most Popular Drug Pairs………27
6.4Potential Danger: Side Effects Associated with Uncommon Drug Pairs………....28
CHAPTER 7: CONCLUSION AND FUTURE WORK………..29
ACRONYMS
ADE:
Adverse Drug Event
ADHD:
Attention-Deficit Hyperactivity Disorder
API:
Application Program Interface
DP:
Data Pre-Processing
DTC:
Decision Tree Classifier
FAERS:
FDA Adverse Event Reporting System
FDA:
Food and Drug Administration
FE:
Feature Extraction
GNB:
Gaussian Naïve Bayes
kNN:
k-Nearest Neighbors
LGR:
Logistic Regression
MLlib:
Apache Spark Machine Learning Library
MPQA:
Multi-perspective Question Analysis
NLTK:
Natural Language Toolkit
POS:
Part-of-Speech
RDD:
Resilient Distributed Dataset
REGEX:
Regular Expressions
RFC:
Random Forest Classifier
SGD:
Stochastic Gradient Descent
SVM:
Support Vector Machine
LIST OF FIGURES AND TABLES
Figure 1: Pipeline for Extracting Frequency of Drug Side Effects from Twitter……….14
Figure 2: Ensemble Classifier………16
Table 1: MetaMap Semantic Groups and Abbreviations………...17
Figure 3: Spark Pipeline……….18
Table 2: Classifier Accuracies (f1-Measure Score)………...21
Table 3: Pipeline Times for Scikit-Learn and Spark………...22
Table 4: Top 10 Most Reported Drugs by Twitter Users………22
Table 5: Frequency of Side Effects for 7 Drugs………...23
Table 6: Xanax Side Effects and Frequency Reported………24
Table 7: Top 5 Most Mentioned Drugs in Multiple-Drug Tweets………..26
Table 8: Top 5 Most Mentioned Drug Pairs……….27
CHAPTER 1.
Introduction
Monitoring drug side effects is an important task for both the Food and Drug Administration (FDA) as well as the pharmaceutical companies developing the drugs. Missing these side effects can lead to potential health hazards that are costly, forcing a drug withdrawal from the market. Most of the important side effects are caught during the drug clinical trials, but even those trials do not have a large enough sample size to catch all the side effects. As for drugs that are already on the market, current reporting systems for those drugs use voluntary participation, such as the FDA Adverse Event Reporting System (FAERS), which monitors reports of drug side effects from health care providers [1]. Thus, the system only catches side effects that are considered severe, missing side effects that are not reported by your average consumers.
To solve this problem, one solution is to use a much larger database where many more reports of side effects can be extracted: social media. With the current widespread use of social media, the amount of data provided by the platforms such as LinkedIn, Facebook, Google, and Twitter is enormous. Social media has been used in many different fields of study due to the large sample size as well as ease of access. For mining drug side effects, social media has many different users who report their daily use of the drugs they are taking as well as any side effect they have, and most of these reports are in the form of communication to other users.
The objectives of the work in this paper are to design and implement an improved pipeline that will aid in mining twitter for frequency of reported drug side effects, to improve the speed of the pipeline, and to support large datasets using Apache Spark. The data we use will come from Twitter, which has its own set of unique features. Twitter was chosen because of ease of access to the data in the form of tweets through the Twitter Application Program Interface (API). Also, the tweets are only 140 characters long, making it easy to process and store.
To extract drug side effects from Twitter, there are numerous challenges to overcome. There have been previous works in this regard [2][3][4][5], all of which have excellent explorations into different ways of classification and extraction. The work here expands on extraction, focusing mostly on sentiment analysis (opinion mining) tools. Sentiment analysis is the process of identifying and categorizing opinions expressed in text [6], and in our case using these opinions to classify the tweets as positive or negative. To get the frequency of tweets, identifying tweets with drug side effects is required, and sentiment analysis tools use features such as reactions to taking a drug to provide such identification.
Some other challenges of extraction with tweets include reducing the amount of noise in tweets. Tweets usually contain incomplete sentences as well as acronyms and general slang. Tweets also must be filtered
properly to remove spam such as advertisements by drug companies or announcements by news organizations.
Finally, the dataset mined in this work is larger than our earlier works [2][3][4]. To process this dataset, Apache Spark has been used to speed up the pipeline. Apache Spark is an open source distributed cluster framework that can provide parallel processing to speed up extraction from the dataset [9].
The main contributions of this work are summarized below:
1. A faster pipeline using sentiment analysis tools to extract features for the tweets
2. An enhanced machine learning classifier to identify tweets containing drug side effects with improved accuracy
3. The support for large datasets of tweets using Apache Spark which achieves 2.5 times faster processing speed
CHAPTER 2.
Related Work
2.1
Adverse Drug Events
Adverse Drug Events (ADE) are any type of injury or harm that are caused by taking a drug for medication. Catching and monitoring ADEs are extremely important to the FDA to make sure drugs on the market are safe. However, most of the research and studies into ADEs rely on voluntary self-reports either by the patient or nurses and hospitals. One study focused on finding the incidence rate and preventability of ADEs in hospitals, but relied on doctor and nurse reports [7]. The study found most ADEs were common and preventable, and most occurred due to the wrong ordering of the drug, such as incorrect dosage. There has been research in automating identification of ADEs reported in hospital settings [8], but the ADEs still come from voluntary reports while missing out on users who do not visit hospitals or clinics.
2.2
Sentiment Analysis using N-Grams
Sentiment Analysis with n-grams has been around for two decades. Cavnar and Trenkle first introduced the concept of n-grams for text categorization of documents [11]. There are two types of n-grams: word grams and character grams. Word grams convert documents into token counts based upon different words in the document while character grams break the document into sets of n-characters. The reasoning behind using n-characters is to be tolerant of errors in the text, especially with spelling. They were able to achieve a high accuracy of 80 percent in categorizing texts from news articles into groups. Using character n-grams is especially useful for Twitter, as tweets from users often have incorrect spelling as well as acronyms and short-hand words. N-grams, from unigrams all the way to four-grams, are used in our work.
2.3
Sentiment Analysis on Twitter for Drug Side Effects
Several works have been reported on mining twitter for drug side-effects [2][3][4][5].
Jiang and Zheng extracted drug side effects [5] with the use of MetaMap [10]. Using 5 different drugs as their dataset, they developed a machine-learning classifier to automate classification of tweets with drug-caused side effects, followed by extraction of drug side-effects using MetaMap. They used user experience as the main feature for correct classification of the tweets.
Wu, Moh, and Khuri focused on using opinion lexicons and subjective corpuses as features for classifying tweets [2]. They first constructed a pipeline for extracting drug side effects from tweets, but focused only on a small sample size of four drugs. The features that were used in this approach were syntactic features such as question marks and negations as well as the sentiment scores from the different corpuses. For the four drugs, they were able to achieve a f-measure score of 79.5% using Support Vector Machine (SVM) [26] as the machine learning classifier.
Yu and Moh’s work took a different approach and focused instead on the cause-effect relations between the drug and the side effect [3]. Tweets containing drugs that directly caused the side effect were the ones identified as positive. To extract this relation, n-grams were used as features. Lemmatization of the tweets was also used to reduce the noise of the text to allow for better n-gram features. Using unigram and bigram words, a 76.9% accuracy was achieved for a large sample of drugs.
Peng and Moh’s work [4] further improved on the techniques of Wu’s approach [2]. They continued to focus more on specifically capturing only tweets related to five different drugs. Their experiment results gave a better detection rate, five times more than the original, as well as simplifying classification techniques.
Our current approach focuses on combining the techniques from the two earlier approaches [2][3] for further improvement. The sentiment features from lexicons of the first approach [2] as well as the n-gram features of the second approach [3] are both used as features. Also, more machine learning classifiers are explored and combined to test the best combination of these features. In addition, our approach also uses MetaMap to extract drug side effects [5] in order to calculate the frequency for further analysis and applications.
2.4
Apache Spark
Apache Spark is a cluster computing system that has become widely used in the recent years. It is an improvement over Hadoop’s MapReduce paradigm in terms of speed of batch processing [9]. Spark distributes the workload over a cluster for distributed, parallel processing.
Apache Spark’s core feature is the resilient distributed dataset (RDD), a read-only dataset over the whole cluster. RDDs can be stored in memory for faster repeat batch processing instead of being stored on the system’s hard-disk. RDDs are also fault-tolerant and can be used in the same tasks that Hadoop can do such as mapping and reducing. Spark has an extensive set of tools supported, and their machine learning library is widely used and integrated well with their RDD paradigm.
Apache Spark is extremely useful when processing large datasets. In the work by Harnie et al [12], Spark is used to improve the speed of identification of potential drug targets to be studied in clinical trials. The original pipeline was changed to process the drug compounds in parallel by running the potential targets through multiple machine learning predictors and calculating a combined score as the identifying feature for the compound. The predictors gave a score for the compound based on how well the compound could target a protein, and this interaction was based on how well the compound’s shape complemented the protein shape. They partitioned their data into multiple chunks in order to process their dataset of compounds in parallel. The results of their work showed that the time for processing their large dataset decreased linearly with the
number of nodes used in Spark. Similarly, in our work, Spark is used to process the large dataset by splitting the tweet dataset into chunks for parallel processing to improve pipeline speed.
CHAPTER 3.
Design and Approach
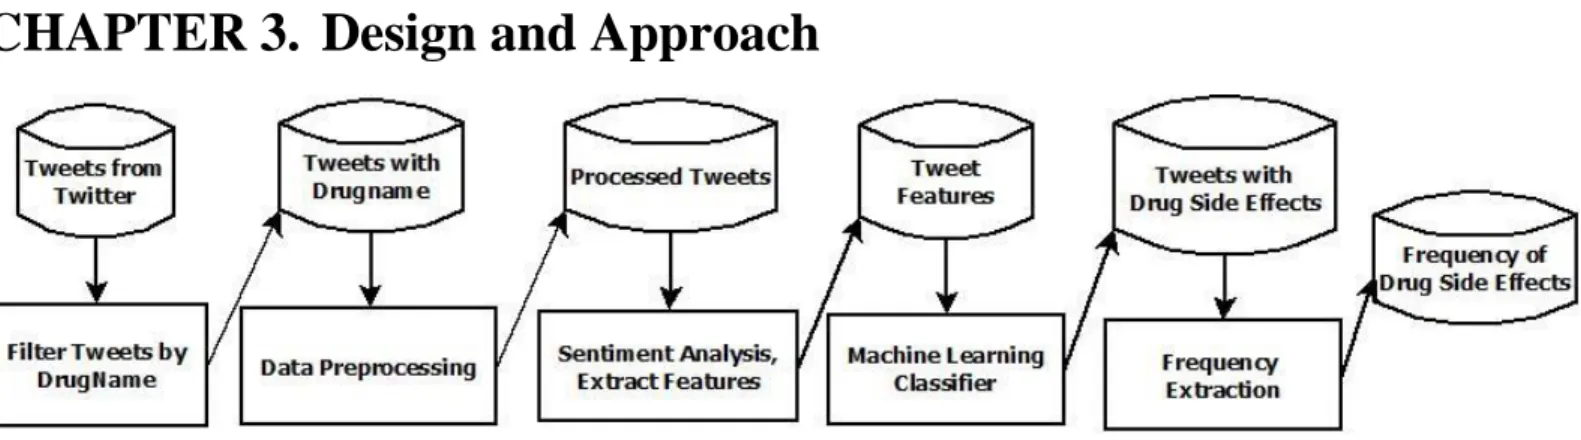
Figure 1: Pipeline for Extracting Frequency of Drug Side-Effects from Twitter
The pipeline from start to finish should be able to identify whether a tweet contains a drug-caused side effect and at the end output an updated count of the different side effects reported for each drug. There are five parts to the pipeline, as shown in Figure 1. First the tweets are mined and filtered. Then the tweets are preprocessed before features are extracted. Finally, the classifier uses the features to identify the drug side-effect related tweets and then the frequency of the side-side-effects is extracted and updated. These steps are explained in the subsections below.
3.1
Mining and Filtering Twitter through Livestream
In this first step, tweets are mined from Twitter through a livestream. Tweepy [13], a Python library, was used to access the Twitter streaming API. The stream was mine for 9 days in December for a total of 486,689 tweets. The tweets were then stored in a csv file for bulk processing. The stream was filtered for keywords containing drug names taken from the top most popular drugs from the drugs website [14], totaling 462 different drug names. The drug names from the website were names that were most commonly used instead of the drug’s actual scientific name.
Other filters were also included to further remove spam from the dataset:
1) No retweets: only tweets from users who are self-reporting drug side-effects were mined. Most of the retweets contained advertisements from pharmaceutical companies.
2) Tweets with less than 10,000 followers: users with more were usually organizations or celebrities. Our target was the average consumer.
3) Only English tweets were considered for ease of text processing as well as natural language processing.
3.2
Data Preprocessing
In the second step, the tweets in the csv file were further preprocessed to reduce noise. The preprocess steps that were used on the data included:
1) Any tweet that started with “RT” was removed. The Twitter API does not completely filter out all retweets, so the tweets had to be checked a second time.
2) All hashtags and usernames were removed.
3) All non-alphanumeric characters and punctuation were removed to allow for easier text processing. The characters were all converted to lowercase as well.
4) All drug names in the tweet were replaced with the keyword “drug.” Due to the different distribution of drug tweets in the dataset, normalization of the drug name was required to balance the dataset [3]. 5) The words in the tweet were lemmatized. The Natural Language Toolkit (NLTK) [15] was used to
lemmatize the words down to their base form to further reduce noise. The words in the tweet were tokenized and labeled with a Part of Speech tagger before lemmatization.
Note that stop words were not removed due to the small length of each tweet.
3.3
Feature Extraction
After the data was preprocessed, the features were then extracted for classification using sentiment analysis, specifically two separate methods. Previous works only used n-gram cause-and-effect relations or opinion lexicons, but not both [2][3]. The experiment here uses both n-gram and lexicons as features to train the classifier.
For the n-gram classification, the experiment tested using a combination of unigram, bigram, and trigrams, both as words and as characters.
For the opinion mining lexicons, the amount of words covered is small. Thus, multiple lexicons are used to get the most coverage of words. The experiment tested out using a combination of four different lexicons:
1) SentiWordNet [16]: this lexicon assigns each word a positive, neutral, or negative score number. SentiWordNet also uses Part of Speech (POS) tagging to distinguish between different forms of words [17].
2) AFINN [18]: this lexicon rates each word a sentiment score between positive five and negative five 3) MPQA [19]: Multi-Purpose Question Analysis has its own subjectivity lexicon that rates each word as
strong/weak positive or negative. In this experiment, we had strong be a magnitude of five while a weak be a magnitude of one.
4) Bing-Liu [20]: This lexicon contains more slang words and jargons than the other lexicons. The lexicon splits the words into positive and negative lists, which in our experiment, we gave a score of positive one and negative one, respectively.
3.4
Machine Learning Classification
The features from sentiment analysis were used to train the machine learning classifiers through supervised learning. For our classifier, 1000 tweets were manually labeled, with half of the tweets being positively identified as having drug-caused side effects to provide a balanced training dataset. Different combinations of n-gram and lexicon features were used to train the following different classifiers:
1) Gaussian Naïve Bayes (GNB)
2) Logistic Regression (LGR)
3) Support Vector Machine (SVM)
4) Stochastic Gradient Descent (SGD)
5) k-Nearest Neighbors (kNN)
6) Decision Tree Classifier (DTC) 7) Random Forest Classifier (RFC) 8) Ensemble Classifier
(NB, LGR, SVM, SGD, kNN, DTC)
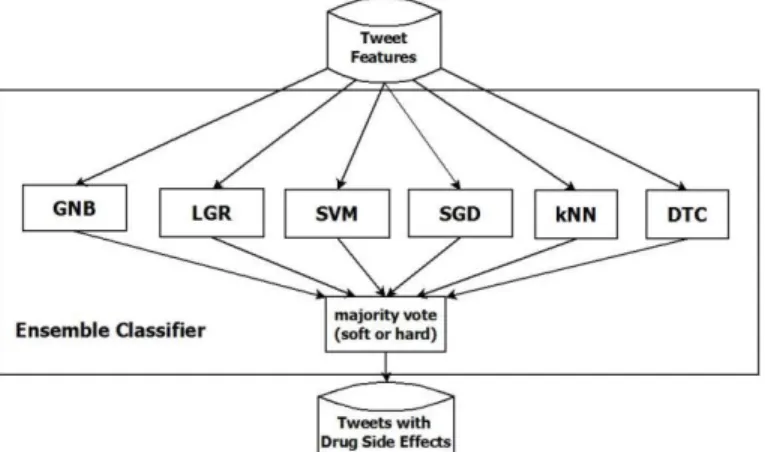
Note that the ensemble classifier is a combination of the first six classifiers taken together in a majority voting (hard vote) or a prediction of probabilities (soft vote), as shown in Figure 2. The ensemble classifier provides a better overall predictive accuracy than any of the classifiers it uses by itself [21]. By tweaking the weights of the classifiers, the ensemble’s best accuracy can be found.
Figure 2: Ensemble Classifier with 6 classifiers and a soft or hard majority vote of the classifier predictions
3.5
Frequency Extraction
After training the classifier and identifying the drug side-effect related tweets, a frequency count is taken. To get the frequency, the text extraction of drug side effects in each tweet is done by MetaMap. MetaMap is a tool for recognizing medical concepts from the Unified Medical Language System (UMLS) [10][22].
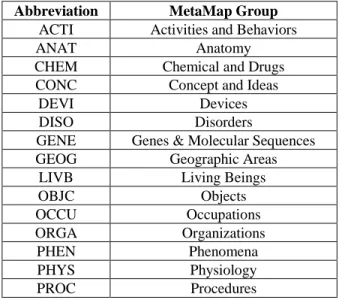
Currently, there are 15 different semantic group types in MetaMap, each with multiple subcategories, with no change from what was used in the previous work [2], as shown in Table 1.
MetaMap extracts medical text from the tweet and maps it to a UMLS medical term with a certain confidence. For our experiment, we set the confidence to 850 out of 1000 as the lower bound for accepting a mapping by MetaMap. Once extracted, the side-effects were then grouped by each drug for analysis. The most common side effects as well as rare side effects could then be observed.
Table 1: MetaMap Semantic Groups and Abbreviations
Abbreviation MetaMap Group
ACTI Activities and Behaviors
ANAT Anatomy
CHEM Chemical and Drugs CONC Concept and Ideas
DEVI Devices
DISO Disorders
GENE Genes & Molecular Sequences GEOG Geographic Areas
LIVB Living Beings
OBJC Objects OCCU Occupations ORGA Organizations PHEN Phenomena PHYS Physiology PROC Procedures
3.6
Large Dataset Processing with Spark
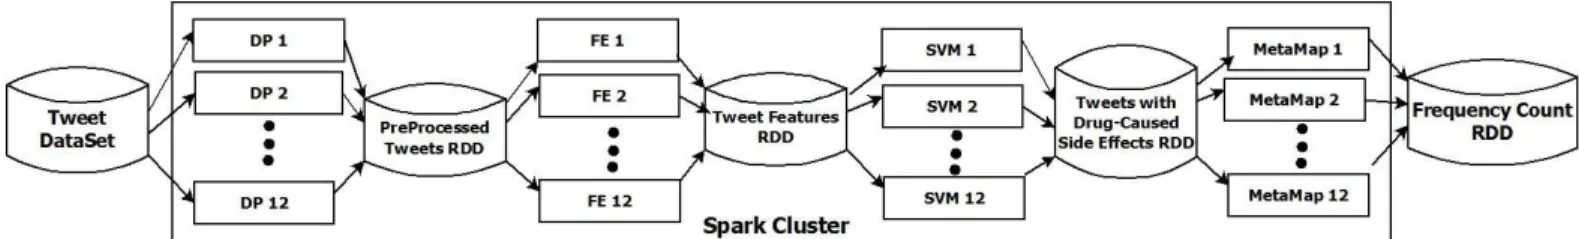
After creating the pipeline initially in a Python environment, implementing the pipeline in Spark was done, as shown in Figure 3. Spark’s RDDs as a well-distributed framework allows for parallel processing of all the tweets [9].
For Spark, we first trained Spark’s classifier using our previous feature sets used in the original pipeline. Next, the Spark pipeline was implemented in the following steps:
1. The large input dataset RDD was partitioned and mapped out to the nodes. The classifier on each node identified if the tweet contained a drug-caused side effect.
2. The positively identified tweets were then reduced back into a RDD containing all the tweets with drug-caused side effects.
3. The tweets were then labeled with a key that is the drug name associated with the tweet.
4. Frequency extraction with MetaMap was then run on the RDD and the frequency counts for each side effect were returned as (side effect, count) pairs.
5. The (side effect, count) pairs were then reduced back into one RDD and outputted back to a data text file.
Figure 3: Spark Pipeline with 12 cores for distributed processing. RDDs are stored in memory between each step. Spark is assigns tasks by automatically partitioning at each step: Data Preprocessing (DP), Feature Extraction (FE), Support Vector Machine Classifier (SVM), and Frequency Extraction with Metamap.
CHAPTER 4.
Experiment Setup
For the experiment, two separate pipelines were constructed: one (as shown in Figure 1) for testing the different machine learning classifiers, and the other (as shown in Figure 2) for testing Apache Spark for large datasets. The pipelines were then compared for speed from the starting point of the twitter dataset to the final output of the side-effect frequencies.
4.1
Pipeline Setup
For the initial pipeline, shown in Figure 1, the goal was to test which set of features as well as which machine classifier performed the best.
In the initial stream through Tweepy, 486,689 tweets in total were mined over 9 days. After removing the retweets not caught by the filter, duplicate tweets were removed. Using the sequence matcher from Python’s difflib, all tweet that had 0.6 similarity or above were removed, leaving 226,834 tweets as our dataset.
Using regular expressions (Regex), the tweets were preprocessed using the steps shown in section 3.2. NLTK was then used to lemmatize each tweet further to remove noise.
Next, sentiment scores were extracted from each of the four lexicons. For each lexicon, the sum of the sentiment scores for each word in the tweet was calculated as the feature. The sentiment scores were then categorized using a one-hot encoder in order to provide better feature weight against the n-gram features. For the n-gram features, scikit-learn’s tfidf vectorizer was used to create unigrams through four-grams [23].
The tweet’s extracted features were then run through the machine classifier and were classified as having drug related side effects or not. If it is positively identified, then the tweet is then passed to MetaMap and the side-effects extracted by MetaMap are then stored in a dictionary for the drug along with its count. At the end, the frequency of the side-effects for each drug is then outputted.
4.2
Spark Setup
The Spark pipeline, as shown in Figure 3, was created using Spark’s machine learning library MLlib [24]. Spark supports Scala, Java, and Python. For the pipeline, PySpark was used for preprocessing, feature extraction, and machine learning classification, and the tools used were the same as the sci-kit learn pipeline [25]. NLTK was used for data preprocessing and sentiment score features, while MLlib’s vectorizers were used to extract n-gram features as well as One Hot Encoding of the sentiment scores. For testing of the Spark pipeline speed, SVM was used as the comparison between the Sci-Kit Learn Pipeline and the Spark Pipeline [26]. The output tweets identified by Spark’s classifier were then stored as a permanent RDD in memory with the persist function. The RDD was then passed through the Java API of MetaMap for side-effect mapping and the output was then collected and reduced to get the frequency output of the side-effects reported for each drug.
For splitting up the dataset, a Spark configuration of two nodes running on two virtual machines were implemented to allow for parallel processing. The dataset was partitioned automatically over the two nodes, which had a combined total of 12 cores, giving 12 partitions of approximately 18,902 tweets per partition. A map to the two nodes was called to allow Spark to run the predictions in parallel, but an inner map call was used to allow the predictions to occur on each node sequentially. The predicted tweets were then run through MetaMap on another Spark job due to MetaMap being supported only with a Java API. The side effect counts were extracted before being merged together into an output text file.
CHAPTER 5.
RESULTS
In the following, results on accuracy, processing speed-up, and frequency of drug side effects are presented.
5.1
Accuracy
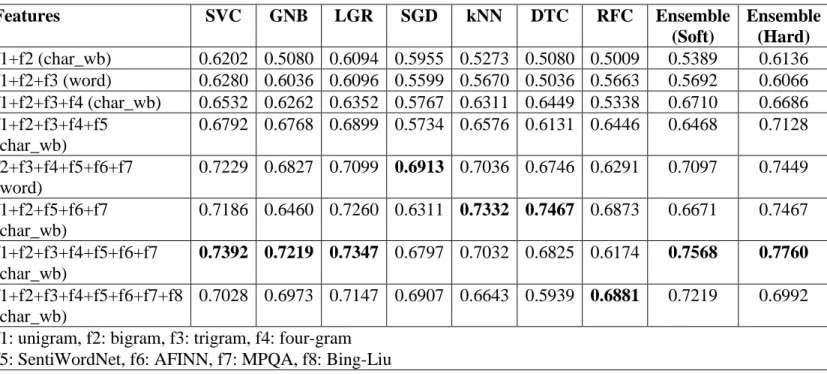
For testing the Scikit Learn Pipeline, a 5-fold cross validation was used on different combinations of features. The weighted f1 score was then calculated for each of the machine learning classifiers for comparison, as shown in Table 2. The experiment with unigram and bigram was used as a baseline for comparison with the other features.
The best classifier was the Ensemble Classifier with hard voting with a f1 measure score of 0.7760. Different weights were tested for the ensemble classifier, and the optimal weights were double weight for both SVM and LGR compared with the other four classifiers. RFC was excluded from the ensemble classifier as RFC itself is an ensemble classifier. Using Yu and Mohs’ work as a baseline of their best f1 score of 0.7690 with SVM [2], our ensemble classifier had a small improvement. The best non-ensemble classifier was the DTC with a f1 measure score of 0.7467, which still was a small improvement from the previous work’s decision tree classifier f1 score of 0.7447 [2].
Table 2: Classifier accuracies (f-measure score weighted) for different combinations of features with best for each in bold
Features SVC GNB LGR SGD kNN DTC RFC Ensemble (Soft) Ensemble (Hard) f1+f2 (char_wb) 0.6202 0.5080 0.6094 0.5955 0.5273 0.5080 0.5009 0.5389 0.6136 f1+f2+f3 (word) 0.6280 0.6036 0.6096 0.5599 0.5670 0.5036 0.5663 0.5692 0.6066 f1+f2+f3+f4 (char_wb) 0.6532 0.6262 0.6352 0.5767 0.6311 0.6449 0.5338 0.6710 0.6686 f1+f2+f3+f4+f5 (char_wb) 0.6792 0.6768 0.6899 0.5734 0.6576 0.6131 0.6446 0.6468 0.7128 f2+f3+f4+f5+f6+f7 (word) 0.7229 0.6827 0.7099 0.6913 0.7036 0.6746 0.6291 0.7097 0.7449 f1+f2+f5+f6+f7 (char_wb) 0.7186 0.6460 0.7260 0.6311 0.7332 0.7467 0.6873 0.6671 0.7467 f1+f2+f3+f4+f5+f6+f7 (char_wb) 0.7392 0.7219 0.7347 0.6797 0.7032 0.6825 0.6174 0.7568 0.7760 f1+f2+f3+f4+f5+f6+f7+f8 (char_wb) 0.7028 0.6973 0.7147 0.6907 0.6643 0.5939 0.6881 0.7219 0.6992
f1: unigram, f2: bigram, f3: trigram, f4: four-gram f5: SentiWordNet, f6: AFINN, f7: MPQA, f8: Bing-Liu
The best features to use were all four n-grams from unigram to four-gram plus three of the lexicons: SentiWordNet, AFINN, and MPQA. The trend of the data shows more features gives better accuracy up to a
certain point. Adding the feature of the final lexicon Bing Liu gave a lower accuracy, which most likely is caused by over-fitting.
5.2
Pipeline Speed Comparison
Next, we compared the speed between the SciKit Learn Pipeline (shown in Figure 1) and the Apache Spark Pipeline (shown in Figure 3) using the SVM classifier. From our dataset, 200,000 tweets ran through the both pipelines and the time was recorded upon completion, as shown in Table 3. Spark was faster than the Scikit Learn pipeline by around 2.5 times due to Spark’s parallel processing capabilities.
Table 3: Total Time to Extract Frequency of Drug Side Effects for Both Pipelines
Pipeline Total Time (minutes)
SciKit Learn 257.88
Apache Spark 105.63
5.3
Frequency of Drug Side Effects
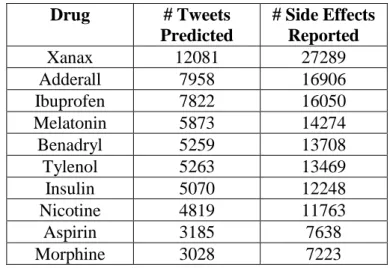
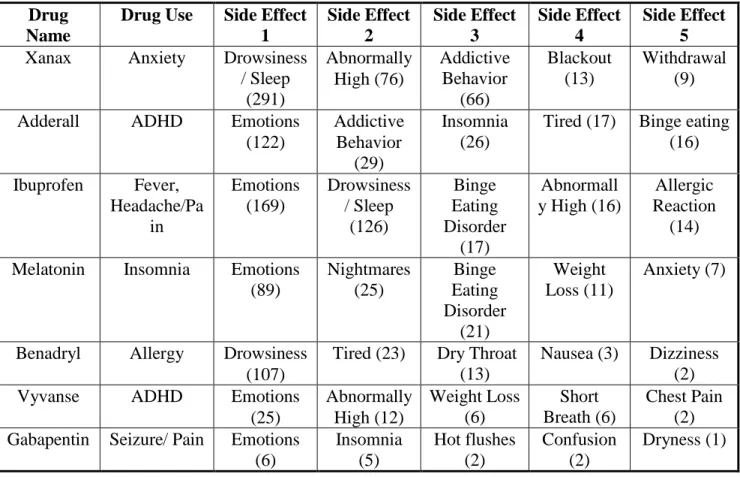
Out of the 200,000 tweets, 78,242 tweets were predicted as tweets containing drug side effects. Table 4 shows the top ten drugs with the most side effects reported. To further investigate these drugs and their side effects, and to compare with the previous work [2], we list the top five (plus two more) drugs in Table 5, each with their five most reported negative side effects for these were manually examined and extracted from the list of side effects.
Table 4: Top 10 Most Reported Drugs by Twitter Users
Drug # Tweets Predicted # Side Effects Reported Xanax 12081 27289 Adderall 7958 16906 Ibuprofen 7822 16050 Melatonin 5873 14274 Benadryl 5259 13708 Tylenol 5263 13469 Insulin 5070 12248 Nicotine 4819 11763 Aspirin 3185 7638 Morphine 3028 7223
Most of the side effects were from the MetaMap semantic groups “Disorder” and “Physiology”. Note that the side effects reported do not consider if the side effects were directly caused by the drug.
Table 5: Frequency of Side Effects Reported, showing the top five reported side effects per drug with number reported
Drug Name
Drug Use Side Effect
1 Side Effect 2 Side Effect 3 Side Effect 4 Side Effect 5
Xanax Anxiety Drowsiness
/ Sleep (291) Abnormally High (76) Addictive Behavior (66) Blackout (13) Withdrawal (9)
Adderall ADHD Emotions
(122) Addictive Behavior (29) Insomnia (26)
Tired (17) Binge eating (16) Ibuprofen Fever, Headache/Pa in Emotions (169) Drowsiness / Sleep (126) Binge Eating Disorder (17) Abnormall y High (16) Allergic Reaction (14)
Melatonin Insomnia Emotions
(89) Nightmares (25) Binge Eating Disorder (21) Weight Loss (11) Anxiety (7)
Benadryl Allergy Drowsiness
(107)
Tired (23) Dry Throat
(13)
Nausea (3) Dizziness
(2)
Vyvanse ADHD Emotions
(25) Abnormally High (12) Weight Loss (6) Short Breath (6) Chest Pain (2)
Gabapentin Seizure/ Pain Emotions
(6) Insomnia (5) Hot flushes (2) Confusion (2) Dryness (1)
The predicted tweets based on the training dataset were geared more towards false positive, as missing side effects were considered more detrimental than over reporting. MetaMap also had problems in extracting side effects due to catching all medical terms, thus requiring the filter of the semantic groups.
Another problem with MetaMap was side effects not caused by the drug within the tweet were also extracted along with the actual drug-caused side effect. We had to manually examine the side effects extracted by MetaMap to remove non-caused side effects. We discussed these in the subsection Challenges and Limitations.
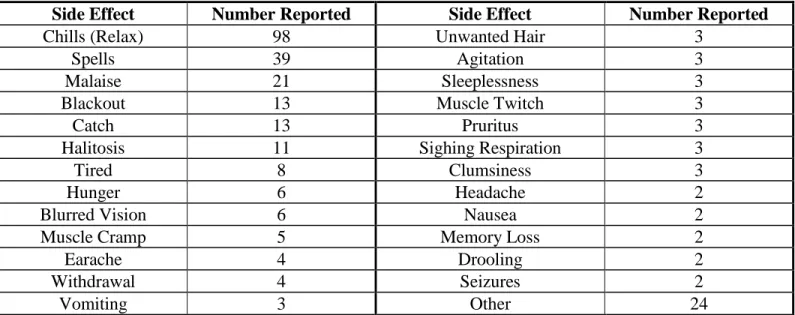
In Table 6, we examined Xanax, the drug with the most reports out of the predicted. Within the semantic group “Disorder” (referring to Table 1), Table 6 shows all side effects in the subcategory “Sign or Symptom,” including side effects that Xanax is suppose alleviate. There were other side effects in other subcategories of “Disorder” such as “Finding” or “Mental or Behavioral Dysfunction” that are not shown here, such as the side effect “Abnormally High”.
In relation to Table 5, the only side effect with the matching number of reports was “Blackout”. Other side effects were not caught under the category “Disorder”, and the side effect “withdrawal” actually had reports in multiple categories, with “Disorder” only catching four of them.
Table 6: Side Effects and Number Reported for Xanax in subcategory “Sign and Symptom” with keys for reference
Side Effect Number Reported Side Effect Number Reported
Chills (Relax) 98 Unwanted Hair 3
Spells 39 Agitation 3
Malaise 21 Sleeplessness 3
Blackout 13 Muscle Twitch 3
Catch 13 Pruritus 3
Halitosis 11 Sighing Respiration 3
Tired 8 Clumsiness 3
Hunger 6 Headache 2
Blurred Vision 6 Nausea 2
Muscle Cramp 5 Memory Loss 2
Earache 4 Drooling 2
Withdrawal 4 Seizures 2
Vomiting 3 Other 24
The reported frequencies of side effects included both those caused by Xanax as well as side effects caught in the tweet that were not caused by the drug. For example, the side effect for relaxation “chills” was caused by Xanax despite not being a negative side effect, but the side effect was mentioned with an actual negative side effect in the same tweet. “Chills” in the tweets was considered a positive side effect, as people who take Xanax are using it to relax without anxiety, but Metamap in this case caught this side effect as well. Thus, both side effects were extracted. These are also discussed in the subsection Challenges and Limitations.
Our pipeline was able to output the frequency of drug-caused side effects for all 462 drugs, such as with Xanax, showing both commonly and uncommonly reported side effects, which can be compared with Xanax’s known side effects from medical sources [1][14].
5.4
Challenges and Limitations
There have been challenges and limitations to our pipelines concerning the extraction of drug-caused side effects.
First, all of the subcategories for the MetaMap group “Disorder” had to be used, as leaving out any subcategories might cause side effects to be missed.
Secondly, MetaMap extracts all side effects from the tweets, both those caused and those not caused by the drug, thus also requiring manual examination to identify the drug-caused side effect. However, an external dataset containing all possible side effects that are alleviated by the drug can be used to remove some of these extra non-caused side effects.
For example, “Chills”, the most reported side effect of Xanax, in context means “to relax” but to MetaMap, the concept means “shivers”. Thus, extracting negative side effects of the drugs required both reducing by MetaMap category as well as by manual examination, in order to correctly identify which side effects were negative. Furthermore, each tweet usually contained more than one side effect besides the negative side effect caused by the drug, requiring further manual examination to determine which side effect within the tweet is the one caused by the drug.
Other complications include tweets with multiple drugs, as associating the side effect with the correct drug(s) requires manual examination as well in this case. These lead to preliminary work on the next steps.
CHAPTER 6.
Next Steps: Applications of Drug Side Effect
Frequency Analysis
Using the frequency extracted from the proposed pipeline, one can make some observations on the most common side effects as well as rare side effects reported. One can also observe the side effects that may be caused by two or more drugs taken together; some may be side effects caused by rare drug pairs that might be potentially dangerous. Some preliminary studies and observations are reported below.
6.1
Most Frequently Reported Side Effects
The top three side effects were drowsiness/tiredness, emotions, and being abnormally high. “Drowsiness”
is considered a mild side effect that affects most people, thus being commonly reported. People who have reported being emotional can be inferred as being more likely to share their emotions on Twitter, which is probably the cause of large number of reports. Finally, “abnormally high,” was largely reported because of the large number of tweets related to drugs that cause this side effect, most notably Xanax and other drugs used for anxiety.
An example of a rare side effect that was less reported but was seen in all the top 10 drugs was nausea. Benadryl had two reports of nausea, which were reports that would be forwarded to the FAERS [1].
6.2
Side Effects Caused by More Than One Drug
Next, we looked at the predicted tweets where more than one drug was used. Having multiple drugs makes it hard to correctly identify which side effect is caused by which drug. Out of the predicted tweets, 2678 contained more than one drug. Table 7 lists the top six drugs that were mentioned most out of these tweets containing two or more drugs:
Table 7: List of Top 5 Drugs mentioned with Other Drugs in a Tweet
Drug Tweet
s
Side Effect 1 Side Effect 2
Tylenol 274 Emotions (6) Drowsiness
(3)
Xanax 203 Addiction (4) Drowsiness
(4)
Ibuprofen 196 Drowsiness
(4)
Allergic (2)
Adderall 50 Addiction (3) High (2)
Benadryl 99 Drowsiness
(12)
Most of the tweets with multiple drugs did not specify which of the drugs-caused the side effect. Also, some of the tweets focused on one of the drugs not working or causing a side effect that required the second drug (or even third) to solve their problem.
6.3
Side Effects Caused by Most Popular Drug Pairs
As shown in Table 8, most of the tweets with multiple drugs focused on competing drugs. Ibuprofen, also known as Advil or Motrin, competes with acetaminophen (Tylenol) for relieving pain and headaches. The “emotions” side effect related mostly to anger caused by the ineffectiveness of Ibuprofen or Tylenol at alleviating the pain.
Table 8: List of top 5 most mentioned drug pairs
Drug Pair Tweets Side Effect
Ibuprofen, Tylenol 131 Emotions (2) Adderall, Vyvanse 54 Insomnia (2)
Adderall, Xanax 36 Insomnia (2)
Mucinex, Tylenol 25 Drowsiness (2) Benadryl, Melatonin 23 Drowsiness (4)
Another pair of drugs, Adderall and Vyvanse, used for attention deficit hyperactivity disorder (ADHD), unfortunately caused insomnia, as the drugs providing focus also stopped the users from sleeping. Same conclusion can be made for Adderall (for ADHD) and Xanax (for anxiety), which caused insomnia on those patients who really need to sleep as well.
Finally, another example, Benadryl and Melatonin, had the same common side effect of drowsiness, as people who took Benadryl, used to relieve allergies, usually became drowsy, and they wanted an extra Melatonin, used as a sleeping pill, for extra effect to fall asleep at night. Without manual examination, it would have been hard to figure out if the side effect was caused by multiple or just one of the drugs in the tweet, and this is something that future works might improve on.
6.4
Potential Danger: Side Effects Associated with Uncommon Drug Pairs
Lastly, we took a look at side effects that were rare and not usually associated with a certain drug, due to taking a combination of drugs. As seen in Table 9, we took 3 different pairs that had side effects that were considered rare for the drugs, as the side effect was uncommon in each case that the pair of drugs were taken together.Table 9: Side Effects of drug pairs not commonly associated with either drug
12 Side Effect Side
Effect Count
Adderall, Benadryl
Drowsiness 2
Tylenol, Ativan Abnormally
High
1
Klonopin, Zoloft Emotions 1
As the first example, a user took Klonopin to treat his anxiety but at the same time caused him to feel depression. He then took Zoloft for the depression, and instead began to feel emotional, as shown in the tweet:
“yeah klonopin make it so my depression be way more evident but when I try take zoloft w/ it f*** me and make me manic so idk”
Trying to treat both depression and anxiety with this drug pair made him feel “manic” and crazy.
In another pair, Tylenol (used for headaches) and Ativan (used to treat seizures) caused the user to feel “high”, which is an uncommon side effect for both drugs, as shown in the tweet:
“so apparently mixing tylenol and ativan makes you extremely high”
In the last example, Adderall is used to treat ADHD and is used for focus, but Benadryl made the user fall asleep instead of remaining focused. The tweet, shown below, shows the user saying that the user became drowsy, favoring the side effect of Benadryl (sleepy) instead of Adderall (insomnia, focused):
“felt a stuffy so I took a benadryl with my coffee and adderall. I’ll be fallin asleep and an inch from death today”
From the above examples, we see that finding uncommon side effects from a combination of drugs is important and can be expanded on further in the future.
CHAPTER 7.
Conclusion and Future Work
Mining the frequency of adverse drug side effects is important for finding side effects that are more common as well as those that are rare but potentially dangerous. In this work, we have improved on previous pipelines for extracting drug side effects from Twitter. A pipeline was created to first identify tweets that contained drug-caused side effects followed by extracting the frequency of those side effects. We have increased the accuracy of the classifier compared to previous works. We have also implemented the pipeline in Apache Spark to improve the speed of extraction as well as for processing large datasets.
As a next-step research, we have also presented a preliminary study of application of frequency analysis of drug side effects. It is clear that more studies would be beneficial for finding side effects of concurrently taking two or more drugs, and the proposed Apache Spark-based pipeline may further contribute in this direction.
We have also described challenges and limitations of the experiments and analysis. Work may be extended to address and overcome these challenges and limitations by involving domain experts and improving the machine learning methods.
In addition, the following may be applied on technically improving the proposed pipelines and experiments. First, have the pipeline be fed live-streams, allowing for constant updates on drug side-effects over a certain time period. Next, implementation of our Scikit Learn ensemble classifier in Apache Spark (currently unsupported) can be done to take advantage of distributed processing with the majority vote classifier. More nodes can be added to Apache Spark to speed up the pipeline even further. Also, more tweets with different drug names can be added to the training dataset because those tweets would contain even more different side effects to further improve on our classifier accuracy. Furthermore, for the side effects, a dictionary can be made to remove side effects that are alleviated by the drug instead of being marked as caused by the drug. Tweets with multiple drugs can also be tested specifically to see that the side effect corresponds to the correct drug. Finally, the frequency output of the pipeline can be used to compare with FAERS to see if there are any common side effects that have not been reported to the FDA.
References
[1] FDA Adverse Event Reporting System (FAERS). Last Retrieved on December 15th, 2016 from
http://www.fda.gov/Drugs/GuidanceComplianceRegulatoryInformation/Surveillance/AdverseDrugEffec ts/default.htm
[2] L. Wu, T.-S. Moh, and N. Khuri, "Twitter Opinion Mining for Adverse Drug Reactions", Proceedings of the 2015 IEEE International Conference on Big Data (BigData), Santa Clara, California, Oct. 2015, pp.1570-1574.
[3] F. Yu, M. Moh and T. S. Moh, "Towards Extracting Drug-Effect Relation from Twitter: A Supervised Learning Approach," 2016 IEEE 2nd International Conference on Big Data Security on Cloud (BigDataSecurity), IEEE International Conference on High Performance and Smart Computing (HPSC), and IEEE International Conference on Intelligent Data and Security (IDS), New York, NY, 2016, pp. 339-344.
[4] Y. Peng, M. Moh, and T. Moh, "Efficient Adverse Drug Event Extraction Using Twitter Sentiment Analysis," Proceedings of the 8th IEEE/ACM International Conference on Advances in Social Networks Analysis and Mining (ASONAM), San Francisco, California, Aug. 2016, pp. 1101-1018.
[5] K. Jiang, Y. Zheng, "Mining Twitter Data for Potential Drug Effects" in Advanced Data Mining and Applications, Springer Berlin Heidelberg, pp. 434-443, 2013.
[6] A. Agarwal, B. Xie, I. Vovsha, O. Rambow, and R. Passonneau. 2011. Sentiment analysis of Twitter data. In Proceedings of the Workshop on Languages in Social Media (LSM '11). Association for Computational Linguistics, Stroudsburg, PA, USA, 30-38.
[7] D. Bates, D. Cullen, N. Laird, L. Petersen, S. Small, D. Servi et al. “Incidence of Adverse Drug Events and Potential Adverse Drug Events Implications for Prevention”. JAMA. 1995;274(1):29-34.
[8] R. Banerjee, I. V. Ramakrishnan, M. Henry and M. Perciavalle, "Patient Centered Identification, Attribution, and Ranking of Adverse Drug Events," 2015 International Conference on Healthcare Informatics, Dallas, TX, 2015, pp. 18-27.
[9] M. Zaharia, M. Chowdhury, T. Das, A. Dave, J. Ma, M. McCauley, M. J. Franklin, S. Shenker, I. Stoica, “Resilient Distributed Datasets: A Fault-Tolerant Abstraction for In-Memory Cluster Computing”.
NSDI 2012. April 2012.
[10] A. R. Aronson. “Effective mapping of biomedical text to the UMLS Metathesaurus: the MetaMap
[11] W. B. Cavnar, and J. M. Trenkle, “N-Gram-Based Text Categorization”, in Proceedings of SDAIR-94, 3rd Annual Symposium on Document Analysis and Information Retrieval, Las Vegas, NV, pp. 161-175, 1994.
[12] D. Harnie, A.E. Vapirev, J.K. Wegner, A. Gedich, M. Steijaert; R. Wuyts, W.D. Meuter, "Scaling Machine Learning for Target Prediction in Drug Discovery using Apache Spark," 2015 15th IEEE/ACM International Symposium on Cluster, Cloud and Grid Computing, Shenzhen, 2015, pp. 871-879.
[13] Tweepy (An easy-to-use Python library for accessing the Twitter API). Last Retrieved on December
15, 2016 from http://www.tweepy.org
[14] “Popular Drugs” from Drug Index A to Z. Last Retrieved on December 14, 2016 from
https://www.drugs.com/drug_information.html
[15] NLTK (Nature Language Tool Kit). Last Retrieved on December 15, 2016 from www.nltk.org
[16] Stefano Baccianella, Andrea Esuli, and Fabrizio Sebastiani. "SENTIWORDNET 3.0: An Enhanced
Lexical Resource for Sentiment Analysis and Opinion Mining". LREC Conference, 2015.
[17] K. Toutanova, D. Klein, C.D. Manning, and Y. Singer, “Feature-rich part-of-speech tagging with a
cyclic dependency network”. In Proceedings of the 2003 Conference of the North American Chapter of the Association for Computational Linguistics on Human Language Technology - Volume 1 (NAACL '03), Vol. 1. Association for Computational Linguistics, Stroudsburg, PA, USA, 173-180. 2003.
[18] Finn Årup Nielsen. "A new ANEW: Evaluation of a word list for sentiment analysis in microblogs",
Proceedings of the ESWC2011 Workshop on 'Making Sense of Microposts': Big things come in small packages 718 in CEUR Workshop Proceedings, pp. 93-98. May 2011.
[19] Lingjia Deng and Janyce Wiebe (2015). “MPQA 3.0: An Entity/Event-Level Sentiment Corpus”.
NAACL-HLT, 2015.
[20] B. Liu. “Sentiment Analysis: mining opinions, sentiments, and emotions”. Cambridge University Press, 2015. Last Retrieved on December 21, 2016 from https://www.cs.uic.edu/~liub/FBS/sentiment-analysis.html
[21] N. Tabassum and T. Ahmed, "A theoretical study on classifier ensemble methods and its applications," 2016 3rd International Conference on Computing for Sustainable Global Development (INDIACom), New Delhi, 2016, pp. 374-378.
[22] Bodenreider, Olivier; Hole, William T.; Humphreys, Betsy, L.; Roth, Laura, A.; Srinivasan, Suresh. "Customizing the UMLS Metathesaurus for your Applications". Proc AMIA Symposium. Nov. 2002.
[23] F. Pedregosa, G. Varoquaux, A. Gramfort, V. Michel, B. Thirion, O. Grisel et al. "Scikit-learn: Machine Learning in Python", JMLR 12, pp. 2825-2830, 2011.
[24] X. Meng, J. Bradley, B. Yavuz, E. Sparks, S. Venkataraman, D. Liu et al. "MLlib: Machine Learning in Apache Spark", J. Mach. Learn. Res. 17, 1 (January 2016),1235-1241. 2016.
[25] Pyspark (Spark Python API). Last Retrieved on December 21, 2016 from
http://spark.apache.org/docs/latest/api/python/index.html
[26] C. Burges. "A Tutorial on Support Vector Machines for Pattern Recognition". Data Mining and Knowledge Discovery 2, pp. 121-167, 1998.