Ž .
Journal of Operations Management 17 1999 163–178
Manufacturing flexibility: methods for measuring the impact of
product variety on performance in process industries
William L. Berry
a,), Martha C. Cooper
ba
Operations Management, The Ohio State UniÕersity, Faculty of Management Sciences, College of Business Administration, Columbus, OH 43210, USA
b
Marketing and Logistics, The Ohio State UniÕersity, Faculty of Marketing, College of Business Administration, Columbus, OH 43210, USA
Received 30 April 1997; accepted 31 December 1997
Abstract
Product variety is often assumed to yield competitive advantage by offering products or services tailored to specific market segments. This strategy should result in more total sales volume or higher prices, and presumed profit, gained by meeting more specialized demands. However, achieving competitive advantage through increased product variety is heavily dependent on the proper alignment of the marketing and manufacturing strategies. This paper shows that adding product variety can have adverse cost and margin implications when marketing and manufacturing strategies are mis-aligned. The critical strategic issues involve product pricing and manufacturing flexibility in product mix. We report methods that can be used to measure product mix flexibility and manufacturing performance in terms of costs and margins based on actual orders and production data. Such methods provide a means of empirically diagnosing the degree of strategic mis-match using actual operating data. These methods are general in nature, and have been tested in field research on high volume batch processes that are representative of many firms in process industries. The results show that gaining competitive advantage through increased product variety requires a clear understanding of the process choice required to support the contemplated range of product volumes, and the cost and profitability trade-offs involved.q1999 Elsevier Science B.V. All rights reserved. Keywords: Manufacturing strategy; Marketingrmanufacturing interface; Process industries; Interdisciplinary
1. Introduction
Marketing managers, through strategies such as market segmentation and niche marketing, often sug-gest an increase in product variety and range to satisfy specific groups of customers’ needs or wants. These can involve differences in product features,
)
Corresponding author. Tel.:q1-614-292-1275; fax:q 1-614-292-1272.
packaging, or channels of distribution. Further, im-portant consideration is being given to ‘mass cus-tomization’ strategies in many companies today ŽPine, 1993; Kotha, 1995; McLaughlin and Victor,
.
1995 . Additional impetus is coming from mass mer-chandisers expecting deliveries in small quantities directly to stores with extremely high service levels, specialized packaging, and unique promotion
combi-Ž .
nations McDermott and O’Connor, 1995 . These strategies should result in sales growth or higher prices, and presumed profit, gained by meeting more 0272-6963r99r$ - see front matterq1999 Elsevier Science B.V. All rights reserved.
Ž .
specialized demands. However, such decisions can have adverse implications for manufacturing and dis-tribution systems that are not always captured in cost, margin and non-financial performance esti-mates for such strategies.
There is increasing evidence that achieving com-petitive advantage through increased product variety is heavily dependent on ensuring the proper align-ment between the marketing and manufacturing
Ž
strategies pursued by a company Richardson et al., .
1985; Leschke, 1995; Safizadeh et al., 1996 . Failure to align marketing and manufacturing strategies in terms of product pricing and manufacturing flexibil-ity in product mix can have serious financial conse-quences. What is not well-understood is how to determine whether a mis-match in strategy alignment will prevent a strategy of increased product variety from producing a sustained competitive advantage in terms of market share, sales growth and profitability. This research presents general methods to empiri-cally diagnose the degree of mis-match using a sample of company data. These methods are applica-ble in a wide variety of industries, and have been applied by the authors in such diverse industries as fiber glass, packaging materials, apparel, and furni-ture manufacturing. Our approach is to measure the cost and contribution margin per unit implications of strategic decisions regarding increased product vari-ety.1 The results of field research are reported to
test these methods and to demonstrate the major shortfalls in profitability which can occur when product pricing and manufacturing flexibility strate-gies are mis-aligned. The objectives of this research are to:
Ø provide a conceptual framework for
understand-ing the pricunderstand-ing and process choice issues in ad-dressing a marketing and manufacturing strategy of increased product variety,
Ø provide methods for examining the costs of adding
product variety in manufacturing so that compa-nies can make more informed strategic decisions concerning product variety,
1
Contribution marginrunit equals net price less variable cost divided by scarce resource unit time. This approach is consistent with recent work concerning Activity-Based Costing and the
Ž .
Theory of Constraints Spoede, 1996; Campbell et al., 1997 .
Ø field test these methods by examining in depth
the cost structure of a company that is addressing the issue of increased product variety.
2. Product variety—a strategic issue
There is an emerging literature concerning manu-facturing flexibility that is directly related to the mis-alignment issue in supporting increased product variety. Although numerous dimensions of manufac-turing flexibility have been defined, the work con-cerning product mix flexibility specifically relates to
Ž .
this research Chen et al., 1992; Gerwin, 1993 . Here product mix flexibility is defined as the capability of producing a number of product lines andror
numer-Ž .
ous variations within a line Gerwin, 1993 . It repre-sents the ability to produce a broad range of products or variants with presumed low changeover costs.
While substantial efforts have been made to de-fine manufacturing flexibility in conceptual terms, a Ž . number of unexplored issues remain. Gerwin 1993 points to the need to show manufacturing managers how to evaluate and change the flexibility of their operations since little attention has been paid to developing procedures that fill this need. Further, he argues that special attention should be devoted to applied research on manufacturing flexibility since this area is not well-developed. Finally, Gerwin Ž1993 suggests that the need to develop operational. measures of manufacturing flexibility and its value represent a critical research priority.
Ž . Related work by Ramasesh and Jayakumar 1991
Ž .
and Watts et al. 1993 addresses the measurement of manufacturing flexibility. Research by Chen et al. Ž1992. explores the impact of the manufacturing flexibility provided by recent evolving computer and process technology including CAD, CAM, CAPP, FMSs, etc., upon the manufacturingrmarketing
in-terface within the new competitive environment. Other research in manufacturing strategy has been concerned with determining the value of
manufactur-Ž . ing flexibility. Swamidass and Newell 1987 report the results of an executive survey in the machinery and machine tools industries which indicate that manufacturing flexibility seems to contribute com-petitive advantage to a manufacturer regardless of the manufacturing process used. However, research
Ž .
exam-( )
W.L. Berry, M.C. CooperrJournal of Operations Management 17 1999 163–178 165 ples that question the value of manufacturing
flexi-bility for all processes. Instead, they argue that com-panies need to understand the exact level and type of Ž . flexibility that is required. Jordan and Graves 1995 report methods for determining the benefits of im-proving the manufacturing flexibility required to build different types of products in the same plant or production facility at the same time.
3. Impact of mis-alignment of strategies to sup-port increased variety
Ž .
The experience of Plastech Leschke, 1995 illus-trates the drastic reduction in profitability that can result from the introduction of increased product variety without appropriate changes in manufactur-ing strategy and investment. When faced with a loss of major sales contracts, Plastech obtained a 20% increase in sales revenue by implementing a market-ing strategy to increase product variety. As a conse-quence, batch sizes decreased by 50% and profits shrank by 83%. The costs associated with the firm’s high volume batch process could not maintain profits for the wide range of small volume products offered. Without new investment, the firm’s high volume
Ž batch process, having large changeover times and
.
costs , could not support the product mix flexibility needed to cope with the increased product variety required in the new markets targeted by the com-pany.
Other examples of mis-alignment issues in sup-porting a strategy of increased product variety have been reported in the literature. Some large mass retailers are recognizing this issue and ordering fewer product sizes and brands to achieve lower costs ŽSchiller et al., 1992 . Toyota’s Shatai subsidiary. reports that recent efforts to increase product variety in its Inabe plant have cut into productivity, requir-ing much more time to clean up paint lines and
Ž .
change tools Moran, 1996 . Recent research on mass customization in service industries notes the frequent lack of careful analysis of the investment required to support increased product variety
strate-Ž
gies, resulting in excess costs McLaughlin and Vic-.
tor, 1995 .
Such examples illustrate that the ‘flexible is free’ arguments in the literature do not always apply,
particularly under high volume batch process set-Ž .
tings. Suarez et al. 1996 report an empirical study of manufacturing flexibility in printed circuit board assembly plants in which they conclude that ‘‘achieving high-mix flexibility does not seem to involve a cost or quality penalty’’. Likewise, Kekre
Ž .
and Srinivasan 1990 report an empirical study us-ing the PIMS data base in which they report ‘‘the lack of any strong negative effect of broadening product line on operations’’. Further, they note that ‘‘in industrial markets, product line breadth has a small but significant favorable impact on direct costs and manufacturing costs’’, and ‘‘in consumer mar-kets too, product line breadth does not have any direct impact on both relative costs and total inven-tory’’.
Both of the previous studies used highly aggre-Ž .
gated plant data. Suarez et al. 1996 discuss the problem of company data confidentiality. They note that they were unable to obtain a detailed account of each plant’s cost structure, and had to use a
com-Ž
monly reported aggregate industry measure unit cost .
per component placed . The use of highly aggregated data can obscure the effect of sources of variation such as production run length on manufacturing cost. Furthermore, these studies do not identify the pro-cess choice decisions made in these plants, nor any investments in low volume batch processes that may have been made to support increased product variety. Neither do they address the degree of the price sensitivity in these markets, nor the ability of the companies to capture a price premium for added product variety.
Therefore, in order to show the effect of mis-alignment induced by increased product variety, we have taken a different approach in our analysis of product variety and manufacturing performance by developing a framework and general methodology to analyze a plant’s cost structure, using actual operat-ing data.
4. Strategic framework for increased product va-riety
This paper examines the process choice and pric-ing implications of manufacturpric-ing and marketpric-ing
decisions to increase product variety.2 In shifting to a marketing strategy that targets low volumerhigh
variety segments, it is often incorrectly assumed that the process choice for low volume products is the same as that for high volume products. The case of
Ž .
Plastech illustrates this point Leschke, 1995 . We are concerned with identifying the costs of increased product variety which result from mis-aligned pro-cess choice decisions, and the resulting impact on profits.
Ž .
Early work by Blois 1980 provides the basis for a conceptual framework to understand the strategic issues concerning manufacturing flexibility. Blois Ž1980. proposed a Policy Interaction Grid which integrates product, manufacturing, and marketing policies. This framework is directly related to the issue of product variety as the three dimensions in
Ž
the policy grid include: product type customr
stan-. Ž
dard products , product volume small batchrvolume
. Ž
manufacturing , and marketing strategy customr
. mass marketing .
Ž .
Further, Blois 1980 indicates the need for inter-nal information concerning a firm’s process cost, capacity and delivery capabilities in order to achieve a marketingrmanufacturing orientation. Such
infor-mation includes customer and market profitability analyses, and cost estimates of supplying products in
Ž
various volumes including those outside the normal .
range . The contemporary work on Activity-Based Costing to determine cost drivers, and the Theory of Constraints to identify process bottlenecks and their impact on product profitability provides an excellent
Ž framework for contribution margin analysis Spoede,
.
1996; Campbell et al., 1997 . Such an approach ensures that marketing strategies are developed which take into account the organization’s capabilities and their customers’ contributions to profitability as dis-tinct from their contributions to revenue.3
2
Conceptual frameworks for making process choice decisions
Ž .
have been reported by Hill 1992 and Hayes and Wheelwright
Ž1984 . Safizadeh et al. 1996 report an empirical analysis of the. Ž .
product-process matrix indicating the adverse performance im-pacts of a mis-match between product plans and process choices.
3
Ž .
Eliashberg and Steinberg 1987 surveyed joint decision-mak-ing categories and concluded that there must be a concurrent analysis of manufacturing costs and marketing benefits in product mix decisions.
Ž . We have extended the work of Blois 1980 by developing a framework in which the alignment of marketing and manufacturing strategies can be viewed when increased product variety is proposed. Two dimensions are critical in the strategic decision to increase product variety: the characteristics of buyer behavior measured in terms of price sensitivity for the targeted market segments, and the current process choice decisions in manufacturing. These dimensions, shown in Fig. 1, were motivated by the arguments of Blois concerning the critical role of pricing and the creation of value to the customer from more customized products.
The vertical dimension characterizes the degree of price sensitivity in the market segments targeted for increased product variety. The low market price sensitivity position represents segments in which customers are willing to pay a price premium for added product variety. This is caused by factors such as the value of the brand image, or the value of customized product features to the customer. The high market price sensitivity position represents mar-ket segments where it is difficult to obtain a price premium for product variety. This distinction in buyer behavior is critical in manufacturing because of the impact of pricing on profit margins.
The horizontal dimension characterizes the cur-rent and required investments in manufacturing ca-pacity. While a number of process choice options are
Ž
available, e.g., jobbing, batch, and line Hayes and .
Wheelwright, 1984; Hill, 1992 , this research is
( )
W.L. Berry, M.C. CooperrJournal of Operations Management 17 1999 163–178 167 cused on batch manufacturing because of its
preva-lence in industry. The distinction between high and low volume batch processes is critical because of the important differences in capability and investment between these processes.
Typically, low volume batch processes are de-signed with features such as low changeover times and costs with high employee skill requirements that provide the flexibility needed to support a product variety strategy. High volume processes are normally designed with features such as short unit processing times, extensive process monitoring systems, and low employee skill requirements that enable low product costs to be achieved. Because of these differ-ences in process design, significant investments in process and infrastructure are typically needed to shift the process choice from high to low volume batch and vice versa.
The framework shown in Fig. 1 suggests that a company contemplating a marketing strategy of
in-creased product variety can face one of four possible
Ž . general situations. In only one case, labeled 1 , are the marketing and manufacturing strategies aligned.
Ž .
In case 1 , the products can be priced to provide attractive margins, and the current process choice Žinvestment. is low volume batch. This process choice provides the flexibility to economically pro-duce a wide variety of low volume products in small batches. This case clearly provides an opportunity to gain competitive advantage through a strategy of increased product variety.
A mis-match between the marketing and manufac-turing strategies occurs in all other cases, requiring
Ž .
resolution between the functions. Case 4 presents the most difficult challenge to the business because an increase in product variety is often achieved through low volume products. In this case, although the new products may have the advantage of retain-ing existretain-ing customers, or producretain-ing new sales growth, the customers are price-sensitive and it is difficult to capture margin through pricing increases for such products. The pressure by mega-retailers to reduce price and to make small quantity deliveries directly to stores is such an example. Although the current high volume batch process can physically produce the products, it is difficult to maintain prof-its in producing low volume products for price sensi-tive markets using those processes because of the
changeover costs involved as illustrated in the
Plas-Ž .
tech case Leschke, 1995 . Ž . Ž . Ž .
Cases 2 , 3 , and 4 in Fig. 1 are illustrative of product variety situations requiring strategic resolu-tion using both marketing and manufacturing per-spectives. As is illustrated by the examples reported
Ž . Ž . Ž .
by Hill 1992 , Leschke 1995 , and Moran 1996 , Ž .
case 4 appears to be increasingly prevalent in practice as the pressure for the ‘mass customization’ of products increases. This framework is intended to help executives better articulate the actual flexibility of existing processes relative to market requirements. It focuses on the pricing and process choice issues in making strategic decisions concerning increased product variety. It clarifies the areas where: joint strategy resolution is required, business trade-offs are involved, and new process investments may be needed to support increased requirements for manu-facturing flexibility. The opportunity for gaining competitive advantage through increased product va-riety depends on the joint resolution of these issues ŽHill, 1992; Karmarkar, 1996 ..
5. Field research
The purpose of this research is to conduct an exploratory field test of the proposed framework and methodology. This involves the collection of actual operating data in order to construct a process prof-itability analysis, using statistical methods. The re-search is designed to test investigative techniques for determining the degree of alignment between mar-keting and manufacturing strategies in supporting increased product variety. Here we measure the rela-tionship between contribution margin per scarce re-source hour and production order size in order to test the degree of alignment between pricing and process choice strategies.
It is often assumed that the production of low volume products in batch processes is simply a matter of dealing with an increase in the number of changeovers. However, in many industrial processes, there are complex cost relationships dealing with changeover, process yields, and differences in run time productivity that can depend on product vol-ume. We show that data measuring such
relation-ships can be obtained through special process stud-ies, and these data can be used with the conceptual framework proposed in Fig. 1 to improve strategic debate concerning investments in manufacturing flexibility.
Previous research has demonstrated how invest-ments in manufacturing flexibility can be made to support increased product variety, using computer and information technology in metalworking and assembly processes, e.g., with flexible manufacturing
Ž . Ž .
systems FMS Chen et al., 1992 . Further examples include Levi Strauss and Company make-to-order
Ž jeans which permit custom-fitted products Goldhar
.
and Lei, 1995 , and Ingersoll Milling Machine Com-pany use of a computer controlled manufacturing system to machine thousands of different prismatic
Ž .
parts in lot sizes of one Goldhar and Lei, 1995 . This research extends the previous research in two ways. First, it tests general methods for examining the performance implications of increased product variety faced by executives. Second, it broadens the range of industries previously studied by applying these methods to the process industry. The methods proposed here were motivated by early pilot results which we obtained in manufacturing strategy analy-ses conducted in such diverse industries as fiber glass, packaging materials, apparel and furniture manufacturing.
The methods were tested in a process industry firm which is experiencing profit issues dealing with increased product variety, and which was willing to provide an extensive data base of operating data for the analysis. This company was selected because it provided an opportunity to conduct this research in a different type of industry than the metalworking and assembly manufacturing firms studied in previous
Ž
research Ramasesh and Jayakumar, 1991; Chen et .
al., 1992; Goldhar and Lei, 1995 .
6. Company background
During the past 10 years, the company studied has introduced a large number of new products, and the total number of products has increased by a factor of six times. During the same period, no new invest-ments were made to the firm’s existing high volume batch processes. This company is a leading chemical
manufacturer with annual sales exceeding one billion dollars. Its branded products are sold in both con-sumer and industrial markets through a variety of channels, including mass merchandisers, independent retailers, and manufacturers’ representatives. In the portion of the business studied, it sells over 500 standard and special products in highly competitive markets which are characterized by substantial fluc-tuations in seasonal demand.
The product structure has four levels, consisting Ž . of packaged products, end product formulas blends , manufactured chemicals, and purchased ingredients. Each family of packaged products is produced on a 7 day per week, high volume linked batch process which has three processing units: chemical manufac-turing, formula blending, and packaging. Inventory is held for finished packaged products, and for raw material ingredients. Very little work-process in-ventory is held since materials are moved automati-cally in a linked batch process from chemical manu-facturing to formula blending, and finally to packag-ing. Because demand exceeds the process capacity during the peak season, anticipation stock is held in finished goods inventory.
Formula blending is the bottleneck processing unit in this company. Its capacity is relatively expen-sive, the changeovers are longer than those for chem-ical manufacturing and packaging, and the blending changeovers are sequence dependent. In this com-pany, blending changeover times are approximately 6 h, varying from 1 to 30 h. These changeovers involve substantial process cleanout time to avoid product contamination as well as the time needed to change ingredient materials and to adjust process control settings. Small changeover times are often explained by sequence dependencies, i.e., scheduling similar product blending orders in a sequence; thereby reducing process changeover time. The batch run time for production orders is approximately 70 h, and can vary from 4 to 210 h.
7. Hypotheses
Five hypotheses were tested using regression models to develop the process profitability analysis in the field research company. These hypotheses concern the effects on product yield, cost and
contri-( )
W.L. Berry, M.C. CooperrJournal of Operations Management 17 1999 163–178 169 bution margin of running low volumerhigh variety
products on this firm’s high volume batch processes. The hypotheses were developed for the purpose of applying the process profitability methodology in the research company, and the specific results would not necessarily apply to all companies.
H1: Product yield and batch size are not related. H1A: Product yield decreases as batch size decreases.
Ž
H2: Process run time productivity measured in .
terms of outputrrun time hour is not related to
batch size.
Ž
H2A: Process run time productivity measured .
in terms of outputrrun time hour decreases as
batch size decreases. Ž
H3: Process productivity measured in terms of .
outputrchangeover and run time is not related to
batch size.
Ž
H3A: Process productivity measured in terms .
of outputrchangeover and run time decreases
as batch size decreases. Ž
H4: Total process productivity measured in terms .
of outputrtotal order processing time is not
re-lated to batch size.
Ž
H4A: Total process productivity measured in . terms of outputrtotal order processing time
decreases as batch size decreases.
H5: Contribution margin per process hour is not related to batch size.
H5A: Contribution margin per process hour de-creases as batch size declines.
8. Statistical design
To test the hypotheses, regression models were specified concerning process productivity and prod-uct yield. These models were of the form:
YsB1qB2)LN Batch Size
Ž
.
qB3)Ž
Seasonal Factor.
qB4)
Ž
Natural Cycle Factor ..
Ž .
18.1. Regression modelÕariables
Four dependent variables using three independent variables were studied in the regression analysis:
Ž .
Ø Product yield Saleable outputrtotal input in units
Ž .
Ø Saleable outputrrun time in hours
Ž
Ø Saleable outputrchangeover plus run time in
. hours
Ø Saleable outputrtotal time which consists of
Ž changeover plus run time plus downtime in
. hours .
Product yield measures the total amount of
prod-Ž .
uct in units which meets the product specifications, i.e., saleable output, in relation to the total number of units consumed for the production batch. The next three dependent variables measure process productiv-ity, i.e., output in units per process hour, considering process changeover time, run time, and down time.
These variables were selected in this company because they were thought to have the greatest im-pact on profitability in running low volumerhigh
variety products on this firm’s high volume batch processes. Clearly, in other company applications of this methodology, other variables, such as absolute production volume, might be selected if they are considered to have a major impact in processing low volumerhigh variety products. The generality of this
methodology is that it can be applied under a variety of business and process conditions.
The three independent variables studied in the regression analysis were:
Ø Production batch size
Ø Peak seasonroff-season factor
Ø Natural cycle sequence factor.
Experience with the production processes studied in this company suggests that the regression coeffi-cients would differ between peak demand and off-season operation. Further, it was thought that both productivity and product yield would be affected depending on whether the natural product sequence is followed in scheduling the sequence dependent products. Running the products in the ‘natural se-quence’ involves sequencing production batches so that the least process changeover time is incurred. The plant tries to follow these sequences unless customer priorities intervene. Dummy variables were initially included in the regression models to test the seasonal and natural cycle effects. In the case of the
natural cycle analysis, this approach was later modi-fied as discussed in Section 9.
8.2. Data collection
Actual operating data were collected for 16 prod-ucts that were considered by company executives to be representative of the types of products processed on two of the company’s high volume batch
pro-Ž .
cesses referred to as processes A and B . These products represent a wide range of sales volumes and include products which are sold in both price sensi-tive and non-price sensisensi-tive market segments as evi-denced by the marked differences observed in the unit contribution margins between segments. In the case of process A, the natural sequence is violated for approximately half of the production orders in both peak season and off-peak periods, and is a critical business issue. However, in process B, most orders are scheduled in the natural sequence since fewer end products are run in much higher volumes with production order sizes that are approximately 50% larger than those in process A.
In total, data for 95 production orders, covering a 13-month period, were collected for the products in the sample. Each production order covers the
produc-Ž . tion for a single end product formula blend which
Ž . is packaged in various product sizes SKU’s . These represent all of the production runs for the products involved during this period. The number of produc-tion ordersrmonth in the sample was relatively
con-stant in both the peak demand season and the off-peak period.
The specific data collected for each production order included: the end product type, blending for-mula, packaging specifications, raw material ingredi-ent quantities, date the production order was pro-cessed, changeover time, run time, downtime, prod-uct yield, batch size, saleable prodprod-uct quantity, vari-able processing cost, raw material cost, and selling price. Fixed overhead cost allocations were not con-sidered.
9. Regression results
Separate regression equations were developed for processes A and B using the four dependent
vari-ables and three independent varivari-ables defined above. These results are reported in Table 1. In all cases, the statistical significance level applied is alpha equals 0.05.
In the case of process A, a much more favorable level of performance was observed when the plant was scheduled to maintain the natural cycle. There-fore, the use of a dummy variable for the natural cycle factor in the original research design was modified, and two sets of regression equations were developed for process A. The first set of regression equations reflects the performance of process A when products are processed in the natural cycle sequence. The second set indicates the results when products are processed out of the natural cycle sequence.
9.1. Product yield
The results fail to reject the null hypothesis H1 for two of the three process conditions. When prod-ucts are run in the natural cycle sequence in process A, and in process B as well, changes in product yield are less than 2%. The product yields for process A are adversely affected by batch size and seasonal factor only when the products are run out of the natural cycle sequence. In the case of running out of sequence in process A, the adjusted R2 value is
0.65, the model is highly significant at 0.000, and all of the model coefficients are significant at the 0.01 level or less, rejecting H1. This is explained by the fact that when products are run out of the natural sequence, it often takes a longer time to achieve the product quality specifications during a process changeover because of process adjustments; thereby reducing product yield.
9.2. Saleable productrrun time
The results fail to reject the null hypothesis H2 for one of the three process conditions. This occurs when products are run in the natural cycle sequence in process A. Run time productivity is significantly affected by batch size in process A when products are run out of their natural cycle sequence. The regression model is highly significant at the 0.0004 level, the adjusted R2 value is 0.45, and the batch
size coefficient is significant at the 0.0004 level. This can be explained by the fact that the operators
() W.L. Berry, M.C. Cooper r Journal of Operations Management 17 1999 163 – 178 171 Table 1 Regression summary Process A Process B b c
In sequence Out of sequence Value Std. error Significance
b c b c
Value Std. error Significance Value Std. error Significance
H1: yield
Saleable outputrinput
2
Adjusted R 0.00 0.65 0.02
F valuersignificance F 0.68 0.260 22.77 0.0000) 1.65 0.1015
Ž .
LN run size : coefficient 0.005 0.016 0.350 0.17 0.03 0.0000) 0.012 0.010 0.1080
a
Seasonal coefficient y0.020 0.022 0.151 y0.16 0.06 0.0105) y0.018 0.018 0.1510
ProductiÕity
H2: Saleable outputrrun time
2
Adjusted R 0.09 0.45 0.47
F valuersignificance F 1.86 0.095 10.46 0.0004) 23.32 0.0000)
Ž .
LN run size : coefficient 2671 1951 0.095 6193 1569 0.0004) 4387 778 0.0000)
a
Seasonal coefficient y2977 2670 0.140 y3782 3173 0.1235 y3758 1405 0.0050)
H3: Saleable outputrCCqrun time
2
Adjusted R 0.36 0.55 0.53
F valuersignificance F 5.99 0.006) 14.85 0.0000) 30.11 0.0000)
Ž .
LN run size : coefficient 4635 1628 0.005) 7121 1503 0.0001) 5369 793 0.0000)
a
Seasonal coefficient y3303 2229 0.080 y4116 3039 0.0950 y3432 1433 0.0100)
H4: Saleable outputrtotal time
2
Adjusted R 0.45 0.47 0.46
F valuersignificance F 8.38 0.002) 11.12 0.0003) 22.68 0.0000)
Ž .
LN run size : coefficient 3164 1483 0.025) 4505 1293 0.0010) 4933 875 0.0000)
a
Seasonal coefficient y6295 2029 0.004) y5634 2615 0.0215) y3971 1581 0.0075)
a
1sPeak season, Osother.
b
Standard error of the regression coefficient.
c
Values represent a one-tailed test of significance. )Significant at the 0.05 level.
studied will frequently reduce process speeds when large differences in product characteristics occur be-tween successive production batches in order to in-sure product quality specifications are achieved. Fur-ther, run time productivity was not affected by sea-sonality, although the sign of the coefficient is in the expected direction.
H2 is rejected for process B. Run time productiv-ity is significantly affected by both batch size and seasonality. The regression model is highly signifi-cant at the 0.000 level, the adjusted R2 value is
0.47, and all of the regression model coefficients are significant at the 0.005 level. Larger batches result in higher productivity, and lower productivity occurs during the peak season.
( )
9.3. Saleable productr changeoÕer plus run time
H3 is rejected for the overall models and batch size. The seasonal coefficient is only significant for process B. When products are run in the natural cycle sequence in process A the regression model is significant at the 0.006 level, the adjusted R2 is
0.36, and the batch size coefficient is significant at the 0.005 level. Stronger results are observed when products are run out of the natural cycle sequence. In this case, the regression model is highly significant at the 0.000 level, the adjusted R2 is 0.55, and the
batch size coefficient is significant at the 0.0001 level.
Similar results were observed for process B. The regression model is highly significant at the 0.000 level, the adjusted R2 is 0.53, and all model coeffi-cients are significant at the 0.01 level.
9.4. Saleable outputrtotal time
H4 is rejected for the overall models and for batch size and season as well. The total time to process an order includes changeover, run time, and any non-scheduled process down time. Because of process conditions, downtime is especially prevalent during the peak season in the company studied. In this case, similar results were observed in both process A and B. When products are run in the natural cycle se-quence in process A, the model is significant at the 0.002 level, the adjusted R2 is 0.45, and the batch
size and seasonal factor are significant at the 0.025
and 0.004 levels, respectively. When products are run out of the natural cycle, the model is highly significant at the 0.0003 level, the adjusted R2 is
0.47, and all of the model coefficients are significant at the 0.022 level.
Stronger results are observed for process B. Here, the model is highly significant at the 0.000 level, the adjusted R2 is 0.46, and all of the model coefficients are significant at the 0.0075 level.
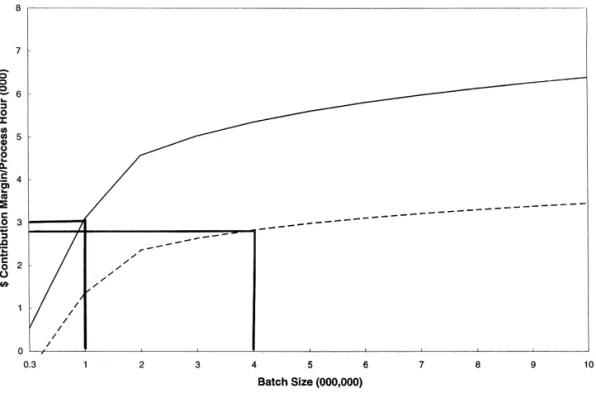
9.5. Contribution marginrprocess hour
H5 is examined by constructing contribution mar-gin curves under the theory of constraints accounting
Ž .
framework Spoede, 1996; Campbell et al., 1997 . The contribution margin per process hour curves plotted in Fig. 2 were derived using the regression models for productivity and product yield, and rele-vant variable cost factors for process A for the case when products are not run in the natural cycle
se-Ž . quence. This was accomplished using Eq. 2 . $ Contribution MarginrProcess Hour
s
Ž
pzyŽ
Õxrr.
ycx.
rŽ
xrr.
Ž .
2where 4: psunit price; zssaleable product
quan-tity; xs production batch sizes saleable
productrproduct yield; Õsvariable process
costrprocess hour 5; rsprocess productivity
Žunitsrprocess hour ; c. sraw material cost per unit.
Here the saleable product requirement was di-vided by the process yield to calculate a yield-ad-justed batch quantity, using the regression model results shown in Table 1 for process A. This quantity was then used with cost data supplied by the com-pany to calculate the unit raw material and the unit variable operating costs. Likewise, the process pro-ductivity equation shown in Table 1 for out-of-se-quence process A runs for total time was used to
4
Depending on the process analyzed, product yield and process productivity are determined by the appropriate regression model in Table 1.
5
Only costs which vary with process hours at the research company were considered in this analysis, e.g., crew labor, utili-ties, etc. No fixed or allocated costs were included in this model. This is consistent with recent work concerning Activity-Based
Ž
Costing and the Theory of Constraints Campbell et al., 1997;
.
Spoede, 1996 . In other applications of this methodology where such processing costs do not vary with process hours, this term should be omitted from the model.
( )
W.L. Berry, M.C. CooperrJournal of Operations Management 17 1999 163–178 173
Fig. 2. Process A—pricing effect.
calculate the r value in the contribution margin per Ž .
process hour function shown in Eq. 2 .
The contribution margin per process hour curves shown in Fig. 2 reflect the regression model results for process A for different pricing strategies. These curves support the direction hypothesized in H5A. Similar results would be observed if other combina-tions of the regression equacombina-tions shown in Table 1 were used to determine the contribution marginrhour
for processes A and B.
10. Discussion of the results
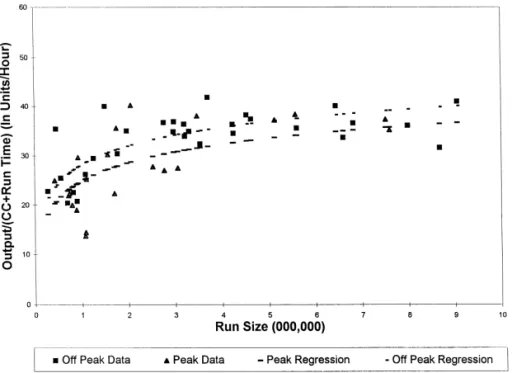
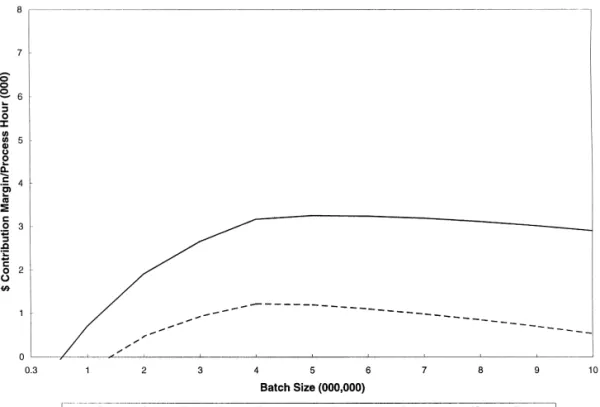
In the research company, production batch size has a major impact on productivity in all but one case for both processes. The production of small batch sizes results in a decrease in overall process productivity. This is illustrated by the results shown in Fig. 3 for process B when changeover plus run time is considered. In this case, batch sizes smaller
than 3 million units result in an important productiv-ity decline in both peak and off seasons. The produc-tivity loss for small batches is explained not only by process changeovers, but also by the loss of produc-tivity during run time. This is illustrated in Fig. 4. Slower line speeds, process adjustments, and process down time can all affect process productivity when small runs are processed. These results demonstrate the difficulty that a process designed for high vol-ume batch operation has in operating profitably un-der small batch sizes.
Likewise, the product yield results in Table 1 illustrate that the proposed methodology can indicate those process conditions where variables such as batch size do not affect manufacturing performance. For example, when products are run in the natural cycle sequence in process A, batch size does not significantly affect either product yield or run time productivity. This means that sufficient process
flexi-Ž
bility exists without adverse cost and margin ef-.
in-Ž .
Fig. 3. Process B productivity outputrCCqrun time .
creased product variety when quick customer re-sponse is not a critical factor, and products can be processed within the natural cycle.
The regression results from the research company also illustrate the utility of this methodology in
measuring the performance impact of other types of process variables. The seasonality and natural cycle results illustrate this point. In process A, running product out of the natural cycle sequence during the peak season produces a marked decline in both
Ž .
( )
W.L. Berry, M.C. CooperrJournal of Operations Management 17 1999 163–178 175 overall productivity and product yield. Such results
illustrate the lack of manufacturing flexibility in this company to run low volume products, or fill small Just-In-Time orders, on a high volume batch process. All of these results demonstrate the utility of the proposed methodology in capturing relevant cost and contribution margin information for use in strategic decisions involving pricing and process choice in high varietyrlow volume markets. In the following
discussion, we provide examples that illustrate the use of the proposed methodology in pricing and process choice decisions involving high varietyrlow
volume products. These examples indicate the impor-tance of understanding the cost and contribution margins for low volume products when a marketing strategy of high variety is contemplated.
The curves shown in Fig. 2 are plotted using an example from the field study in this research to illustrate the possible business consequences of
in-Ž .
creased product variety in case 4 of the framework shown in Fig. 1. Since the current process choice best supports the production of high volume products
in long runs, the contribution margin per process hour is substantially reduced for batch sizes smaller than 2 million units. Products involving batch sizes less than 2 million units contribute low or negative margins.
This example illustrates the manner in which this methodology can be used in the analysis of pricing strategy. Consider the case when a price premium can be obtained on the basis of value added products in particular market segments as in the situation of
Ž .
case 2 of the framework in Fig. 1. This is illus-trated by the proposed premium pricing, e.g., an increase of 40% in Fig. 2. Because of the premium pricing, the process is able to support new products having batch sizes as small as 1 million units with contribution margins approximating those at 4 mil-lion units under the alternative pricing strategy. When a price premium can be charged, the curve for case Ž .4 in Fig. 2 moves upward and is labeled case 2 .Ž . This shift in pricing strategy extends the range of
batch sizes and product Õariety that can be
sup-ported at a giÕen profit leÕel by the high Õolume
Fig. 6. Process A—inventory effect.
batch process. These two pricing strategies are used
for illustrative purposes. In practice, many different pricing strategies could be considered using the pro-posed methodology.
This example can also be used to illustrate the type of analysis which could be developed when a new process investment is proposed that would pro-vide the manufacturing flexibility needed to support a strategy of increased product variety. An example
Ž .
of this is shown for case 4 in Fig. 1. If an invest-ment in a proposed low volume batch process were made, the contribution margin per hour curve would shift upward as indicated in Fig. 5. The proposed new investment provides an increase in the range of
Ž .
production order sizes product variety that would produce a given level of profit for the company. Under the proposed process investment, batch sizes as low as 1.5 million units provide approximately the same level of contribution margin per hour as batch sizes of 4 million units in the current process; thereby
extending the range of productÕariety supported by the process.
Finally, the methodology could be extended to cover instances in which production batch sizes are run which exceed the customer order sizes. One way of incorporating this assumption in the analysis is by introducing an inventory carrying cost term in Eq. Ž .2 to reflect the creation of cycle stock.6 Fig. 6 provides an example of such analysis, assuming a 25% inventory carrying cost and annual demand of 2,000,000 units. Comparing Figs. 2 and 6, order sizes smaller than 4,000,000 units produce low con-tribution margins, and the pricing policy has a major impact on profitability. However, in this case, pro-duction batch sizes larger than 4,000,000 units are also unattractive because of the magnitude of inven-tory carrying costs. In this example, the contribution marginrhour effect is most pronounced for small
6
Ž . 2
The inventory carrying cost term is i Õrrqcxrz z r2 a
Ž .
where: asannual demand in units ; isinventory carrying cost
Ž .
( )
W.L. Berry, M.C. CooperrJournal of Operations Management 17 1999 163–178 177 volume products under high inventory carrying cost
percentages.
Likewise, the methodology proposed here could be extended to include cases involving the joint analysis of price discounts and production batch sizes. While there is a substantial literature on the issue of quantity discounts, very little of this work considers the detailed effects of process yields and productivity caused by changes in production order quantities, or the effect of differences in process
Ž .
choice Weng, 1995 . Process modeling of the type Ž .
shown in Table 1 and Eq. 2 is needed in order to adapt the quantity discount analysis to reflect process effects.
11. Conclusions
The regression results demonstrate that the oppor-tunity to gain competitive advantage through a strat-egy of increased product variety can be heavily dependent on achieving the proper alignment be-tween marketing and manufacturing strategy. The key marketing and manufacturing strategy issues ex-plored here using the proposed product variety
Ž .
framework and methodology involve: 1 process and infrastructure investments to improve the align-ment between process choice options and market
Ž .
requirements, 2 pricing strategies to provide ade-Ž . quate margins for increased product variety, and 3 the use of inventory investment in cycle stock to enable longer production runs.
The methodology presented here provides a means of determining the unfavorable impact on business performance that can result from using an
inappro-Ž .
priate process choice high volume batch to support a market characterized by low volumerhigh variety
products without price enhancements, e.g., as in the
Ž .
Plastech case Leschke, 1995 . In the illustrations above, it is clear that products involving batch sizes smaller than 4,000,000 units can adversely affect process productivity, product yield, and contribution margin. While the specific results shown in this paper are only relevant to the firm studied, these results are intended to demonstrate the type of infor-mation needed in debating pricing and process in-vestment decisions in market and product selection. This framework and methodology can provide the
basis to determine appropriate pricing and process investment decisions, and to set achievable sales revenue and profit objectives for particular markets and products in many company settings.
It is important that debate concerning the strategy of increased product variety be based upon an accu-rate measure of the manufacturing flexibility require-ments needed to support the contemplated range of product volumes. Further, it is critical that relevant process choice investment options, often involving new investment, be considered which would bring the marketing and manufacturing strategies into alignment. As an example, the processes studied here involved high volume flows of material that are difficult to change quickly. Thus, changeover time and cost are not trivial. The company had previously examined and installed improved methods for mak-ing changeovers efficiently. Even with these im-provements, small order sizes produce adverse cost and margin results. This illustrates the need to evalu-ate changeover time and cost carefully in strevalu-ategic decisions involving increased product variety and manufacturing flexibility. In many instances, new process investments are required to best support market requirements for increased product variety.
The methodology illustrated in Figs. 2 and 5 can provide important data to facilitate debate concern-ing the strategy of increased product variety. The proposed methods provide a way of determining the
range of batch sizes that would produce a given
level of profit. The impact of alternative pricing and process investment options on the range of profitable batch sizes can be tested using this type of analysis in assessing marketing and manufacturing strategic alternatives. Changes in pricing will shift the curves in Figs. 2 and 5 in a vertical direction while changes in process investment can change the shape of such curves. Likewise, a strategy of extending production order sizes to support a strategy of increased product variety, through investment in cycle stock, can also dramatically affect the range of production order sizes that produce a given level of profit.
The analytical framework and methodology pre-sented in this paper provides a way of measuring manufacturing flexibility in terms of the complex cost relationships often encountered with process changeovers, product yields, and differences in run productivity that depend on product volume and
variety. This methodology and approach is general in nature and can be used in a wide variety of manufac-turing processes to measure the impact of those factors which affect process productivity, product yield, and profitability. It is important that businesses contemplating a strategy of increased product variety employ such a methodology to provide relevant cost and contribution margin data. Further research in this area would include: testing the methodology in dif-ferent industries, the analysis of difdif-ferent types of production processes, and the consideration of differ-ent types of investmdiffer-ents to support a strategy of increased variety.
References
Blois, K.J., 1980. The manufacturingrmarketing orientation and
Ž .
its information needs. Eur. J. Marketing 12 5r6 .
Campbell, R., Brewer, P., Mills, T., 1997. Designing an informa-tion system using activity-based costing and the theory of constraints, J. Cost Manage., JanuaryrFebruary.
Chen, I.J., Calantone, R.J., Chung, C.H., 1992. The marketing– manufacturing interface and manufacturing flexibility.
Ž .
OMEGA 20 4 .
Eliashberg, J., Steinberg, R., 1987. Marketing–production deci-sions in an industrial channel of distribution. Manage. Sci. 33
Ž .8 .
Gerwin, D., 1993. Manufacturing flexibility: a strategic
perspec-Ž .
tive. Manage. Sci. 39 4 .
Goldhar, J.D., Lei, D., 1995. Variety is free: manufacturing in the
Ž .
twenty-first century. Acad. Manage. Executive 9 4 . Hayes, R.H., Wheelwright, S.C., 1984. Restoring Our Competitive
Edge. Wiley.
Hill, T., 1992. Manufacturing Strategy: Text and Cases, 2nd edn., Richard D. Irwin.
Hill, T., Chambers, S., 1991. Flexibility—a manufacturing
conun-Ž .
drum. Int. J. Operations Production Manage. 11 2 , 9. Jordan, W.C., Graves, S.C., 1995. Principles on the benefits of
Ž .
manufacturing process flexibility. Manage. Sci. 41 4 .
Karmarkar, U.S., 1996. Integrative research in marketing and operations management. J. Marketing Res. 33.
Kekre, S., Srinivasan, K., 1990. Broader product line: a necessity
Ž .
to achieve success? Manage. Sci. 36 10 .
Kotha, S., 1995. Mass customization: implementing the emerging paradigm for competitive advantage, Strategic Manage. J. Special Issue, Summer.
Leschke, J.P., 1995. Plastech—the importance of matching pro-duction capabilities and market requirements. Propro-duction In-ventory Manage. J., Third Quarter.
McDermott, C.M., O’Connor, G.C., 1995. Managing in the age of
Ž .
the mass merchant. Business Horizons 38 6 .
McLaughlin, C.P. Victor, B., 1995. Getting to mass customization in services. Paper presented at the National Decision Sciences Meeting, Boston, MA, November.
Moran, D., 1996. Toyota’s effort to achieve manufacturing flexi-bility does have a downside. Jpn. Automotive Digest, Septem-ber 16.
Pine, Joseph, B., 1993. Mass Customization: The New Frontier in Business Competition. Harvard Business School Press. Ramasesh, R.V., Jayakumar, M.D., 1991. Measurement of
manu-facturing flexibility; a value based approach. J. Operations
Ž .
Manage. 10 4 .
Richardson, P.R., Taylor, A.J., Gordon, J.R.M., 1985. A strategic approach to evaluating manufacturing performance. Interfaces
Ž .
15 6 .
Safizadeh, M.H., Ritzman, L.P., Sharma, D., Wood, C., 1996. An empirical analysis of the product–process matrix. Manage.
Ž .
Sci. 42 11 .
Schiller, Z., Zellner, W., Stodghill, R., 1992. Clout! more and more, retail giants rule the marketplace. Business Week, De-cember 21.
Spoede, C., 1996. Accounting and the theory of constraints. APICS Conference Proceedings, pp. 45–50.
Suarez, F.F., Cusumano, M.A., Fine, C.H., 1996. An empirical study of manufacturing flexibility in printed circuit board
Ž .
assembly. Operations Res. 44 1 .
Swamidass, P.M., Newell, W.T., 1987. Manufacturing strategy, environmental uncertainty and performance: a path analytic
Ž .
model. Manage. Sci. 33 4 .
Watts, C.A., Hahn, C.K., Sohn, B., 1993. Manufacturing
flexibil-Ž .
ity: concept and measurement. OM Rev. 9 4 .
Weng, Z.K., 1995. Channel coordination and quantity discounts.
Ž .