HOUSING ATTRIBUTES AND RELATIVE
HOUSES PRICES IN GHANA
ABSTRACT
The study of house prices has become more relevant in recent times after the global financial crisis. Using a housing dataset from three regions of Ghana (collated from real estate agents), this research estimates the relative importance of housing attributes to house prices. The hedonic regression analysis conducted indicates that location is the most powerful determinant of house prices. Other relevant factors are the number of bedrooms, the number of floors, the total floor area, land size, age of the house and luxury finishing. The implications of these results are many. Policy wise, the study provides an evidence-based empirical study that supports the need for better urban planning to improve communities, which in turn is associated with house price appreciations. Homeowners, investors and creditors, particularly mortgage lenders could be the immediate beneficiaries. Drawing on this, improved urban planning could mitigate strategic defaults that results from house prices falling below mortgage loan balances. This is important for financial market stability. The paper provides a comprehensive and unique understanding of the hedonic determinants of house prices in Ghana. Future studies could examine the effect of location upon mortgage lending in Ghana.
KEYWORDS:
House Prices, Housing Attributes, Hedonic Modelling, Location, Ghana
INTRODUCTION
Recent events such as the global financial crisis and a series of bank crises around the world have increased scholarship in the area of domestic property valuation in the last two decades, particularly in developed economies. For instance, housing market-related features of the economy have been linked to recent bank crises in the United States,
Spain and Ireland (Claessens et al., 2011). Housing policy (aimed at improving housing affordability and stimulating housing supply) played a major role in the 2007-2008 financial crisis. Therefore, the political economy behind the recent boom-and-bust cycles in the US housing market for example, has raised concerns (see Mian and Sufi, 2011; Mian, Sufi and Trebbi, 2010; Dell’Ariccia, Igan and Laeven, 2012).
Traditionally, standard macroeconomic analysis and the urban economics discipline discounted the interaction of housing markets with the macroeconomy on the premise that a home is a consumer good (Leung, 2004). Housing investment is considered to be a cultivator and a protector of household wealth (Di Zhu, 2001). Apart from income return, housing investments offer the potential for competitive value appreciation and is comparable to capital market investments. Greenwood and Hercowitz (2004) observe that the stock of capital investment in housing were higher than business investment. At the national level, Davis and Heathcote (2007) note that the market value of the U.S. housing stock is approximately equal to the annual average gross domestic product (GDP). Housing investment therefore forms the largest portion of households’ investments hence, making price dynamics and risks in the housing market a major financial risk for households (Campbell and Cocco, 2007; Cocco, 2004).
Against this backdrop, Girouard and Blondal (2001) observe that house price risks and fluctuations have a bigger wealth effect than organized market equities. Anim-Odame (2010) reveals that housing returns between the period of 1992 to 2007 in the cities of Accra and Tema, Ghana are made of a relatively stable income return whereas capital growth for the same period was highly volatile. A fluctuation in house prices leads to a reduction in household wealth that reduces household expenditure (Campbell and Cocco, 2007). This in turn diminishes activity in the construction sector and, reduces housing supply and financial
sector activity in a chain reaction that ripples throughout the whole economy (Bernanke and Gertler, 1995). Most eminently, Pomeroy (2012) identifies housing as the leading indicator of the economy, and the activity with the highest multiplier effect and impact upon GDP recovery. Consequently, house price changes provide a household wealth indicator and are used as a tool by policy makers to design and formulate monetary and fiscal policies, and interventions directed at the financial and banking sectors (Jiang et al., 2015).
Therefore, an examination of the determinants of house prices and associated linkages with economic performance is essential to household and national investment planning (see Xu and Tang, 2014). A large body of housing literature links the observable physical attributes of houses to their prices (Capozza et al., 2008; Abraham and Hendershott, 1994; Case and Shiller, 1989). Kim and Park (2005) also show that factors influencing the housing market include spatial differences, community characteristics and structure, and environmental facilities. The importance of these factors is hinged upon the premise that homeownership has a derived demand, which entitles an owner to a bundle of utilities and liabilities. These utilities and liabilities form the basis for valuing or estimating the market price of a housing asset for various purposes - including taxation.
The hedonic approach has become instrumental in the estimation of implicit prices of housing features in developed economies but has failed to be fully utilised within a developing countries context (see Martins-Filho and Bin, 2005; Adair et al., 2000; Goodman, 1998; Clap and Giacotto, 1998; Sirpal, 1994; Walden, 1990; Rosen, 1974). Hence, in developing economies, Okpala (1987) argues that results from the wider developed world do not entirely fit the African experience due to the models applied. The study attributed this disparity to differences between housing market conditions and development, and state influence.
However, the study (ibid) failed to recognise that these differences in context do not necessarily negate the use of alternative approaches to analysis. Akpom (1996) revealed that housing characteristics have a higher effect upon house prices in Lagos than neighbourhood characteristics. This study (ibid) contrasts with Islam (2012) who reported that social class and neighbourhood characteristics (such as proximity to ravines) had a higher positive correlation with housing prices in Alberta, Canada.
Most previous studies have focused on submarkets in one or two specific towns and cities in various countries, unlike Selim (2008) who examined national housing markets. In Ghana, Owusu-Ansah (2012) uses data for a period of six years to show that the residential class bear the highest implicit price in Kumasi1. Given the heterogeneity of housing markets
even within countries, such findings remain context specific and lack application to the wider economy. This study extends the empirical evidence to wider submarkets that collectively reflect the national housing market in Ghana. Specifically, this study estimates the implicit prices of housing attributes and examines their relative importance to house price formation across housing submarkets in Ghana. The paper is divided into six core sections viz: section one reviews the theory and methods of hedonic house pricing; section two discusses the empirical evidence relating to the relative importance of the housing attributes in house pricing; section three discusses the methodology utilised for this study; section four presents the empirical results; section five presents the discussion; and section six concludes the research undertaken.
HEDONIC HOUSE PRICING: THEORY AND METHODS
Pagoutzi et al., (2003) presents two broad groups of methodologies to valuing housing based on the complexity of the operations involved –1 Kumasi is the capital town of the Ashanti region and most populous city in
namely, traditional and advanced methods. Traditional methods include methods from simple capital value comparisons to using simple regression models developed from a range of market observations. These methods include: the sales comparative method, investment/income method, profit method, development/residual method, cost method, multiple regression method and stepwise regression methods. Conversely, advanced methods offer an improvement to traditional methods by directly simulating the thought processes of market players in order to estimate the relevant variables and values (Pagoutzi et al., 2003). Methods include artificial neural networks, spatial analysing method, fuzzy logic, autoregressive integrated moving average and hedonic pricing.
In economics, the hedonic pricing theory is a preference method2 of
estimating demand or value. Goodman (1998) defines the hedonic pricing approach as the proportional weighting of a group of factors in relation to others in terms of importance; where the latter is used to construct a ranking based on usefulness and desirability. Lancaster’s (1966) hedonic theory is based upon the premise that demand for a product is not for the final product itself but rather represents a bundle of satisfaction or characteristics of the product. Housing assets have several characteristics with unobservable prices because production and exchange of these characteristics (such as floor area) do not take place within an explicit market thus, making their prices implicit. Rosen (1974) defines hedonic prices as the implicit prices of attributes and are revealed to economic agents from observed prices of differentiated products, and the specific amounts of characteristics associated with them.
Sheppard (1999) opines that an implicit market represents a process of production, exchange and consumption of commodities that are primarily
2 These models assume that the preferences of consumers can be revealed by
traded in bundles unlike explicit markets with observed prices and transactions. In housing markets, these bundle of features include locational, structural and neighbourhood attributes, and can be grouped qualitatively and quantitatively (Goodman, 1989). The final products are therefore not perfectly divisible and homogenous in quantum and quality (Ellickson, 1978). Housing units are composite assets, durable, immobile and fixed in character (Malpezzi, 2002). These attributes inure benefits and liability derived from the ownership or enjoyment of the housing unit as a whole (Sabal, 2005). Given the inherent flexibility of the hedonic approach as a tool to constructing housing pricing index, researchers have historically used it extensively (Ziets et al., 2008).
HOUSING ATTRIBUTES AND HOUSE PRICES:
EMPIRICAL EVIDENCE
As reported earlier, housing attributes can be classified into qualitative and quantitative attributes (Goodman, 1989). The major qualitative and quantitative attributes include location, structural, neighbourhood attributes (Goodman, 1989; Freeman, 1979; Chau et al., 2001), and durability (Chau, et al., 2001). These attributes are discussed in detail below:
Locational Attributes
According to Downes and Zabel (2002), the concept of location is foremost on the potential house hunter’s priorities, which bears credence to the cliché that in housing ‘location is everything’. The average house hunter will trade cost for shorter and more convenient access to a place of common commute (Palmquist, 1992). Conversely, Edmond (1984) observes that compensation nullifies the cost of commuting, making the inconvenience of longer commuting time substitutable into the model. Locational measures used in extant literature include: proximity to the central business district; cost of transport; access to transport terminal; socio economic class; racial composition; and proximity or access to a
major road network, infrastructure or business. Other measures include: the residential class and/or the quicker and cheaper it will be to access a particular service or facility (Orford, 1988), travel time (Yiu and Tam, 2004), education and race (Palmquist, 1984).
Structural attributes
Ball (1973) posits that if a housing unit has structural attributes which are most appealing to house hunters, those attributes will reflect in its market value. For instance, structural housing features (e.g. floor area, and number of rooms and bedrooms) are positively and directly related to an increase in housing prices (Rodriguez and Sirmans, 1994; Li and Brown, 1980). Chin and Chau (2003) explains that buyers are willing to pay for more useable space by linking their personal utility of housing services to available usable space for family events and others. Kain and Quigley (1970) also deduces that ceteris paribus, the age of a house will be inversely proportional to its price due to the effect of deterioration and maintenance expenditure required to manage such an asset.
Chin and Chan (2003) bemoans the scant regard that researchers and buyers have placed upon the effect of the structural integrity of housing upon price. They (ibid) observe that the reduced significance and influence of structural integrity of houses may be due to the search cost of house hunting and the additional financial burden involved in any request for structural analysis. Referring to the earlier works of Morris et al. (1972) and Kain and Quigley (1970), Chin and Chan (2003) conclude that the structural integrity of residential housing is equally influential on house pricing.
Neighbourhood attributes
Estimations of housing price indices by Palmquist (1984) and Goodman (1989) highlight the importance of environmental air quality and neighbourhood attributes (Grether and Mieszkowski, 1974; Freeman,
1979). Neighbourhood attributes have been measured by proximity to certain amenities, major roads and demographics. According to Chin and Chan (2003), the effect of neighbourhood attributes on house price seems to be culturally and society dependent. It is also important to note that these variables are not equally important in every society. For example, while race is irrelevant in certain markets, Ketkar (1992) shows that non-white buyers in New Jersey value houses in non-white neighbourhoods highest. Houses within white neighbourhoods therefore actually sell for more ceteris paribus. Such neighbourhoods compose of elites and affluent residents, and have better facilities and security. Neighbourhoods are also exposed to risks that affect house prices. Paik (1972) studied the effect of aviation risk on neighbourhoods around JFK Airport and identified a negative effect of noise and risk of injury on house prices. Thaler’s (1978) work finds a negative effect of externalities (such as local crime rates) on house prices. Therefore, whites were willing to pay more for housing to avoid certain communities for fear of encountering social issues (Ridker and Henning, 1967).
RESEARCH METHODOLOGY
For this research, a post positivist epistemological leans was employed using a mixed methods empirical analysis of both quantitative and qualitative data. Such an approach enabled large amounts of data to be summarised mathematically whilst simultaneously allowing sufficient depth and explanation of the findings. Regards the regional context, Ghana is a Sub-Saharan African (SSA) country lying immediately above the equator (between latitudes 4° and 12°N) and striding the Greenwich Meridian with a population of circa 27 million. The Ghana Statistical Service (2009) expects over 60 per cent of the population will be living in urban areas and that over 65 per cent of the urban population will be living in the top tier four urban areas in 2020. The housing market is nascent and sales transactions are predominantly limited to new houses in the regional capital towns like
Accra, Kumasi, Takoradi and other towns like Tema (Bank of Ghana, 2007).
The market for existing houses is small and almost non-existent outside the major urban areas (UN-Habitat, 2011). Anecdotal evidence suggests that this phenomenon is in part due to a cultural desire to leave houses as inheritance to successors. This research therefore considered volume of transactions in the aforementioned areas as representative of the national housing market. Although housing needs are high, demand is weak due to affordability problems thus, skewing the formal housing market to the rich. The Ghana Real Estate Developers Association (GREDA) largely constitutes formal housing supply. Given a poor property registration and taxation system, and a weak enforcement of statutory obligations to report housing transactions, data collection on housing generally is challenging.
Data Collection
Palmquist (1983) cites that hedonic regression of housing prices requires actual housing transaction data to fulfil the theoretical underpinnings of the approach. A combination of purposive and snowball sample selection technique was adopted. Given the lack of a reliable real estate transaction data depository, one reputable real estate agent operating in Accra (which has a vibrant housing market) was chosen purposively to collate transactions from their books. From this single contact, other reputable estate agents where then identified by recommendation of the first participant and their recommendations sought. The sample then snowballed until a total of 270 transactions from the books of real estate agents were gather across Ghana’s major cities and areas of development. Data collected involved transactions that were concluded within a year of the study and as such, adjustment of prices for time value uniformity was considered not relevant. The prices were mainly in US dollars and were converted using the appropriate currency exchange rate. A data cleaning
process was conducted to refine the quality of data and identify usable transactions. Datasets on uncompleted housing and transactions without adequate information on housing attributes were excluded. After the data cleaning process, a total of 242 datasets were included in the study. Out of this number, 40 per cent were from Accra; 30 per cent from Kumasi; 20 per cent from Takoradi; and 10 per cent from Tema.
EMPIRICAL MODEL AND RESULTS
Two main works inform the housing attributes utilized for estimating house prices in this study. Malpezzi (2003) shows that only 10 out of 27 different housing attributes are relevant predictors of house prices in Ghana. These attributes are either quantitative or qualitative in nature. Quantitative attributes include: age, number of bedrooms, number of floors, number of bathrooms, total floor area and compound size. Qualitative features include: residential class, finishing type and fitting type. The significance of some of these attributes were previously confirmed by Owusu-Ansah (2012) who establishes that while location (measured by the residential class) has the greatest impact upon price, other attributes influence residential property values in urban Ghana (e.g. the number of rooms, floors, age of property, location of property, availability of garage, fence wall and swimming pool and land registration). A summary of the data used is provided below. Considering the available data (refer to Table 1), the following empirical model is estimated viz:
lnHSEP = B0 + B1BEDRMS + B2NFLRS + B3BTHRMS + B4STRYS +
B5FLRAR + B6LNDSIZ + B7WASHRMS + B8AGEW5YRS +
B91STRES + B102NDRES + B113RDRES + B124THRES +
B13LUXFIT+ B14LUXFIN + ԑ,
<Insert Table 1 about here>
Summary of Data
Descriptive statistics of the housing attributes are presented in Table 2 and reveal wide disparities in house prices across all markets (as shown
by the difference in the minimum (GHS74,000) and maximum (GHS5,850,000) values). These figures represent the most expensive and cheapest houses, which are found in Accra during the period of data collection – March to July 2016.
<Insert Table 2 about here>
The average house price is also highest in Accra, followed by Takoradi and then Kumasi. The house price dynamics indicate a wide array of offerings in Accra, perhaps, due to the involvement of private developers. There are also subtle variations in building designs. The difference between the mean numbers of floors in the three submarkets indicates the housing markets’ affinity to single storey housing, which is a major characteristic of houses in Ghana. The matching of the number of bedrooms and the number of washrooms suggests that housing sales transactions rarely involves the traditional compound housing types. Although houses in Kumasi are predominantly single storeys, they have the highest number of bedrooms (mean value of 3.8), followed by Sekondi-Takoradi and the lowest in Accra (mean value of 3.1). Logically, it follows that the number of bedrooms is positively correlated with total floor area. Hence, houses in Kumasi also have the largest floor areas (mean value of 337) and those in Accra have the smallest floor areas (mean value of 230.6). This observation equally applies to land sizes and could be due to relatively higher house prices in Accra. The highest number of bedrooms occupies the largest floor areas and lands size, and vice versa. In contrast, it is interestingly to note that the number of washrooms per each bedroom is smaller for houses in Kumasi and largest in Accra, with Sekondi-Takoradi lying in between. This suggests a negative relationship between the number of bedrooms and the number of washrooms; implying a higher ratio of bedrooms to washrooms in Kumasi compared to Accra and Sekondi-Takoradi.
Test for Multicolinearity among Housing Attributes
Mason and Peaureault (1991) note that although a simple universal definition of collinearity is not apparent, a general agreement for suspicion of its presence can be confirmed when there is a likelihood that a potential or approximate linear relationship exists among some predictor variables in the data set. This means that if variables in the data share common variance then there is a possibility of collinearity, which introduces bias and compromises the effectiveness of multiple regression analysis. Although existence of multicollinearity is undesirable in multiple regression, it is rather the level of multicollinearity that determines harm to the effectiveness of the analysis.
Wen and Guo (2005) note that the variation inflation factor (VIF) is a strong indicator of collinearity in a dataset. According to Belsley (1984), the VIF higher than 10 are not desirable, which indicates that some variables must be excluded. A VIF of 1.25 was obtained, which indicates that the explanatory variables do not possess linear relationships capable of rendering the hedonic regression ineffective. The correlation matrix presented in Table 3 shows that the highest correlation between variables is about 79 per cent, which occurs only once - a good indication that collinearity level is low.
<Insert Table 3 about here>
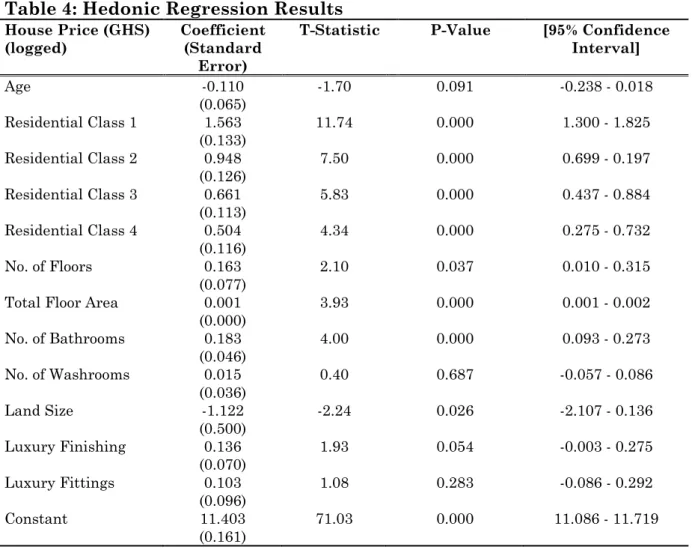
Hedonic Regression Results
Table 4 provides a summary of the hedonic regression analysis. The results show that the overall model is significant and explains about 70 per cent of variation in the house prices. This is supported by the R-squared and adjusted R-R-squared value of 72 per cent and 70 per cent respectively. This is very significant considering that data was obtained from a wider market, consisting of different submarkets at different stages of development. With the exception of the sign of the coefficient of
land size, all the attributes show the expected signs. Normally, land size would be expected to be positively correlated with house price but the estimated relationship here is negative. This is possible considering that land values for similar or smaller parcels of land are relatively expensive in Accra than in Kumasi and Sekondi-Takoradi. The study’s results support the findings made by Owusu-Ansah (2010), particularly in terms of the direction of the effects of the various attributes used, such as the age of building, location, number of bedrooms, washrooms and number of floors.
<insert Table 4 about here>
Comparing the t-statistics of each attribute with the t-critical value of 1.96 (critical value of 95 percent confidence interval), all the attributes are relevant with the exception of two attributes – the number of washrooms and luxury of fittings. All the attributes are also significant at the 1 per cent level but for the number of floors, luxury finishing and age of the house, which are significant at the 5 per cent and 10 per cent levels. Thus, these attributes are jointly and individually statistically significant hence, rejecting the null hypothesis that they have a zero effect on house prices.
The results indicate that location is a powerful predictor of house prices. As expected the contribution of location to house price drops from first class residential neighbourhoods to 5th class residential neighbourhoods.
For instance, a similar house in 1st class and 4th class residential areas
commands 156 per cent and 50 per cent more than the price of the similar house in a 5th class residential area. A house more than 5 years old
reduces house prices by 11 percent in relation to those less than 5 years old. An additional floor, bedroom and washroom add 13 per cent, 16 per cent and 2 percent more to the home’s price respectively. Luxury finishing contributes about 14 per cent more than basic finishing. Luxury fittings
attract an implicit price of 10 per cent more than basic fitting, albeit this finding is not statistically significant.
DISCUSSION
Concurrent with earlier studies like Islam (2012), neighbourhood characteristics measured by the location of house emerges as the single most important driver of house prices. This finding contrasts with those produced by Akpom (1996) who noted that housing characteristics were more important in house pricing those neighbourhood characteristics. It is understandable that location determines the amenities available to homeowners and community members. Many features of location distinguish first class residential neighbours such as East Legon, Airport and Cantonments in the Greater Accra; Ahodwo, Nhyiaeso and Ridge in the Ashanti Region and Anaji and Palm Lands in the Western Region from lower class neighbourhoods like Amrahia and Oyibi in Accra, and Pakoso or Adako Jachie in the Ashanti Region. First class neighbourhoods are well planned and have access to modern infrastructure such as utility services, asphalt roads, well-constructed drainage systems and proper zoning.
Development controls also better enforced and well complied with in first class neighbourhoods, which could be attributed to the calibre of people living in these neighbourhoods. These desirable features of these well-maintained neighbours increase demand for them, which in turn increases house prices. The implications of this finding are many. First, policy-wise, it provides an evidence-base to support the need to promote proper urban planning in Ghana. This is a collective responsibility of respective institutions and community members. Law enforcement is partly an issue of voluntary compliance. Given the systematic weaknesses in the planning institutions, it is possible that first class neighbourhoods are well maintained fundamentally because the community members are relatively more compliant with planning rules either knowingly or unknowingly.
Second, appreciation in house prices due to location benefits both homeowners and investors. Homeowners and investors will enjoy higher capital returns as a result of appreciations in house prices over time, which could also affect rental incomes. Further, the study suggests that mortgage creditors will also reduce collateral risk as a result of house price appreciations, by lending to potential borrowers who seek to purchase houses in well-managed neighbours. This paper suggests that this is the character of mortgage lending in Ghana. This could substantially encourage over-concentration of mortgage portfolios to particular areas while significantly starving other areas.
There are various implications emanating from this research. For policy makers, the research suggests that there is an urgent need to strengthen urban planning institutions to improve poor neighbours via a process of careful gentrification of neighbourhoods to attract additional funding from both private and public investors. In particular, the location of property development defines price and so careful investment to improve surrounding infrastructure and deploy appropriate planning of residential development are simultaneously required. Once the underpinning conditions for development are attractive, new investments will follow but herein lies a further implication of this research. Using the analysis presented, developers could use the findings to match the type of property built to the location area in which the development is planned. Such work would go some way to ensuring that property development is socially inclusive in that property size and value is optimised for the wealth of an area – thus giving a wider range of Ghana’s populous an opportunity to climb the property ladder. In turn, this would also allow the public the secure a better understanding of property prices, what affects such and how best to target their own personal investment decisions.
CONCLUSIONS
This study aimed to extend the empirical evidence of house pricing to a wider scale that better reflects the national housing market in Ghana. The research estimated the implicit prices of housing attributes and examined their relative importance to house price formation across housing submarkets in Ghana. The study shows that location is the most powerful determinant of house prices in Ghana. The age of the building, the number of bedrooms, the number of floors, total floor area, land size and luxury finishing are all relevant factors to consider in house pricing. The uniqueness of the findings (when compared to previous studies) is anchored on the premise that it provides a comprehensive and better understanding of the hedonic determinants of house prices in Ghana considering the use of a multi-regional dataset.
The results are useful for policy makers, property developers and the general public who can cumulatively utilise new knowledge presented to make optimised decisions about their residential property development. In turn, such strategic investment will improve Ghanaian communities by strengthening urban planning to improve financial and non-financial (e.g. health and welfare) investment returns and reduce collateral risk, thereby promoting collateral-based lending. Because location is so important to the value of property, this research proffers that more stringent planning and development of surrounding infrastructure (including roads and rail) is required to ensure that residential property developed has sufficient access to local public amenities and facilities. Ghanaians have to see the future value in their investment. Such will raise the quality of life for residents, raise property prices and fulfil a process of gentrification of deprived urban areas where some property development is currently unregulated and unplanned – as a consequence, slums are created.
Further research is required – perhaps as part of a longitudinal case study to measure success or otherwise of a more robust approach to property development where planners, developers and investors work in harmony to ensure the best result. The impact off adequate surrounding infrastructure must also be taken into account; at present ‘location’ implies that infrastructure is inherent within this variable but more explicit (and ever finer granulated) research is required to further delineate how infrastructure impacts upon location. More specifically, future work should determine what level of infrastructure development is required to increase the value of residential property.
REFERENCES
Abraham, J.M. and Hendershott, P.H. (1996). Bubbles in Metropolitan Housing Markets. Journal of Housing Research, 7: 191 – 207.
Adair, A., Mcgreal, S., Smyth, A., Cooper, J. and Ryley, T. (2000). House Price and Accessibility: The Testing of Relationships within the Belfast Urban Area. Housing Studies, 15(5): 699 – 716.
Akpom, U. N. (1996). Housing Attributes and the Cost of Private Rental Buildings in Lagos Nigeria: A Hedonic Price Analysis. The Review of Regional Studies, 26(3): 351 - 365.
Anim-Odame, W. K. (2010). The Nascent Real Estate Investment Market in Ghana. In Shaping the Change. FIG Congress 2010 Sydney, 11- 16 April.
Ball, M. (1973). Recent Empirical Work of the Determinants of Relative House Prices. Urban Studies,10: 213-233
Bernanke, B.S. and Gertler, M., (1995). Inside the Black Box: The Credit Channel of Monetary Policy Transmission. The Journal of Economic Perspectives, 9(4): 27 – 48.
Campbell, J.Y. and Cocco, J.F., (2007). How do House Prices affect Consumption? Evidence from Micro Data. Journal of Monetary Economics, 54(3): 591 - 621.
Capozza, D.R., Hendershott, P.H., Mack, C. and Mayer, C.J. (2002). Determinants of Real House Price Dynamics. National Bureau of Economic Research Working Paper, 9262. (Available at http://econpapers.repec.org/paper/nbrnberwo/9262.htm, Accessed on 11 February 2017]
Case, K. E., and R. Shiller (1987). Prices of Single-Family Homes since 1970: New Indexes for Four Cities. New England Economic Review 45-56.
Chau, K. W., Ng, F. F. & Hung, E. C. T. (2001). Developer's Goodwill as significant influence on Apartment Unit Prices. Appraisal Journal, 69: 26 - 34.
Chin T.L. and Chau K.W. (2003). A Critical Review of Literature on the Hedonic Price Model, International Journal for Housing Science and its Applications, 27(2): 145 - 165.
Claessens, S. and Laeven, L. (2003). Financial Development, Property Rights, and Growth. Journal of Finance, 58 (6): 2401–36.
Clapp, J. M. and Giaccotto, C. (1998). Residential Hedonic Models: A Rational Expectations Approach to Age Effects. Journal of Urban Economics, 44, 415–37.
Cocco, J (2004). Portfolio Choice in the Presence of Housing. Review of Financial Studies,18(2): 535 - 67.
Davis, M.A. and Heathcote, J., (2007). The Price and Quantity of Residential Land in the United States. Journal of Monetary Economics, 54(8): 2595 - 2620.
Dell’Ariccia, G., Igan, D. and Laeven, L. (2012). Credit Booms and Lending Standards. Journal of Money, Credit, and Banking, 44: 367 - 84.
Di Zhu, X., (2001). The Role of Housing as a Component of Household Wealth. Working Paper No. 6. Joint Center for Housing Studies,
Harvard University. [Available at
http://www.jchs.harvard.edu/sites/jchs.harvard.edu/files/di_01-6.pdf, Accessed on 11 February 2017]
Downes, T. A., and Zabel, J. E. (2002). The Impact of School Characteristics on House Prices. Journal of Urban Economics, 52(1): 1-25.
Edmonds, R. (1984). A Theoretical Basis for Hedonic Regression: A Research Primer, American Real Estate Urban Economics Association Journal, 12(1): 72 - 85.
Ellickson, B. (1978). Hedonic Theory and Housing Markets (No. 124). UCLA Department of Economics, UCLA, Califirnia.
Freeman III, A. M. (1981). Hedonic Prices, Property Values and Measuring Environmental Benefits: A Survey of the Issues. Measurement in Public Choice, 14: 1- 32.
Girouard, N. and Blöndal, S., (2001). House Prices and Economic Activity. Nordic Economic Review, 4(2).
Goodman, A.C. (1998). Andrew Court and the Invention of Hedonic Price
Analysis. Journal of Urban Economics,44(2): 291-298.
Grether, D. M., and Mieszkowski, P. (1974). Determinants of Real Estate Values. Journal of Urban Economics, 1(2), 127 - 145.
Greenwood, J. and Hercowitz, Z. (1991). The Allocation of Capital and Time over the Business Cycle. Journal of Political Economy, 99: 1188-1214.
Islam, S. (2012). Impact of Neighbourhood Characteristics on House Prices. American Society of Business and Behavioural Science Proceedings, 19(1).
Jiang, L., Phillips, P.C. and Yu, J., (2015). New Methodology for Constructing Real Estate Price Indices applied to the Singapore Residential Market. Journal of Banking and Finance, 61: 121 - 131.
Kain, J. F. and Quigley, J. M. (1970). Measuring the Value of Housing Quality. Journal of the American Statistical Association, 65: 532 - 548.
Lancaster, K.J. (1966). A New Approach to Consumer Theory. The Journal of Political Economy, 74(2): 132 - 157.
Ketkar, K. (1992). Hazardous Waste Sites and Property Values in the State of New Jersey. Applied Economics, 24: 647 - 659.
Leung, C., (2004). Macroeconomics and Housing: A Review of the Literature. Journal of Housing Economics, 13(4): 249 - 267.
Malpezzi, S. (2002). Hedonic Pricing Models: A Selective and Applied Review: In Housing Economics and Public Policy (eds T. O'Sullivan and K. Gibb), Blackwell Science Ltd, Oxford, UK.
Martins-Filho, C. and O. Bin, (2005). Estimation of Hedonic Prices Functions via Additive Non-parametric Regression. Empirical Economics, 30(1): 93-114
Mian, A., Sufi, A. and Trebbi, F. (2010). The Political Economy of the U.S. Mortgage Default Crisis. American Economic Review, 100 (5): 1967 - 1998.
Mian, A. and Sufi, A. (2011). House-Prices, Equity-Based Borrowing and the U.S. Household Leverage Crisis. American Economic Review, 101(5): 2132 - 56.
Morris, E. W., Woods, M. E. and Jacobson, A. L. (1972). The Measurement of Housing Quality. Land Economics, 2: 383 - 387. Orford, S. (1988). Valuing Location in an Urban Housing Market, in the Proceedings of the 3rd International Conference on GeoComputation, United Kingdom, University of Bristol.
Okpala, D. C. (1987). Received Concepts and Theories in African Urbanization Studies and Urban Management Strategies: A Critique. Urban Studies, 24: 137 – 150.
Owusu-Ansah, A., (2012). Examination of the Determinants of Housing Values in Urban Ghana and Implications for Policy Makers. Journal of African Real Estate Research, 2(1): 58 - 85. Palmquist, R. B. (1992). Valuing Localized Externalities. Journal of Urban Economics, 31: 59 - 68.
Pagourtzi, E., Assimakopoulos, V., Hatzichristos, T. and French, N. (2003). Real Estate Appraisal: A Review of Valuation Methods. Journal of Property Investment & Finance. 21(4): 383 - 401.
Paik, I.K. (1972). Measurement of Environmental Externality in Particular Reference to Noise. Washington, DC: Georgetown University, Ph.D. dissertation.
Pomeroy, S., (2012). The Housing Market and Canada's Economic Recovery. Federation of Canadian Municipalities: Ottawa.
Ridker, R. G. and Henning, J. A. (1967). The Determinants of Residential Property Values with Special Reference to Air Pollution. The Review of Economics and Statistics, 49: 246 - 257.
Rodriguez, M. and Sirmans, C. F. (1994). Quantifying the Value of a view in Single-Family Housing Markets. Appraisal Journal, 62: 600 - 603.
Rosen, S. (1974). Hedonic Prices and Implicit Markets: Product Differentiation in Pure Competition. Journal of Political Economy, 82(1): 34-55.
Selim, S. (2011). Determinants of House Prices in Turkey: A Hedonic Regression Model. Doğuş Üniversitesi Dergisi, 9(1): 65 – 76.
Sheppard, S. (1999). Hedonic Analysis of Housing Markets. Handbook of
Regional and Urban Economics, 3: 1595 - 1635.
Sirpal, R. (1994). Empirical Modeling of the Relative Impacts of various Sizes of Shopping Centres on the Value of surrounding Residential Properties. Journal of Real Estate Research, 9(4): 487 – 505.
Thaler, D. (1978). A Note on the Value of Crime Control: Evidence from the Property Market. Journal of Urban Economics, 5: 137 – 145. UN-Habitat (2011). Ghana Housing Profile. United Nations Human Settlement Programme: Nairobi, Kenya
Walden, M. L. (1990). Magnet Schools and the Differential Impact of Quality on Residential Property Values. Journal of Real Estate Research, 5: 221 – 230.
Xu, L. and Tang, B. (2014). On the Determinants of UK house Prices. International Journal of Economics and Research, 5(2): 57 - 64. Zietz, J., Zietz, E. N., and Sirmans, G. S. (2008). Determinants of House Prices: A Quantile Regression Approach. The Journal of Real Estate Finance and Economics, 37(4): 317 - 333.
Table 1: Description and Measurement of Housing Attributes
Housing Attribute Definition Measurement Unit
House Price Open market value/transaction value
of housing sale Natural log of the house price in Cedis (lnHSEP) Quantitative
Bedrooms Number of purposely designed,
constructed and serviced bedrooms. Number (BEDRMS). of bedrooms
Bathrooms Number of purposely designed,
constructed and serviced bedrooms Number of bathrooms (BTHRMS).
Housing Type The number of stories, open terraces
and open concrete slabs not included. Number (NFLRS). of floors
Washrooms Designed and serviced number of
washrooms in the house. Number of washrooms (WASHRMS).
Land size Total size of land occupied by the
housing unit. Acreage (LNDSIZ).
Floor area An aggregate area of developed
useable internal area of the house Total floor area in square meters (FLRAR). Qualitative
Age The difference in dates (year) of
construction and dates (year) of sale of the house
A dummy, which shows 1 if the house is within 5 years old, and 0 if more (AGE1).
Location Residential class where the house is
situate A dummy, which shows 1 if the residential class is first (1STRES), second
(2NDRES), third
(3RDRES), and fourth (4THRES) and 0 if it fifth (5THRES).
Finishing Basic finishing or luxury finishing A dummy, which shows 1
if the finishing is luxury (LUXFIN) and 0 if basic.
Fittings Basic fittings or luxury fittings A dummy, which shows 1
if the fitting is luxury (LUXFIT) and 0 if basic
Table 2: Summary Descriptive Statistics
Variables Mean Standard
Deviation
Minimum Maximum Count
All Market Price (GHS) 778,227.83 741,662.07 74,000 5,850,000 242 No. of floors 1.20 0.43 1 3 242 No. of Bedrooms 3.42 1.34 1 8 242 Number of washrooms 3.18 1.45 1 8 242 Floor areas (m2) 280.25 141.28 27 700 242
Land size (acre) 0.16 0.08 0.08 0.43 242
Submarkets Accra Price (GHS) 872,457.8 943,142.6 74,000.0 5,850,000 122 No. of floors 1.3 0.5 1 3 122 No. of Bedrooms 3.1 1.2 1 8 122 Number of washrooms 3.2 1.5 1 8 122 Floor areas (m2) 230.6 141.6 27 700 122
Land size (acre) 0.1 0.1 0.1 0.322 122
Kumasi Price (GHS) 710,047.3 444,973.4 150,000 2,133,300 82 No. of floors 1.1 0.3 1 2 82 No. of Bedrooms 3.8 1.3 2 8 82 Number of washrooms 3.0 1.4 1 8 82 Floor areas (m2) 337.0 116.3 140 690 82
Land size (acre) 0.2 0.1 0.08 0.43 82
Takoradi Price (GHS) 711,567.6 424,584.2 167,700 2,340,000 30 No. of floors 1.2 0.4 1 2 30 No. of Bedrooms 3.5 1.6 2 8 30 Number of washrooms 3.1 1.5 1 8 30 Floor areas (m2) 301 129.7 189 670 30
Land size (acre) 0.2 0.1 0.1 0.32 30
Table 3: Correlation Matrix Ag e Re side n tia l Cla ss 1 Re side n tia l Cla ss 2 Re side n tia l Cla ss 3 Re side n tia l Cla ss 4 Re side n tia l Cla ss 5 N o. o f F lo ors T ot al F lo or Ar ea N o. o f Bat h ro oms N o. o f W as h ro oms L and S ize Bas ic F ini sh ing L u xu ry F ini sh ing Bas ic F it ting s L u xu ry F it ting s P rice (G HS ) Age Residential Class 1 -0.164 1.000 Residential Class 2 -0.083 -0.225 1.000 Residential Class 3 0.014 -0.267 -0.278 1.000 Residential Class 4 0.241 -0.309 -0.322 -0.381 1.000 Residential Class 5 -0.081 -0.136 -0.141 -0.168 -0.194 1.000 No. of Floors -0.113 0.138 0.218 -0.020 -0.265 -0.028 1.000
Total Floor Area -0.302 -0.135 0.136 0.106 -0.176 0.124 0.380 1.000
No. of Bathrooms -0.104 -0.071 0.270 0.066 -0.229 -0.006 0.529 0.767 1.000 No. of Washrooms -0.416 -0.074 0.199 0.101 -0.293 0.155 0.435 0.786 0.633 1.000 Land Size -0.441 -0.123 0.035 0.078 -0.206 0.352 0.268 0.590 0.373 0.640 1.000 Basic Finishing -0.285 -0.102 0.078 0.171 -0.250 0.187 -0.095 0.083 -0.075 0.221 0.288 1.000 Luxury Finishing 0.293 0.107 -0.074 -0.166 0.257 -0.217 0.100 -0.087 0.076 -0.232 -0.296 -0.991 1.000 Basic Fittings 0.019 -0.343 -0.204 0.111 0.282 0.124 -0.178 -0.123 -0.201 -0.013 -0.074 0.352 -0.356 1.000 Luxury Fittings -0.019 0.343 0.204 -0.111 -0.282 -0.124 0.178 0.123 0.201 0.013 0.074 -0.352 0.356 -1.000 1.000 Price(GHS) -0.191 0.502 0.120 -0.130 -0.313 -0.145 0.481 0.390 0.430 0.454 0.182 -0.150 0.155 -0.367 0.367 1.000
Table 4: Hedonic Regression Results House Price (GHS)
(logged) Coefficient (Standard Error)
T-Statistic P-Value [95% Confidence
Interval] Age -0.110 (0.065) -1.70 0.091 -0.238 - 0.018 Residential Class 1 1.563 (0.133) 11.74 0.000 1.300 - 1.825 Residential Class 2 0.948 (0.126) 7.50 0.000 0.699 - 0.197 Residential Class 3 0.661 (0.113) 5.83 0.000 0.437 - 0.884 Residential Class 4 0.504 (0.116) 4.34 0.000 0.275 - 0.732 No. of Floors 0.163 (0.077) 2.10 0.037 0.010 - 0.315
Total Floor Area 0.001
(0.000) 3.93 0.000 0.001 - 0.002 No. of Bathrooms 0.183 (0.046) 4.00 0.000 0.093 - 0.273 No. of Washrooms 0.015 (0.036) 0.40 0.687 -0.057 - 0.086 Land Size -1.122 (0.500) -2.24 0.026 -2.107 - 0.136 Luxury Finishing 0.136 (0.070) 1.93 0.054 -0.003 - 0.275 Luxury Fittings 0.103 (0.096) 1.08 0.283 -0.086 - 0.292 Constant 11.403 (0.161) 71.03 0.000 11.086 - 11.719