F. Abraham J. Van Rompuy*
*
The authors are professor and assistant respectively at the Faculty of Economics and Applied Economics of the KULeuven. They acknowledge the financial support provided by the Generale Bank Chair on European Integration. The paper was inspired by the research of the authors for the VEV (Vlaams Economisch Verbond) in 1997 where we benefited from discussions with M. Andries, M. Offeciers-Van De Wiele, W. Van der Beken en K. Vinck. We are also grateful to Y. Aksoy, P. De Grauwe, N. Demeester, H. Dewachter, S. Geyssens , I. Maes, F. Quix and K. Vermeylen for their comments on a preliminary version of this paper.
Is Belgium ready for EMU ? A look at national, sectoral and regional developments
Filip Abraham and Joeri Van Rompuy
Summary for Economic Policy
The starting date of the European Monetary Union (EMU) is coming close. After several years of intense efforts, eleven European Union (EU) countries are prepared to go ahead. Belgium is one of those countries. This is a step of great importance.
Gradually, the attention is shifting from the preparation of EMU to the question whether EMU will work. In Belgium much of this discussion focuses on the performance of the labour market. Belgium is a country with relatively high structural unemployment. The country is also confronted with a substantial regional gap in economic growth and unemployment. This diverging economic performance gives rise to politically sensitive interregional transfers between the North and the South.
There is a widespread concern that the Belgian labour market will fail to cope efficiently with the need to adjust to changing economic conditions. While a macroeconomic wage restraint with respect to the major trading partners is ingrained in the so-called ‘law to safeguard the Belgian competitive position’, the country has been repeatedly urged by institutions such as the IMF and the OECD to promote wage and labour market flexibility, as well as to increase labour mobility. The prime minister, Jean-Luc Dehaene, pleaded recently for less government intervention in the wage formation process and for a greater wage differentiation that takes into account the diverging conditions that exist in various sectors of the economy. This position is shared by Karel Vinck, the head of the Flemish Employer Organisation (VEV), who views an increased role for sectoral negotiations between unions and employers as a means to achieving wage differentiation in the Belgian economy. And also Karel Boone, the president of the Belgian Employer Federation (VBO), emphasises the responsability of the sectoral level in the Belgian wage negotiations.
Is this concern about insufficient labour market adjustment warranted ? The answer to this question requires a detailed understanding of the structural features in the Belgian economy. Subsequently, one must assess whether wages adjust to those economic shocks. Both issues are the focus of this study.
After a theoretical discussion of the statistical framework (which can be skipped by the technically less inclined reader), the second part of this paper offers a detailed picture of changes in production that occurred in the Belgian economy during the period 1985-1995. Those production shocks were strong and, to an important degree, can be statistically decomposed in developments at the national, regional and sectoral level.
Sectoral shocks are changes that are observed within the same industry in Flanders, Brussels and Wallonia but that are not shared by other sectors. Those sectoral changes are the dominant driving force in the Belgian economy. In our statistical exercise, the sectoral component explains an average of 47% of total output variation and 76% of the output changes explained by our statistical model. Even higher numbers are obtained when changes in employment and labour productivity are considered. The message is clear : the main source of differentiation in the Belgian economy is found at the sectoral level.
These average figures mask a lot of interesting variation in individual industrial and service sectors. We distinguish between a small group of sectors that experience a structurally better growth performance than a group of poor performers. In between those two groups, a large number of primarily manufacturing industries are situated with a comparable growth performance. Looking at the cyclical pattern of individual sectors, there is not much evidence for very different nor for very similar sector-specific business cycles. One interesting exception is the countercyclical role of the government. Apparently, the government increases spending on public services in times of an economic slowdown.
In this paper, regional shocks are defined as output developments that occur in all sectors of a specific region. We find evidence of such shocks but they are of secondary importance when compared to sectoral changes. Apparently, many of the observed regional trends are caused by developments in specific sectors that are primarily located in one region. Having said this, the well-known regional division of the Belgian economy emerges clearly from the statistical model. Flanders is characterised by a better medium-term growth performance, a different cyclical pattern and a greater similarity in regional output changes than either Brussels or Wallonia.
By definition, national shocks are found in all sectors and in all regions. From 1985 to 1995 they accounted for 9% of the total output variation and for 14% of the production changes explained by our model. National factors matter mostly for a limited group of sectors including Metal Products, Construction, Other Market Services and Other Manufacturing.
In an efficient labour market, we expect wage growth to reflect the dominating role of developments at the sectoral level. In the third part of the study, we found this not to be the case in the Belgian economy. While wage levels to some degree reflect long term sectoral productivity differentials, wage growth displays little differentiation across sectors. This lack of sectoral wage flexibility amplifies the impact of the production shocks on employment. Weaker sectors are faced with wage increases which they can ill afford. As a result, the employment performance gap between stronger and weaker sectors widens. In the end, the Belgian economy is faced with a substantial and widespread need for employment reallocation, for which the rigid labour market with limited labour mobility is ill prepared. A greater sectoral wage flexibility would avoid many of those problems.
What about regional differentiation in wage setting ? There is no sign that Belgian wage increases are taking into account regional differences. This comes mostly at the expense of the weakest region, Wallonia, which suffers from higher unemployment than would be obtained if regional wage moderation were feasible. Quite likely, greater sectoral wage differentiation would contribute a lot to regional wage flexibility. Wherever necessary, this sectoral approach could be supplemented by greater attention to the regional dimension in wage setting. Such complementary approach would reduce the need for politically sensitive long-term interregional transfers and in this way enhance political cohesion in the country.
Introduction
After several years of intense efforts, eleven European Union (EU) countries are adopting a single currency and transferring monetary policy to a common institution, the European Central Bank. This is a step of great importance.
Gradually, the attention is shifting from the preparation of European Monetary Union (EMU) to the question whether EMU will work. Opinions differ sharply on the chances of success. Pessimists like the famous American economists Rudiger Dornbusch and Martin Feldstein view EMU as an ill-fated attempt to reconcile the irreconcilable, which will result in even higher unemployment and socio-political unrest in Europe. Advocates of monetary union - and there are many in Europe - do not deny the challenges ahead but expect European countries to cope with the problems in the same way as they brought down public deficits after the signing of the Maastricht Treaty.
The economic debate on the feasibility of monetary union focuses on three major issues (see for instance European Commission (1997) or Obstfeld and Peri (1998)). First, there is the loss of macro-economic policy instruments. In a monetary union with a single currency, a common monetary policy and a stability pact which imposes fiscal discipline, countries give up essential instruments for conducting expansionary or contractionary domestic macro-economic policies. The optimal currency area literature views this as a major problem when a country faces strong asymmetric shocks that affect large parts or the whole country. On the contrary, national macro-economic policy is not the appropriate policy level to address sector- or region-specific shocks so that the transfer of macro-economic sovereignty does not really hurt when such shocks occur.
A second major theme stresses the functioning of the labour market as a necessary condition for a successful EMU. Even without macro-economic policy instruments and with strong adverse shocks, countries and regions avoid high unemployment if labour is mobile and wages adjust in a flexible way to changing economic conditions. But there is the belief that European labour markets are too rigid to cope with the challenges ahead. The third and last issue is of a broader political nature and relates to the cohesion that is deemed desirable in the European Union (EU). There is the fear that EMU might widen the income gap between EU member countries and regions, which would undermine political support for the European integration process. In other words, convergence between prosperous and
less prosperous regions is seen as conditio-sine-qua-non for a successful economic and monetary union.
In this paper, we focus on the Belgian case in the light of the three issues raised in the previous paragraph. Without any doubt the performance of the labour market is a key point on the Belgian road to EMU. Belgium is a country with relatively high structural unemployment. While a macro-economic wage restraint with respect to the major trading partners is ingrained in the so-called ‘law to safeguard the Belgian competitive position’, the country has been repeatedly urged by institutions such as the IMF and the OECD to promote wage and labour market flexibility, as well as to increase labour mobility (e.g. OECD (1997)). To do so requires an understanding of the magnitude and the type of shocks that induce a need for intersectoral and interregional labour reallocation in the Belgian economy. We will show that sectoral developments dominate in the Belgian economy. Since the role of labour mobility as an adjustment mechanism is limited, we furthermore assess whether wage negotiations take into account this sectoral differentiation and, in this way, promote flexible labour market adjustments.
The loss of the monetary and exchange rate instrument is not a main issue in a country that has effectively given up those policy tools for several years now. Fiscal discipline may however undermine the ability to address a nation-wide recession. This paper throws light on the relative importance of such aggregate developments, on the sectors that are most sensitive to national shocks, and on the counter-cyclical impact of the government sector.
Belgium is a prime example of a monetary union with a substantial regional gap. As in the European Union, political cohesion is sustained by interregional transfers between the North and the South. In this paper we look at the recent performance of the three Belgian regions and discuss whether wage adjustments, as an alternative to transfer payments, have been effective in correcting regional imbalances.
The remainder of the paper is structured as follows. Section 1 presents the analytical framework which is based on a growing literature on the decomposition of output shocks, see e.g. Stockman (1988), Bayoumi and Prasad (1995) or Reichlin and Forni (1997). In Section 2 we provide a detailed picture of the national, regional and sectoral changes that occurred in the Belgian economy in the last decade. The third section looks at the labour market adjustments to those shocks. The concluding section discusses the implications of the empirical findings for Belgium and for the EU in the light of the three fundamental issues of monetary union raised in this paper.
1. An empirical framework for national, regional and sectoral components
1.1.Statistical model
We start from the assumption that the growth of production is a valid indicator of the exogenous shocks that affect the Belgian economy. Production growth is explained by a parametric statistical model that is equivalent to the approach taken by Bayoumi and Prasad (1995). More specifically, output growth yr,s,t is estimated as :
yr s t, , = +µ Gt + Ar t, +Bs t, +ur s t, , (1) where ur s t, , is N
( )
0,σ i i d. . .. Ar t r R , =∑
= 1 0 (2) Bs t s S , = =∑
0 1 (3) Gt t T = =∑
0 1 (4)and r,s,t are an index for regions, sectors, and years respectively. The total sample consists
of R regions, S sectors and T years1.
1
In the literature concerning the parametric analysis of variance, this approach is known as a ‘3-way nested factorial design’. Jobson (1991) presents a 2-way nested factorial design, which is extended here to take account of a third factor. A factorial analysis without replications is found in Neter, Kutner, Nachtsheim and Wasserman (1996).
The best linear unbiased estimators for equations (1) to (4) are : $ , , µ = = = =
∑
∑
∑
1 1 1 1 R S T t yr s t T s S r R (5) $ $ , , G R S y t r s t s S r R = − = =∑
∑
1 1 1 µ (6) $ $ $ , , , A S y G s t r s t t s S = − − =∑
1 1 µ (7) $ $ $ , , , B R y G s t r s t t r R = − − =∑
1 1 µ (8)The factor coefficients of equations (5)-(8) have a plausible and intuitive economic interpretation. The first element, µ, is the average growth rate over all sectors, regions and years. In other words, µ is a common trend in production growth. Gt measures the
deviation from this trend that is specific for year t, and on average common to all regions r and sectors s. We will therefore refer to Gt as the aggregate disturbance or nation-wide
shock. Bs,t measures the deviation from this nation-wide development that is specific for a
sector s, but on average common to all regions r. One can therefore refer to Bs,t as the
sector-specific shock. Likewise, Ar,t indicates the region-specific shock that is common to
all sectors2.
Following Bayoumi and Prasad (1995), we normalise the growth rates of value added around the overall sample mean, with an adjustment for the standard deviation in the time series for each sector in each region. More specifically, we perform the following transformation : yr s t Yr s t Y r s , , , , , = σ − (9)
where the lower and upper case Y’s refer to the normalised and the non-normalised data respectively, with Ybeing the overall average growth rate and where σr,s is the sample
standard deviation of the sectoral observations in region r over time. This standardisation is
2
Equations (7) and (8) show why this approach is ‘nested’ in t; Factors A and B measure the region / sector-specific shock as a deviation from the average national growth rate in year t, Gt + µ.
required in an exercise of this type in order to assure normality of each series and, more importantly, equal variance across series. Although the ANOVA-procedure is generally robust to non-normality, the impact of different variances, e.g. different cyclical amplitudes for different sectors, on the behaviour of the F-test can become severe.
This statistical model provides interesting information about the average growth performance and the cyclical behaviour of output in the Belgian economy. There are eight issues that will be addressed in the next section of this paper.
Detailed attention will be paid to the mean output growth rate for the whole time period
considered :
1. First, the magnitude of the shocks in the Belgian economy will be determined. Consider the whole sample including all regions, sectors and years. An indicator of the magnitude of the output shocks is given by the coefficient of variation (CV) which is defined as the sample standard deviation divided by the sample average. This indicator is an approximation of the average percentage dispersion in output growth for the Belgian economy in the whole time period considered.
2. Secondly, the overall explanatory power of the model will be determined. After estimating equation (1), one can compute a predicted value of output growth for each sector, region and year. Those predictions can then be compared with the actual observed production growth figures to obtain a total R², which gives an idea of the statistical performance of the model.
3. As a third step, the role of the national, regional and sectoral factors in the variation of growth rates will be discussed. To do so, we drop each factor one by one from the regression equation (1) and calculate the reduction in the total R². This approach provides an estimate of the real variation in output that is explained by the various components and is measured by a national, a regional and a sectoral R². Equivalently, we can measure the contribution of each factor in terms of the output variation that is explained by our model by expressing the national, regional and sectoral R² as a
3
3
Again we follow Bayoumi and Prasad (1995). A fully precise calculation of the factorial R² via the reduction in the total R² requires that the three types of shocks are mutually orthogonal. Orthogonality between the regional shocks Ar,t and the sectoral shocks Bs,t on the one hand and the national shocks Gt
on the other hand is not guaranteed a priori. Closer inspection of our results did not reveal any meaningful cases where nonorthogonality interfered with the decomposition methodology.
4. Next, one can test whether the national, sectoral and regional output shocks are statistically significant at conventional confidence levels. For example, if there are no meaningful sector-specific shocks, we would expect the sectoral component Bs,t to be
equal to zero. If this null hypothesis is rejected by the data, statistically significant sector-specific shocks are present. With standardised growth rates, a simple F-test can be applied.
5. Rather than considering the whole sample, steps 1 to 4 can be repeated for individual sectors and regions. This exercise yields insights in the way the output growth in sectors and regions are related to production developments at the national, regional and sectoral level. Interestingly, the decomposition for individual sectors can be interpreted in an alternative way to obtain an insight in how sectors contribute to the variation of output. In the framework used here, sectors do not only depend on but also contribute to national, regional and sectoral output variations. If, ceteris paribus, a large proportion of the output growth of a sector is explained by national variations, this sector contributes relatively more to nation-wide output developments that are observed in all sectors of the economy.
6. Finally, the statistical approach provides information on the average growth performance of individual sectors and regions as well as on clusters of sectors. Disaggregating to the sectoral (regional) level allows for a pair-wise comparison of the specific production growth of individual sectors (regions) over the whole time period considered4. In particular, we can test whether the growth performance of individual sectors (regions) is significantly different from other sectors (regions). This identifies sectors and regions with particularly strong or weak production growth.
So far, we have focused on the average production growth for the whole time period considered. The last two steps of our methodology address the cyclical fluctuations of
output growth over time :
7. The pro- or counter-cyclical behaviour of sectors is measured by the correlation coefficient of the sector-specific shocks Bs,t with the nation-wide shocks Gt. A
countercyclical sector would show a large positive sector-specific shock Bs,t when the
economy grows slower than average, i.e. when Gt is negative. Hence a countercyclical
sector would in its own output shocks Bs,t show some negative correlation with the
nation-wide shock Gt. A procyclical sector on the contrary would show positive
4
Since we measure sectoral shocks Bs,t as being specific for a year t, only a pair-wise comparison is meaningful because this maintains the time-structure in the estimated coefficients Bs,t.
correlation with aggregate output growth Gt. Likewise, the correlation between the
regional component Ar,t and the aggregate disturbance captures the cyclical pattern of
regional output growth. The statistical significance of this relationship can be tested via product moment coefficients.
8. The cyclical output movements of individual sectors (regions) can be compared with other sectors (regions). For instance, a positive bilateral correlation coefficient between
B1,t and B2,t indicates that for these two sectors, the sector-specific output shocks move
in the same direction over time. Again we test this cyclical relationship via product moment coefficients.
In the first empirical part of the paper we will apply the statistical model to production data, as measured by gross value added. In the last part of this paper we will subsequently consider wage, productivity and employment adjustments.
1.2. Data
The production data are a panel data set of gross value added in constant consumer prices for the regions of Flanders, Brussels and Wallonia from 1985 to 1995 as reported in the regional statistics by the Institute for National Statistics (NIS, 1996). The sectoral disaggregation has been made according to the EU NACE-CLIO RR17 classification. Taking yearly growth rates, the scope of this series was reduced to ten years.
Data on employment are taken from NIS (1994) and cover all people active in the sector, including self-employed. The range of this database is from 1980 to 1992, and disaggregation is according to NACE/CLIO RR 17. In the actual calculations, we limited the data range to 1985-1992 for comparability with the other variables.
Labour productivity is defined as value added per active person and is computed from the data on real value added (output) and employment, ranging from 1985-1992.
Labour costs are reported in NIS (1996), but are limited to 11 manufacturing industries and construction for the period 1985-1994. The wages here include extra-legal benefits, social security contributions and taxes. Nominal labour costs are adjusted for inflation, and are denominated in prices of 1985.
2. A decomposition of output shocks
In this section we study the output shocks that the Belgian economy experienced in the period 1985-1995. Table 1 provides the information that corresponds to steps one to four in the above discussion. The table shows (i) the coefficient of variation, (ii) the overall explanatory power of the regression equation, (iii) the importance and (iv) the significance of nation-wide, region-specific and industry-specific shocks in this total.
Table 1: Factorial decomposition of the R² for output shocks in Belgium, 1985-1995
Total National Regional Sectoral CV*
output 0.61 0.09** 0.06** 0.47** 6.4
14%** 10% ** 76% **
*
CV : Coefficient of variation
**
Jointly significant at the 1 % significance level according to F-statistics
On the whole, our regression equation performs quite well in predicting the average output
growth rates of the whole time period considered. The aggregate, regional and sectoral
components of the regression model are statistically significant at the 99% confidence level. The decomposition in those three types of shocks explains 61% of the variation in Belgian output growth rates.
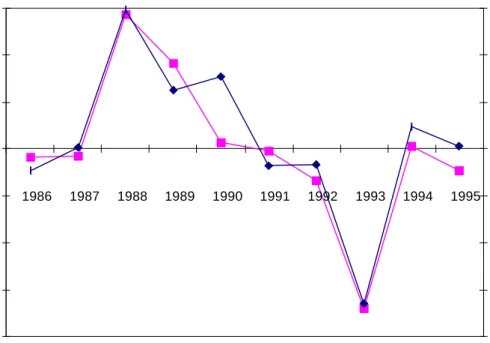
Moreover, the statistical model tracks the cyclical behaviour of aggregate output movements in Belgium quite well. This is seen in Figure 1 where we observe a striking correlation between the actual growth rate of Belgian GNP and the overall time pattern of output growth, as predicted by the aggregate disturbance Gt in our regression equation.
2.1. The magnitude of output shocks
During the years studied in this paper, the Belgian economy was characterised by a
significant degree of output variation. This is seen in Figure 1 by noting the substantial
year-to-year variation in aggregate growth rates. More formally, the coefficient of variation of the output series is 6.4, while the growth rate of output was on average 2.26 % in the period 1985-1995. Hence, there exists a high level of variation around the average growth rate across sectors, across regions and over time. In other words, Belgium was confronted by important output shocks from 1985 to 1995.
Figure 1: Aggregate disturbance Gt and Belgian GNP growth
The right hand side scale measures the estimated national shock Gt.
2.2. Decomposition of output shocks into national, regional and sectoral components
Looking at the type of shocks in Table 1, we find that output shocks are for the main part
sector-specific. The sectoral component Bs,t accounts for 47% of total output variation.
Considering that the regression model explains 61% of the overall output movements, sectoral shocks are responsible for 76% of the explained variation. Far behind the sectoral component, the model attributes a statistically significant role to national and regional shocks. National developments account for 14% of the explained output changes. Regional shocks represent the remaining 10% of the explained output variation.
The dominance of sectoral shocks is a common result in the literature. Already in 1988, Stockman found that a substantial part of industrial output variation in seven European countries is due to differences in sectoral growth rates. Altonji and Ham (1990) reach similar conclusions based on an equivalent decomposition of Canadian employment growth.
-0,8 -0,6 -0,4 -0,2 0 0,2 0,4 0,6 1986 1987 1988 1989 1990 1991 1992 1993 1994 1995 % -0,02 -0,01 0 0,01 0,02 0,03 0,04 0,05
More recently, Marimon and Zilibotti (1998) establish for a sample of ten European countries that almost 80% of the long-run employment growth differentials across countries and industries is accounted for by sectoral effects and only 20% by country effects.
2.3. A detailed assessment of sectoral differentiation
The large overall weight given to sectoral shocks masks a substantial degree of variation in
the interaction of individual sectors with national, regional and sectoral developments.
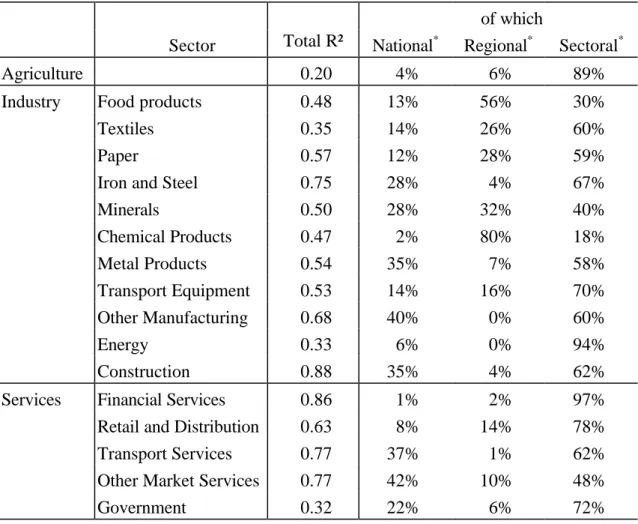
This becomes clear when we present in Table 2 an output decomposition for each individual sector (the fifth step in our methodology). Note that we report the various components expressed as a percentage of the total variation which is explained by the model (that is as a percentage of the R² reported in the second column).
The results of this detailed sectoral disaggregation vary markedly across sectors. More than in other sectors, national shocks will be felt in and are generated by Metal Products, Other Manufacturing, Construction, and Other Market Services as well as, to a lesser extent, in Iron and Steel, Minerals and Government Services. Regional developments are primarily related to Food products and Chemicals but also matter in Minerals, Paper and Textiles5. Not surprisingly, those sectors are largely concentrated in either the Flemish or the Walloon region. Sector-specific aspects account for at least half of the production growth in all sectors except Chemicals, Food Products and Other Market Services. The Financial sector, Agriculture and Energy display the most outspoken sectoral behaviour. Finally, it is worthwhile to note that the total explanatory power of the statistical model is poor for the agricultural sector and below average for Government services, the Textiles and Energy industry. These sectors show a lot of idiosyncratic variation in output growth rates that is not common to regions nor sectors.
5
Contrary to the findings of Bayoumi and Prasad (1995), it is not clear that region-specific shocks are less important for tradables than for non-tradables. On the contrary, in typically non-tradable industries as Construction and Energy region-specific developments account for hardly any variation in output. Also, services show in general a lower degree of region-specific developments than manufaccturing industries do.
Table 2: Sectoral disaggregation in the decomposition of output shocks in Belgium, 1985-1995
of which
Sector Total R² National* Regional* Sectoral*
Agriculture 0.20 4% 6% 89%
Industry Food products 0.48 13% 56% 30%
Textiles 0.35 14% 26% 60%
Paper 0.57 12% 28% 59%
Iron and Steel 0.75 28% 4% 67%
Minerals 0.50 28% 32% 40% Chemical Products 0.47 2% 80% 18% Metal Products 0.54 35% 7% 58% Transport Equipment 0.53 14% 16% 70% Other Manufacturing 0.68 40% 0% 60% Energy 0.33 6% 0% 94% Construction 0.88 35% 4% 62%
Services Financial Services 0.86 1% 2% 97%
Retail and Distribution 0.63 8% 14% 78%
Transport Services 0.77 37% 1% 62%
Other Market Services 0.77 42% 10% 48%
Government 0.32 22% 6% 72%
* The R² percentage measures the factorial R² as a share in the sum of the factorial R²
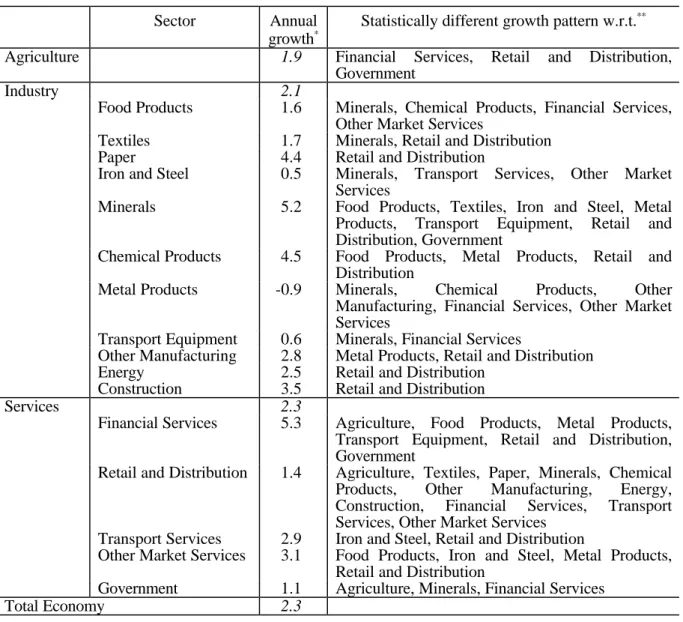
We can also take a statistical approach to identify strongly and weakly growing sectors. Applying the sixth step of the statistical approach, we trace intersectoral differences in average output growth rates by performing a pair-wise Student’s t-test on the Bs,t
coefficients to check whether the different Bs,t estimates are likely to have a different mean
each year. This approach allows for a bilateral comparison of the structural (i.e. medium term) growth performance of all possible pairs of sectors in our sample. A detailed overview of the value of the t-tests is found in Table A1 in the Appendix. The figures in that table should be read as the statistical probability that the growth performance of the pair of sectors is identical. If this probability is smaller than or equal to 0.05 (5%), we reject at a 95 % confidence interval that the two sectors experienced the same medium term growth performance. In that case, the figure is put in bold.
The main results are captured in an intuitive way in Table 3. Next to the actually observed average growth rates of production, Table 3 lists for each sector the sectors with respect to
which a statistically significant different output growth was found. It is evident that this statistical criterion imposes very strict conditions for sectors to reveal a different growth pattern. In spite of this, we can clearly distinguish between a group of sectors that grow structurally faster than a group of poor performers. The weakly growing sectors are Retail and Distribution, Government, Iron and Steel and, most of all, Metal Products. Minerals, Financial Services and Other Market Services show high medium-term growth performance that differs from a substantial set of other sectors. Not surprisingly, these results are consistent with the growth figures in Table 3 with the exception of Chemical products and Paper that are characterised by too much variation around the average growth rate to show a statistically different growth pattern.
Table 3 : The growth pattern of Belgian sectors, 1985-1995
Sector Annual growth*
Statistically different growth pattern w.r.t.**
Agriculture 1.9 Financial Services, Retail and Distribution, Government
Industry 2.1
Food Products 1.6 Minerals, Chemical Products, Financial Services, Other Market Services
Textiles 1.7 Minerals, Retail and Distribution Paper 4.4 Retail and Distribution
Iron and Steel 0.5 Minerals, Transport Services, Other Market Services
Minerals 5.2 Food Products, Textiles, Iron and Steel, Metal Products, Transport Equipment, Retail and Distribution, Government
Chemical Products 4.5 Food Products, Metal Products, Retail and Distribution
Metal Products -0.9 Minerals, Chemical Products, Other Manufacturing, Financial Services, Other Market Services
Transport Equipment 0.6 Minerals, Financial Services
Other Manufacturing 2.8 Metal Products, Retail and Distribution Energy 2.5 Retail and Distribution
Construction 3.5 Retail and Distribution
Services 2.3
Financial Services 5.3 Agriculture, Food Products, Metal Products, Transport Equipment, Retail and Distribution, Government
Retail and Distribution 1.4 Agriculture, Textiles, Paper, Minerals, Chemical Products, Other Manufacturing, Energy, Construction, Financial Services, Transport Services, Other Market Services
Transport Services 2.9 Iron and Steel, Retail and Distribution
Other Market Services 3.1 Food Products, Iron and Steel, Metal Products, Retail and Distribution
Government 1.1 Agriculture, Minerals, Financial Services Total Economy 2.3
*
Average annual growth rate of output 1985-1995
**
We conclude that the large variation in sectoral growth rates is at least to some extent due to the fact that some sectors out- or underperform when compared to other sectors on a bilateral basis. Nevertheless we find that no single sector shows production growth rates
that are structurally different from all other sectors. More, a remarkable and interesting
feature of the statistical tests is the large number of sectoral combinations where no
structurally different growth performance is observed (see Table A1 in the Appendix).
This is particularly true for manufacturing where industries appear to be far more homogeneous than in services. This relatively homogenous picture implies that a substantial part of the output shocks in manufacturing do not reflect sharply varying medium term growth performance of the different sectors. Instead, for many sectors divergent patterns during specific years are likely to be (at least partially) offset afterwards.
Turning to the cyclical fluctuations of output growth over time, we first check whether sectors follow a clear pro- or counter-cyclical behaviour with respect to the aggregate output shock. As mentioned in the methodological discussion and shown in Table 4, this is done by computing the correlation coefficient of the industry-specific component Bs,t with
the aggregate disturbance Gt and testing for statistical significance. A positive correlation
coefficient indicates that the sector is procyclical : when aggregate growth increases by 1 percent, the growth rate of the sector increases by the correlation coefficient. Countercyclical sectors show a negative correlation with aggregate growth. In order to be statistically significant at the 95 % confidence interval, the correlation should be more than 0.62 in absolute terms. Significantly correlated sectors are denoted in bold.
From Table 4 it is clear that some sectors display a marked pro- or counter-cyclical
behaviour but many do not. The only statistically significant pro-cyclical sector is Other
Market Services although production growth in Transport services, Other Manufacturing and Construction also appear to follow closely the fluctuations of national production. Together with Agriculture and to a lesser extent Chemical Products, Government services is the most counter-cyclical sector. This is an interesting result as it indicates that government spending on services attenuates the slowdown of the economy in times of economic recession.6
6
For the EU, Bayoumi and Prasad (1995) find similar cyclical patterns for individual sectors except for the government sector, for which no stabilising role was found.
Table 4 : The cyclical pattern of Belgian sectors, 1985-1995
Sector Correlation with aggregate
shock*
Statistically different cyclical pattern w.r.t.**
Agriculture -0.67 Metal Products, Other Manufacturing, Other Market Services, Government
Industry Food Products -0.02 Construction Textiles -0.21 Metal Products Paper -0.06 Retail and Distribution Iron and Steel -0.26 None
Minerals 0.21 None Chemical Products -0.47 None
Metal Products 0.32 Agriculture, Textiles, Other Manufacturing Transport Equipment -0.10 None
Other Manufacturing 0.54 Agriculture, Metal Products Energy -0.29 None
Construction 0.46 Food Products, Financial Services Services Financial Services -0.25 Construction
Retail and Distribution -0.05 Paper Transport Services 0.46 None
Other Market Services 0.79 Agriculture, Government
Government -0.78 Agriculture, Other Market Services
*
Correlation of Bs,t with Gt. Significant correlation coefficients at the 95% confidence interval are
denoted in bold.
**
Statistically significant cross-sector correlation of Bs,t according to product moment coefficients.
Is the cyclical pattern different when individual sectors are compared ? To answer this question, we apply the final step of our methodology and consider the correlation coefficients of each pair of sectors in Table A2 in the Appendix. Each coefficient indicates how the sector specific output growth is related to the sector specific output growth of another industry. Figures in bold represent pairs of sectors that experienced a statistically similar cyclical pattern. To simplify matters, those cases are once again listed in column 2 of Table 4. For example, the strong mutual procyclical relation between Other Manufacturing and Metal Products may indicate a strong vertical integration of these sectors. It is remarkable to see that only few combinations of sectors show either a distinct pro-cyclical or counter-cyclical pattern. In short, there is not much evidence for very
different nor for very similar sector-specific business cycles.
In the Belgian political and economic debate, regional differences attract considerable attention and are an issue of serious controversy. What does our output growth decomposition add to this debate ?
First, the figures in Table 1 show that regional shocks represent a secondary - albeit
non-negligible - source of output shocks in the Belgium economy7. The exact meaning of this
finding should be emphasised here. In the statistical model, a regional shock is defined as output growth which is observed in all sectors within that region8. Output variations that are present in a subset of sectors in one region are not considered as regional shocks, although they may have pronounced regional consequences. For instance, a recession in the textile industry will be primarily felt in the Flemish region, because 83% of Belgian textiles are produced in Flanders.
Table 5: Decomposition of output shocks for Belgian regions, 1985-1995
Total R² National* Regional* Sectoral*
Brussels 0.54 7% 0% 93%
Flanders 0.66 22% 18% 59%
Wallonia 0.61 14% 6% 81%
*
The R² percentage measures the factorial R² as a share in the sum of the factorial R²
Secondly, Belgian regions differ in their relationship to national, regional and sectoral
developments in production growth. In Table 5, we decompose production growth in
Flanders, Wallonia and Brussels in a national, regional and sectoral component. While sectoral shocks dominate in each region, the contrast between Flanders and the other regions is clear. In Flanders, national and regional shocks are of comparable importance and account for more than 40% of the regional production growth that is explained by the model. On the contrary, sector-specific output growth is responsible for at least 80% of the explained variation in Brussels and the Walloon region.
Thirdly, the medium-term growth performance and the cyclical output fluctuations of
Belgian regions are not the same9. Comparing regions on a pair-wise basis, we conclude
7
In the empirical literature both Reichlin and Forni (1997) and Bayoumi and Prasad (1995) find relatively large proportions of output variation attributable to differences between regions. Note though that Reichlin and Forni do not take into account sectoral variation.
8
And is not observed in other regions. Otherwise it would be an aggregate disturbance. 9
that production growth in Flanders diverges significantly from the two other regions while the difference between the growth rates in Brussels and Wallonia is not statistically significant. This does not come as a surprise because in the period 1985-1995 the annual production growth rate amounted to 2.7% in Flanders compared with 1.3% in Brussels and 1.8% in the Walloon region. In terms of cyclical movements of region-specific components, test results indicate that the region-specific shocks for Flanders are not significantly correlated with other regions. Wallonia and Brussels seem to be negatively correlated at the 5 % level with a negative correlation coefficient of - 0.62.
3. Wage and employment adjustment in Belgium
In the previous section we described the shocks that affect the Belgian economy. In this section we investigate whether wages adjust as to dampen the employment effects of the output changes. In doing so, we concentrate on medium-term real wage and employment changes. Real wages are defined as nominal wages adjusted for national inflation. Due to the fact that our wage and employment data cover fewer years than the production data, we do not analyse cyclical patterns.
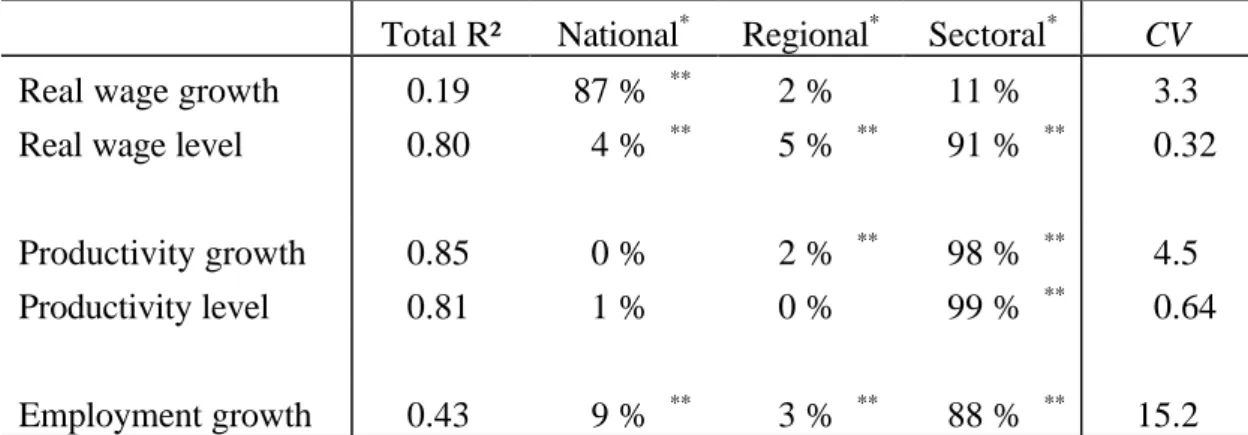
Do wages adjust to absorb the diversity of production shocks that characterise the Belgian economy ? Very little so. In Table 6, we report the decomposition of wage growth in sectoral, regional and national changes. While the explanatory power of the statistical model is not all that satisfactory, the bottom line appears to be clear-cut. Wage gains are determined at the national level and do not reflect the outspoken sectoral profile of output developments. Nor is there any evidence that the regional disparities in output growth are affecting wage negotiations. And the coefficient of variation is substantially lower for wage growth than for output shocks (compare Tables 1 and 6), again indicating that wage increases in Belgian sectors and regions are relatively uniform in comparison to the heterogeneity in output movements10.
Do wages fail entirely to take into account inter-sectoral differences in the Belgian economy? To further investigate this question, Table 6 contains a decomposition of wage
levels. Since we expect from economic theory that real wages and labour productivity are
10
A more detailed analysis shows that variation in nominal wage growth drops to 0.9 when we do not correct for nation-wide adjustments for inflation. So, nominal wage growth specifically fails to adjust for inter-sectoral differences in output growth.
closely linked, we furthermore perform a decomposition of the levels and growth of labour productivity as measured by the value added per worker.
What do we learn from Table 6 ? Sector-specific features determine productivity and wage levels. This is consistent with the hypothesis that real wage levels reflect sectoral productivity differentials although the coefficient of variation indicates that wage dispersion is smaller than productivity differentiation. In contrast, wage growth is not in line with the predominance of sectoral factors in neither productivity nor output growth. In other words, wages did not function as an effective adjustment mechanism for the output and productivity changes that occurred in Belgium during the 1980’s and early nineties. At best, wages reflect changing conditions in the Belgian economy in the very long run.
Table 6 : Factorial decomposition of labour market indicators
Total R² National* Regional* Sectoral* CV
Real wage growth 0.19 87 % ** 2 % 11 % 3.3
Real wage level 0.80 4 % ** 5 % ** 91 % ** 0.32
Productivity growth 0.85 0 % 2 % ** 98 % ** 4.5
Productivity level 0.81 1 % 0 % 99 % ** 0.64
Employment growth 0.43 9 % ** 3 % ** 88 % ** 15.2
*
Percentage of the total explained variation
**
Jointly significant at the 1 % significance level according to F-statistics
If wages fail to adjust to output shocks, employment will. The decomposition for changes in employment in Table 6 brings home this message forcefully. The coefficient of variation points to employment changes that are substantially more pronounced than the output shocks (15.2 versus 6.4). Of the explained variation in employment growth, 88% is due to sector-specific factors. This does not come as a surprise. When important differences in sectoral growth performance are confronted with a wage evolution that is mutatis mutandis the same in all sectors, the contrast between the employment performance of stronger and weaker industries becomes sharper. Heylen (1998) and Goubert (1997) make a similar point.
Conclusion
In this paper we analysed the position of the Belgian economy in the upcoming monetary union. We took the perspective of the national, regional and sectoral adjustments that are required to guarantee a smooth Belgian participation in EMU. In view of the evidence for the recent past that was presented in this paper, is Belgium ready for EMU ? Referring to the three main issues in the introduction, we can at least present some partial answers.
First, the loss of macroeconomic instruments should not be exaggerated in the Belgian case. Irrespective of the fact that Belgium may have little macroeconomic sovereignty to begin with, most shocks in the last years did not have a national character and can therefore not be dealt with by macroeconomic policy. As our results indicate, this does not rule out that specific sectors may suffer from the absence of macroeconomic policy because they are dependent on national developments or display a pronounced pro-cyclical behaviour. This would particularly be true if EMU-imposed fiscal discipline would reduce the counter-cyclical role of the government that was apparent in our output decomposition.
Secondly, labour market adjustment will be a key factor if the past experience with production shocks is a good guide for life after the start of EMU. If history repeats itself, the Belgian economy will be confronted with substantial production shocks that are primarily sectoral in nature. While a selected group of sectors may show a strongly divergent performance, a broad range of sectors will experience a variety of diverse production changes that do not turn into pronounced structural and cyclical trends. The ability to cope with frequent and diverse sectoral production changes is a crucial challenge for Belgian labour markets.
In the recent past, wages have not proven to be an effective adjustment mechanism to absorb the diversity of shocks that affected the Belgian economy. While wage levels to some degree reflect long term sectoral productivity differentials, wage growth displays little differentiation across sectors. This lack of sectoral wage flexibility amplifies the impact of the production shocks on employment and widens the employment performance gap between stronger and weaker sectors. In the end, the Belgian economy is faced with a substantial and widespread need for employment reallocation, for which the rigid labour market with limited labour mobility is ill prepared. A greater sectoral wage flexibility -together with a broader macro-economic wage restraint that is already in place - would avoid many of those problems and would contribute to a successful Belgian participation in EMU. In our opinion, this is a lesson that applies to all EMU participants that are
characterised by a combination of disaggregated shocks, rigid labour markets and centralised wage setting.
Thirdly and lastly, a distinct regional pattern is observed in the statistical decomposition contrasting the Flemish region with the two other regions. While sectoral shocks clearly dominate the output changes in all regions, Flanders is characterised by a greater homogeneity of shocks across sectors and a better medium-term growth performance. In order to prevent that this diverging regional pattern of shocks is translated in a gradually widening gap in regional unemployment rates, regional labour markets have to adjust. Here again, there is no sign that Belgian wage increases are taking into account regional differences. This comes mostly at the expense of the weakest region, Wallonia, which suffers from higher unemployment than would be obtained if regional wage moderation were feasible. For a broader sample of European regions and countries, Abraham (1996) shows that this conflict between national wage setting and unequal regional performance is not limited to the Belgian case. A better functioning of regional labour markets would reduce the need for politically sensitive long-term interregional transfers and in this way contribute to political cohesion within Belgium and within the European Union as a whole.
References
Abraham, F. (1996), ‘Regional Adjustment and Wage Flexibility in the European Union’,
Regional Science and Urban Economics, 26, pp. 51-75.
Altonji, J. and J. Ham (1990), ‘Variation in employment growth in Canada : the role of external, national, regional and industrial factors’, Journal of Labour Economics, vol. 8, nr. 1, pp. 198-236.
Bayoumi, T. and E. Prasad (1995), ‘Currency unions, economic fluctuations and adjustment: Some empirical evidence’, CEPR Discussion paper 1172, London.
Davis, S. and J. Haltiwanger (1992), ‘Gross job creation, gross job destruction, and
Quarterly Journal of Economics, August, pp. 819-863.
European Commission (1997), ‘Economic Policy in EMU’, EC Economic Papers, 125, November 1997, Brussel.
Goubert, L. (1997), ‘De flexibiliteit van de Belgische relatieve lonen’, FETEW-RUG
Working Paper, nr. 97/26, Gent.
Heylen, F. (1998), ‘Monetaire unie en arbeidsmarkt: Reflecties over loonvorming en
FETEW-RUG Working Paper, nr. 98/56, Gent.
INR (1997), Regionale Rekeningen, Instituut voor Nationale Rekeningen, Brussel.
Jobson, J. (1991), Applied Multivariate Data Analysis, New York, Springer-Verlag.
Marimon, R. and F. Zilibotti (1998), ‘Actual versus Virtual Employment in Europe: Is
European Economic Review vol. 42, nr. 1, pp. 123-154.
Neter, J., Kutner, M., Nachtsheim, C., and J. Wasserman (1996), Applied Linear Statistical
Models, Chicago, Irwin.
NIS (1994), Statistische Studiën nr. 102, Nationaal Instituut voor de Statistiek, Brussel.
NIS (1996), Regionaal Statistisch Jaarboek; Energie en nijverheid: synthetische resultaten
van de jaarstatistiek voor de industriële produktie, Nationaal Instituut voor de
Statistiek, Brussel.
Obstfeld, M. and G. Peri (1998), ‘Regional nonadjustment and fiscal policy: Lessons for
NBER Working Paper, nr. 6431, Washington D.C.
OECD (1997), OECD Economic Surveys: Belgium/Luxembourg, OECD, Paris.
Reichlin, L. and M. Forni (1997), ‘National policies and local economies: Europe and the US’, CES- KULeuven seminar paper, Leuven.
Stockman, A. (1988), ‘Sectoral and aggregate disturbances to industrial output in seven
s,t series for output shocks
Industry Services
Food Products
Textiles Paper Iron and
Steel Minerals Chemical Products Metal Products Transport Equipment Other Manu-facturing Energy Construc-tion Financial Services Retail and Distri-bution Transport Services Other Market Services Govern-ment Agriculture 0.23 0.75 0.54 0.30 0.16 0.14 0.49 0.36 0.64 0.65 0.47 0.05 0.02 0.57 0.43 0.01 Food products 0.37 0.08 0.87 0.01 0.03 0.65 0.75 0.12 0.15 0.13 0.01 0.25 0.08 0.04 0.41 Textiles 0.34 0.33 0.01 0.12 0.63 0.42 0.43 0.49 0.18 0.11 0.05 0.32 0.13 0.16 Paper 0.16 0.23 0.62 0.18 0.11 0.99 0.85 0.81 0.21 0.05 0.92 0.66 0.07
Iron and Steel 0.02 0.06 0.64 0.70 0.11 0.22 0.08 0.07 0.32 0.04 0.04 0.57
Minerals 0.70 0.02 0.02 0.28 0.29 0.42 0.59 0.01 0.44 0.49 0.02 Chemical Products 0.03 0.08 0.56 0.28 0.82 0.31 0.02 0.89 0.56 0.11 Metal Products 0.94 0.02 0.18 0.14 0.04 0.15 0.09 0.04 0.39 Transport Equipment 0.25 0.31 0.14 0.05 0.23 0.15 0.09 0.32 Other Manufacturing 0.88 0.73 0.31 0.02 0.89 0.56 0.11 Energy 0.74 0.11 0.04 0.76 0.59 0.08 Construction 0.47 0.01 0.89 0.85 0.09 Financial Services 0.01 0.38 0.43 0.01 Retail and Distribution 0.03 0.02 0.52 Transport Services 0.73 0.09 Other Market Services 0.09
Food Products
Textiles Paper Iron and
Steel Minerals Chemical Products Metal Products Transport Equipment Other Manu-facturing Energy Construc-tion Financial Services Retail and Distri-bution Transport Services Other Market Services Govern-ment Agriculture 0.00 0.07 -0.03 -0.23 -0.42 0.30 -0.63 0.09 -0.67 0.01 -0.30 0.44 0.38 -0.57 -0.79 0.80 Food products -0.25 0.00 0.46 -0.45 -0.30 0.33 0.40 -0.30 -0.26 -0.60 0.24 -0.41 -0.07 -0.02 0.27 Textiles 0.03 0.05 0.51 -0.23 -0.67 0.37 -0.41 -0.27 0.36 -0.42 0.08 -0.08 0.18 -0.03 Paper -0.32 0.45 -0.39 -0.15 0.26 -0.15 0.24 0.00 0.21 -0.61 -0.18 0.07 -0.21
Iron and Steel -0.04 -0.45 0.16 0.27 -0.01 -0.52 0.04 -0.58 -0.24 0.44 0.10 0.10
Minerals -0.29 -0.21 0.08 0.25 -0.14 0.53 -0.37 -0.34 -0.03 0.54 -0.49 Chemical Products -0.02 -0.42 -0.05 0.56 -0.48 0.46 0.22 -0.07 -0.44 0.37 Metal Products -0.31 0.72 0.11 -0.12 -0.08 -0.17 0.25 0.24 -0.30 Transport Equipment -0.52 -0.54 -0.05 -0.19 -0.38 -0.01 -0.12 0.28 Other Manufacturing -0.03 0.49 -0.33 0.15 0.16 0.46 -0.58 Energy -0.44 0.45 -0.17 0.21 -0.17 -0.11 Construction -0.68 0.40 0.06 0.40 -0.49 Financial Services -0.07 -0.45 -0.21 0.22 Retail and Distribution -0.40 -0.20 0.14 Transport Services 0.27 -0.29 Other Market Services -0.90
In this table, bold figures indicate that we can statistically reject the null hypothesis that two sectors show cyclically unrelated sectoral output components Bs,t
DPS 97.01 Hans Dewachter, Geert Gielens and Dirk Veestraeten, An Assessment of
Central Banks’. Stand on Exchange Rate Stabilization Policies, February.
(International Economics).
DPS 97.02 Anneleen Peeters, How Hiring and Firing Costs Affect Labour Demand in a
Model of Uncertainty, February. (International Economics).
DPS 97.03 Hans Eyssen, Are West-African Immigrants Discriminated in Cote D’Ivoire?, March. (Development Economics).
DPS 97.04 Wim Lagae, The Absorption of the Effects of Debt Relief Operations by
European Export Credit Agencies: An Institutional Analysis, March.
(Development Economics).
DPS 97.05 Jenke ter Horst and Marno Verbeek, Estimating Short-Run Persistence in
Mutual Fund Performance, March. (Econometrics).
DPS 97.06 Hans Dewachter and Hanno Lustig, A Cross-Country Comparison of CPI as a
Measure of Inflation, April. (Financial Economics).
DPS 97.07 Yunus Aksoy and Yohanes E. Riyanto, Exchange Rate Pass-Through in
Vertically Related Markets, May. (International Economics).
DPS 97.08 Paul De Grauwe, The Indeterminacy of the Euro Conversion Rates. Why it
Matters and how it can be solved, June. (International Economics).
DPS 97.09 Jozef Konings, Hylke Vandenbussche and Reinhilde Veugelers, Union Wage
Bargaining and European Antidumping Policy, June (Financial Economics).
DPS 97.10 Francis Vella and Marno Verbeek, Using Rank Order as an Instrumental
Variable: An Application to the Return to Schooling, May. (Econometrics).
DPS 97.11 Jozef Konings and Patrick P. Walsh, The Effect of Real Exchange Rate Movements and Ownership on the Life Cycle of Manufacturing Plants in
Ireland (1973-1994), June. (Financial Economics).
DPS 97.12 Johan Eyckmans, Balancedness of games with multilateral environmental
externalities, August. (Public Economics).
DPS 97.13 Patrick Van Cayseele and Dave FURTH, Price Leadership and Buyouts,
September. (Financial Economics).
DPS 97.14 Mark De Broeck, Dominique Guillaume and Emmanuel Van der Stichele,
Small and Big Bangs in Bond Markets, September (Financial Economics).
DPS 97.15 Hanno Lustig, Re-examining the Synchronization of European Business
Cycles, September (Financial Economics).
DPS 97.16 João P. Cocco, Francisco J. Gomes and Pascal J. Maenhout, A Two-Period
Model of Consumption and Portfolio Choice With Incomplete Markets, June
Sharing within Households in Rural Ethiopia, October (Development Economics).
DPS 97.19 Paul Collier, Stefan Dercon and John Mackinnon, Density versus Quality in Health Care Provision: The Use of Household Data for Budgetary Choices in
Ehtiopia October (Development Economics).
DPS 97.20 van der Lijn Nick and Marno Verbeek, Excess demand, repressed inflation,
and forced saving in the Soviet Union, October (Econometrics).
DPS 97.21 Lorelei Crisologo-Mendoza and Dirk Van de gaer, Population Growth and Customary Law on Land: The Case of Cordillera Villages in the Philippines,
October (Development Economics).
DPS 97.22 Tom Van Puyenbroeck, Two-stage optimal control problems subject to an
isoperimetric constraint, October (Public Economics).
DPS 97.23 Erik Schokkaert, Geert Dhaene and Carine Van de Voorde, Risk Adjustment
and the Trade-off Between Efficiency and Risk Selection, November (Public
Economics).
DPS 97.24 Paul De Grauwe, Hans Dewachter and Dirk Veestraeten, Stochastic Process
Switching and Stage III of EMU, November (International Economics).
DPS 97.25 Dirk Heremans, Regulation of Banking and Financial Intermediation, November (Financial Economics).
DPS 97.26 Knud J. Munk, Agricultural Policy a Public Economic Explanation, November (Public Economics).
DPS 97.27 Hans Dewachter, Can Markov Switching Models Replicate Chartist Profits in
the Foreign Exchange Market? November (International Economics).
DPS 97.28 Paul De Grauwe and Frauke Skudelny, The Impact of EMU on Trade Flows,
DPS 98.01 Louis Baeck, Thematisation and Canon Building in Post-War Development
Studies, January (Development Economics).
DPS 98.02 Hans Dewachter and Hanno Lustig, Sticky Prices and the Nominal Effects of
Real Shocks, January (International Economics).
DPS 98.03 Ilse Frederickx, Health in Rural Tanzania: The Determinants of Health
Status, Health Care Demand and Health Care Choice, January (Development
Economics).
DPS 98.04 Paul De Grauwe, European Unemployment. A Tale of Demand and Supply, February (International Economics).
DPS 98.05 João Cocco, Francisco Gomes and Pascal Maenhout, Consumption and
Portfolio Choice over the Life-Cycle, March (Financial Economics).
DPS 98.06 Yunus Aksoy and Hanno Lustig, Circular Aspects of Exchange Rates and
Market Structure, January (International Economics).
DPS 98.07 André Decoster and Frederic Vermeulen, Evaluation of the Empirical Performance of Two-Stage Budgeting AIDS, QUAIDS and Rotterdam Models
Based on Weak Separability, April (Public Economics).
DPS 98.08 Erik Schokkaert and Luc Van Ootegem, Preference Variation and Private
Donations, April (Public Economics).
DPS 98.09 Erik Schokkaert, Mr. Fairmind is Post-Welfarist: Opinions on Distributive
Justice, April (Public Economics).
DPS 98.10 Dirk Van de gaer, Michel Martinez and Erik Schokkaert, Measuring
Intergenerational Mobility and Equality of Opportunity, April (Public
Economics).
DPS 98.11 Paulo Augusto Nunes, Testing the Validity of WTP values from a Contingent
Valuation Survey in Portugal, April (Public Economics).
DPS 98.12 Paulo Augusto Nunes, Measuring the WTP for Recreation and Biodiversity
Protection Programs, April (Public Economics).
DPS 98.13 Laurens Cherchye and Tom Van Puyenbroeck, Learning from Input-Output Mixes in DEA: A Proportional Measure for Slack-Based Efficient
Projections, February (Public Economics).
DPS 98.14 Jerzy Mycielski and Yohanes Riyanto, On the Interaction between Taste and
Distance and Its Implications on the Vertical Distribution Arrangement, May
(Financial Economics).
DPS 98.15 Jerzy Mycielski, Yohanes Riyanto and Filip Wuyts, Product Differentiation
and the Equilibrium Structure of the Manufacturer-Retailer Relationship,
DPS 98.17 Pramila Krishnan, Tesfaye Gebre Selassie and Stefan Dercon, The Urban
Labour Market During Structural Adjustment: Ethiopia 1990-1997, April
(Development Economics).
DPS 98.18 Bart Capéau and Stefan Dercon, Prices, Local Measurement Units and Subsistence Consumption in Rural Surveys: An Econometric Approach with
an Application to Ethiopia, March (Development Economics).
DPS 98.19 Stefan Dercon and Pramila Krishnan, Changes in Poverty in Rural Ethiopia
1989-1995: Measurement, Robustness Tests and Decomposition, March
(Development Economics).
DPS 98.20 Jenke R. ter Horst, Theo E. Nijman and Marno Verbeek, Eliminating Biases in Evaluating Mutual Fund Performance from a Survivorship Free Sample,
June (Econometrics).
DPS 98.21 Hilke Vandenbussche and Jozef Konings, Globalization and the effects of national versus international competition on the labour market. Theory and
evidence from Belgian firm level data, August (Financial Economics).
DPS 98.22 Wim Moesen and Laurens Cherchye, The Macroeconomic Performance of
Nations Measurement and Perception, August (Public Economics).
DPS 98.23 Anneleen Peeters, Interim Employment and a Leading Indicator for the
Belgian Labour Market, September (International Economics, IERP 137).
DPS 98.24 Wessel Marquering and Marno Verbeek, An Empirical Analysis of Intertemporal Asset Pricing Models with Transaction Costs and Habit
Persistence, September (Econometrics).
DPS 98.25 Filip Abraham and Joeri Van Rompuy, Is Belgium ready for EMU? A look at
national, sectoral and regional developments, September (International
Economics, IERP 138).
DPS 98.26 Sara Ochelen, Stef Proost and Kurt Van Dender, Optimal Pricing for Urban
Road Transport Externalities, September (Public Economics).
DPS 98.27 Knud Munk, Optimal Support to Low-skilled Households, July (Public Economics).
DPS 98.28 Wim Moesen and Philippe Van Cauwenberge, The Status of the Budget Constraint, Federalism and the Relative Size of Government: A Bureaucracy
Approach, September (Public Economics).
DPS 98.29 Laurens Cherchye, The Measurement of Macroeconomic Performance:
Comparison of DEA-Based Alternatives, August (Public Economics).
DPS 98.30 Jürgen Janssens, Volatility and Risk Premia on Belgian Secondary Long Term
DPS 98.32 Inge Mayeres and Stef Proost, Marginal Tax Reform, Externalities and
Income Distribution, (Public Economics).
DPS 98.33 André Decoster and Guy Van Camp, The unit of analysis in microsimulation
models for personal income taxes: fiscal unit or household? (Public
Economics).
DPS 98.34 Paul De Grauwe, Hans Dewachter and Yunus Aksoy, The European Central
Bank: Decision Rules and Macroeconomic Performance, (International
Economics).
DPS 98.35 Laurent Franckx, The use of ambient inspections in environmental monitoring and enforcement when the inspection agency cannot commit itself to