Author(s) Lam, Kam-shing; 林錦成
Citation
Issued Date 2010
URL http://hdl.handle.net/10722/173708
Tones in Whispered Cantonese – An Acoustic and Perceptual Study
Lam Kam Shing
A dissertation submitted in partial fulfilment of the requirements for the Bachelor of Science (Speech and Hearing Sciences), The University of Hong Kong, June 30, 2010.
Abstract
Acoustic analysis and perceptual experiments were carried out to investigate the acoustical characteristics of tones in whispered Cantonese and to identify possible perceptual cues for tone identification. The isolated vowel /a/ embedded in a framing sentence produced by 20 (10 male and 10 female) native Cantonese speakers using modal and whispered phonation was recorded. Formant frequencies, duration and intensity of the vowels were measured from the samples using signal analysis software. During tone identification tasks, the speech samples were presented to 20 listeners who were native Cantonese speakers. The listeners were instructed to identify the tone of the target vowels in the presented sentences, based on which percent correct
identification of tones was calculated. Results of the study reveal the role of second formant, duration, average intensity and intensity contours in perception of Cantonese whispered tones. Speaker’s maneuvers in production of whispered tones were also discussed.
Introduction
Cantonese is a tonal language. Each word is defined by its segmental combination and lexical tone. The meaning of words of the same phonetic structure differs when produced at different tones. Lexical tones in Cantonese can be described by their relative pitch height (high, mid and low) and direction of pitch movement (rising, level and falling) (Bauer & Benedict, 1997). Acoustically, pitch height and movement correlate with the magnitude and change of fundamental frequency (F0) over time, which is physiologically determined by the rate of vocal fold vibration. Therefore, different lexical tones can also be contrasted by the specific F0 contour associated with each tone (Gandour, 1978, 1981). Many linguists adopted a description of pitch height and movement of the tones by using a five-point rating scale of perceived pitch (Chao, 1948), based on which the six lexical tones are recognized in Hong Kong Cantonese (So, 1996). They are thehigh level (55), high rising (25), mid level (33), low falling (21), low rising (23) and low level (22) (Bauer & Benedict, 1997). Although a high falling tone has been reported as a variance of the high level tone in some Cantonese speakers (Lau, 1977), this tone is not commonly found in Hong Kong Cantonese, especially in the younger generations (So, 1996).
During voiced speech production, vocal folds are set into vibration (Zemlin, 1988). The intricate coordinated control of the human phonatory system allows the different modes of sound production, including modal, falsetto, and vocal fry registers (Zemlin, 1988). A forth mode of phonation is known as whispered speech, which is an unvoiced speech register that is commonly used in a social context when a speaker tries to keep his/her voice “low”. Whispering is also adopted by individuals with voice problem who have difficulties in sustaining normal phonation (Morris & Clements, 2002). The major differences between whispered phonation and normal phonation lie in vocal fold configuration and the absence of or little periodic glottal vibration. Normal voicing is produced with adducted vocal folds, allowing subglottal air pressure to build
up in the subglottal region. Once subglottal pressure is sufficiently high (when it reaches the phonation threshold pressure), the adducted vocal folds are “blown” apart, followed by the escape of air stream from the subglottic region. Subsequently, subglottal pressure drops, allowing the vocal folds to remain adducted again. The cyclic building up and releasing of subglottal air pressure set the vocal folds into periodic vibration. Different from modal phonation, during whispered speech, the vocal folds are only slightly adducted with some abduction in the posterior one third of the folds, forming a triangular posterior chink in the cartilaginous glottis (Zemlin, 1988). Air stream from the lungs does not set the vocal folds into periodic vibration, as in the case of normal phonation. Instead, turbulence is created at the constricted glottis, resulting in a hissing noise that serves as the sound source of whispered speech (Solomon, McCall, Trosset, & Gray, 1989). Since periodic vocal fold vibration is lacking, the resulting whispered speech should be void of F0 information.
Previous studies have come to an agreement that F0 serves as the main perceptual cue of tone identification (Fok, 1974; Gandour, 1978, 1981; Lin & Repp, 1989). This implies that the primary perceptual cue for tone is no longer available in whispered voices. Yet, tonal language speakers appear to be able to correctly perceive lexical tones produced with whispered speech (whisper tones) in which F0 information is supposedly not available. It is not known how tones are perceived in whispered speech of a tonal language. Researchers tried to answer this question by using different approaches. In a perceptual study of whispered Mandarin, Miller (1934, as cited in Abramson, 1972) concluded that, with sufficient contextual cues, all four Mandarin tones were readily recognized by listeners who were also native speakers of Mandarin. Wise and Chong (1957) studied six speakers in repeating aloud 30 sets of whispered sentences, which were formed by thirty different critical words embedded in a carrier phrase, with the critical words grouped with identical phonetic structure and contrasted minimally by tones. They found that the
subjects were able to repeat the critical word with 62% accuracy in sentence context. Wise and Chong commented that the number of tonal homophone of the critical words was limited. He also noticed that some critical words were more familiar and semantically feasible to the subjects under the sentence context. Based on their observations, Wise and Chong concluded that
listeners’ perceptual accuracy in whispered Mandarin was only at chance level, and the error
pattern was inconsistent.
Jensen (1958) studied tone perception of whispered tones in four tonal languages: Swedish, Norwegian, Slovenian and Mandarin. Pairs of isolated words with minimally
contrasted by tones were introduced to native speakers of their respective languages. An average identification accuracy of 66% to 88% was found among the four languages. With the above-chance level of identification accuracy, Jensen concluded that tonal contrasts were preserved in whispered speech. He further compared the accuracy of tone perception among the four
languages and found significantly better perception scores in Swedish and Mandarin. Based on this, Jensen concluded that tonal information was better transmitted in some languages than in others.
Abramson (1972) examined the perceptual accuracy of whispered words and sentences produced in Thai. The average identification scores among the four sets of stimuli were 33.9% for isolated words and 52.8% for sentences. He concluded that tone identification of whispered words in Thai was poor and additional linguistic contexts were essential for the perception of tones in whispered Thai. A similar study of whispered Cantonese was carried out by Fok (1974). Lexical tones of a total of 42 isolated words were identified by five listeners who were native speakers of Cantonese, and an average identification accuracy of 16 % was observed. Fok summarized that tone misidentification was random and no pattern of confusion can be deduced. Fok further concluded that tonal identification in whispered Cantonese was impossible without
the help from F0 and other contextual cues.
In another study of whispered Cantonese by Cheung (2003), listeners were asked to identify different lexical tones produced in a frame phrase. Results showed an overall
identification accuracy of 22.3%, compared with the chance level of 17%. Significantly better performance was found in high rising, low falling, low rising and low level tones. She concluded that tone identification accuracy in whispered Cantonese was better than that suggested by Fok (1974). Cheung also commented that tone perception was better in syllables with a final consonant or with a diphthong. However, the relatively limited number of participants (six speakers and twelve listeners) and the relatively large number of dependent variables (tones, gender, syllable structure, and vowel type) in her study may have reduced the validity of her findings.
In addition to F0, researchers also attempted to identify other possible concomitant perceptual cues for whispered tones. Studies of normal speech had identified some concomitant features that may contribute to the perception of tones, such as duration (Fu & Zeng, 2000), amplitude (Ho, 1976) and formant frequencies (Fu & Zeng, 2000). Studies have been carried out in an attempt to confirm that these are also possible perceptual cues for whispered tones. Gait (1956, as cited in Abramson, 1972) suggested changes in vowel duration and adjustments of intensity might affect the perceived tone of whispered speech. This claim was supported by Abramson (1972) in a tone perception study of synthesized stimuli with F0 masked with white noise. The average identification accuracy was 53.8% for resynthesized word and 67.3% for resynthesized sentences. Based on the above-chance level performance, Abramson concluded that, in addition to F0, there are other concomitant cues that assisted correct perception of tone in Thai. Vowel duration and amplitude envelope were two possible features.
using a pure-tone oscillator by three listeners. Results showed a high correlation of second formant (F2) and the perceived tones. McGlone and Manning (1979) extended Thomas’s study
by asking 96 listeners to rank five whispered and modally-phonated vowels according to their pitches. They also found significant correlation between the perceived pitch of the stimuli and the mean F2 value. Cheung (2004) investigated the possible acoustic cues that may assist the perception of Cantonese whispered tones. Results of her study supported the previous claims that F2 and F3 are closely related to perceived pitch in whispered speech. However, the study failed to relate vowel duration to tone perception. Cheung explained that it was the difficulty in
measuring vowel duration and formant contour that might have affected the results of her study. Based on the above discussion, previous studies of both modal and whispered speech suggested that vowel duration, amplitude and formant frequency are possible concomitant cues for correct tone perception. Research studies have focused particularly on F2 and suggested a correlation between F2 and perceived pitch in whispered speech. However, how these features correlate with perception of whispered tone in Cantonese is still unclear. It is not known if and how the perceptual cues contribute to the correct identification of whispered tones. The present study investigated how tonal information is transmitted in whispered Cantonese by examining the acoustic characteristics of different Cantonese tones produced with whispered voices and modal voices. Possible concomitant cues such as formant frequencies, intensity and vowel duration were investigated. These findings were compared with results of perceptual tests to further investigate the role of the suggested cues and other possible cues in the perception of tones in whispered Cantonese.
Method
Participants
(mean age = 20.1 years) were recruited as speakers of the study. The speakers were students recruited from local universities. All of them had no known voice, speech and hearing problems. Another group of ten male and ten female native Cantonese young adults of ages between 19 and 24 years participated in the perceptual test. Mean age of the listeners was 19.4 years. The
listeners were also students from local universities. All listeners received test for normal hearing ability with pure-tone audiometry.
Speech Materials
The speech stimuli included the Cantonese isolated vowel /a/ produced with minimal tonal contrast, /a55/, /a25/, /a33/, /a21/, /a23/, /a22/. An isolated vowel was chosen in order to minimize the effect of syllable structure to the tonal perception (Cheung, 2003) and to facilitate easier measurement in acoustic analysis (Cheung, 2004). The corner vowel /a/ was selected
because of its articulatory steadiness (Johnson, 2003), which helped facilitate accurate acoustic
analysis of the speech samples. The isolated words was embedded in the carrier phrase [ŋɔ5
wui5 tʊk6 ___ pei2 nei3 thεŋ1] (I will read ____ to you) to ensure sufficient phonemic context
for tone perception (Abramson, 1972) and to avoid the intonation changes in sentence initial and sentence final that may affect pitch perception (Vance, 1976).
Recording
The recording took place in a sound-treated booth located at the Speech Science Laboratory of the University of Hong Kong. Intensity calibration was done prior to the actual recording takes place. Three 1000 Hz calibration pure-tone signals of 80, 100 and 120 dB were generated using the PRAAT program and played through a loudspeaker. The signals were recorded via a high-quality microphone. A sound level meter was placed side by side with the microphone to monitor the level of the calibration signals.
Labeled as tone 1 to tone 6, the six isolated vowels were introduced to the participants with demonstration prior to the recording. Six Cantonese words were associated with the six
tones for better illustration. The associated words fortone 1 (鴉, /a55/), tone 2 (啞, /a25/), tone 3
(亞, /a33/) and tone 6 (掗, /a22/) had identical pronunciation to target production. The associated
words for tone 4 (牙, /ŋa21/) and tone 5 (雅, /ŋa23
/) has similar pronunciation to the target
production except for the initial nasal consonant. Care was given to ensure that the participants learned to produce the target vowels in normal speech without tonal errors and without addition of initial consonants. The participants were allowed to practice the speech materials for as long as they needed. During the experiment, each vowel was produced five times in each phonation method, yielding a total of 60 sentences. In order to avoid the order effect, all vowels were randomized before the recording took place. The randomized sentences were presented to the participants in slides using the PowerPoint software. During recording, each participant was instructed to produce the target utterance in clear and comfortable loudness. The speech samples were recorded using a high-quality microphone (SM58, Shure) via a pre-amplification unit (MobilePre USB, M-Audio) by using the PRAAT program. A mouth-to-microphone distance of about 6 cm was maintained throughout the recording. In each trial, the experimenter
demonstrated the target production in normal speech before participant’s production. The participant was asked to repeat the phrase if the last trial was judged to be unsatisfactory by the experimenter, e.g., presence of audible voicing in whispered trials, addition of nasal consonant. The participant was also asked to judge his/her own production and to repeat for any trial judged to be unsatisfactory. For each target word, the three best recordings were selected for acoustic analysis and perceptual test. Upon completion of the recording, a total of 360 modal and 360 whispered samples were recorded from each participant.
Perceptual test
Before the perceptual experiment, the experimenter introduced the labels to be used for the six Cantonese tones to the participants. A practice session using modal stimuli was provided to ensure that the participants had good understanding of the tone labels. A second practice session using six whispered stimuli was provided to familiarize the participants with the experimental procedure.
The 720 speech samples selected from the recorded data corpus were used as test
materials for the perceptual experiment. Two out of three speech samples of each tone and mode of phonation from each speaker were randomly selected and used as perceptual stimuli, yielding lists of 480 stimuli (2 trials x 6 tones x 2 types of speech x 20 speakers). A new list of stimuli was generated for each listener. Each stimulus was presented twice to the listeners at a
comfortable loudness level (about 50 dB SPL) via a headphone connected to a desktop computer. Yet, the listeners were still allowed to adjust the volume of speech stimuli at anytime to achieve comfortable hearing level. Upon presentation of each speech stimulus, the listeners were asked to identify the tone perceived by entering the corresponding tone number on a keypad. To avoid fatigue, a five-minute break was provided after every 40 speech stimuli. The participants were allowed for breaks any time during the experiment when needed. The entire experiment lasted for about 1.5 hours.
Acoustic analysis
The recorded stimuli were analyzed by using PRAAT, which is a signal analysis system. Vowel duration, amplitude values and formant values were measured from the recorded speech samples by a wideband spectrogram and a waveform. The formant range setting of PRAAT was adjusted to eliminate outliners during formant calculation. Measurement of vowel duration was done manually based on the spectrogram by marking the first and last identifiable periods of the
vocalic segment.
Figure 1. A wideband spectrogram used to measure vowel duration.
Due to the absence of detectable pitch, the automatic pitch calculation algorithm of PRAAT was not applicable in current study. In addition, duration measurement based on visual inspection of the waveform yielded low reliability due to the low intensity and low signal-to-noise ratio. Alternatively, a marking procedure based on F2 as described by Francis, Ciocca, and Yu (2003) was adopted. Figure 1 shows a typical example of duration calculation of a whispered sample. As indicated in the Figure, the starting and ending points of vowels were determined based on the second and second-last points of steady-state F2 contour shown. This marking for duration calculation was found to be valid and reliable in previous studies (Francis, Ciocca, & Yu, 2003). With the vowel segment selected, the intensity and formant frequencies were extracted from the selected segment using a script prepared in PRAAT. The values obtained were stored in a series of data point contained within a .txt file, based on which the acoustical parameters were calculated.
Due to human involvement in the marking of vowel duration, intra-rater and inter-rater reliability measures were obtained to ensure accuracy of the measurement. A total of 72
recordings, accounting for 10% of the total samples, were randomly selected for re-measurement. The samples were re-analyzed by the experimenter to indicate intra-rater reliability. Another researcher who had knowledge of the PRAAT program served as the second experimenter. The measurements obtained from the first and second experimenters were compared and used to reflect inter-rater reliability.
Statistical analysis
The acoustic data was analyzed separately for phonation method (modal vs. whispered). A repeated-measure between-subjects design, with tone of the target syllable as an independent variable and various acoustical measurements as dependent variables was adopted. Repeated measure Analyses of Variance (rmANOVAs) were used to determine if different tones
demonstrated significances in the array of acoustical parameters, using an alpha level of 0.01. Post-hoc analyses were carried out if necessary. Further comparison was carried out to analyze the findings in perceptual test in tone 1. A repeated-measure design, with acoustical
measurements of speech samples as independent variable and perceived tone as dependent variables was used for the study.
Result
Reliability
The average absolute errors for intra- and inter-rater reliability were 1.2% and 1.3%, respectively, indicating strong agreement between the measurements. This also indicates that measurements made by the first investigator were reliable.
Acoustic Analysis
Average duration, intensity, SD of intensity, F1 and F2 values associated with speech samples produced using modal and whispered voices are shown in Table 1. Results of rmANOVAs
Table 1.
Mean Values of Duration, Intensity, SD of Intensity, and F1 and F2 values of modal and whispered tones. (N=720)
High level High rising Mid level Low falling Low rising Low level
M W M W M W M W M W M W Duration (ms) 376 383 371 390 390 417 332 351 389 400 399 400 Intensity (dB) 91.9 72.8 88.9 72.0 91.1 71.7 84.5 70.3 88.2 71.4 89.4 71.6 SD Intensity (dB) 3.4 3.8 3.0 3.1 3.1 3.4 4.1 3.8 2.9 3.3 3.1 3.6 F1 (Hz) 888 1073 908 1076 878 1058 925 1076 909 1082 979 1057 F2 (Hz) 1392 1584 1364 1532 1369 1537 1365 1495 1375 1518 1345 1507
Note. M - modal tones, W - whispered tones. SD intensity refers to standard deviation of average intensity of all samples of the same condition. N = 60 for each intended tone.
Table 2.
Summary of Significant Tonal Effect on Acoustic (N=720)
Mode High Level High Rising Mid Level
Low Falling Low Rising Low Level High Level Modal I D, I I, SD I, F2 Whisper SD, F2 F2 I, F2 I, F2 I, F2 High Rising Modal I D, I, F1 D, I, SD Whisper SD, F2 F1 D, I, F2 SD
Mid level Modal D, I, F1 D, I, SD, F1 I I, F2
Whisper F2 F1 D, F2 F2 Low falling Modal D, I D, SD D, I, SD D, I, SD D, I, SD, F1 Whisper I, F2 D, I, F2 D, F2 D, I D, I Low rising Modal I, SD I I D, I, SD I, F1, F2 Whisper I, F2 D, I Low level Modal I, F2 I, F2 D, I, SD, F1 I, F1, F2 Whisper I, F2 SD F2 D, I
Note. D, I, SD, F1 and F2 represent duration, intensity, standard deviation of intensity, first formant and second formant respectively. Each cell represents a pair of tone. For each tone pair, significant differences in acoustical measurements are marked by corresponding symbol (p < 0.01). N = 60 for each intended tone.
revealed significant differences in some acoustical measurements among different tones. Table 2 summarizes the significant differences found in the acoustical measurements among different Cantonese tones.
Duration. Average duration ranged from 332 ms to 399 ms for tones produced with modal phonation and from 351 ms to 417 ms for whispered tones. Duration of whispered tones was significantly longer than that of modal tones, [t (120) = -2.676, p = 0.008]. rmANOVA revealed significant effect of tone to measured duration in both whispered tones [F(5,15) = 5.384,
p < 0.001], and modal tones [F(5,15) = 12.549, p < 0.001]. Post-hoc analyses revealed that low falling tone was significant shorter than other tones except for high level tone in whispered voice (p < 0.01). A similar difference pattern was also found in modal samples (p < 0.01).
Intensity. Modal tones were associated with an average intensity from 84.5 dB to 91.9 dB, and whispered tones from 70.3 dB to 72.8 dB. Modal tones consistently demonstrated
significantly higher intensity than whispered tones among all six tones, with a narrower intensity range observed in whispered tones, [t(120) = 29.3, p < 0.001]. Generally speaking, intensity of modal tones followed the order: level tone > rising tone > falling tone, and among the level and rising tones, high and mid tones have higher intensity than the low counterparts. Similar pattern of intensity difference was observed in whispered tones. rmANOVA revealed significant effect of tone to measured intensity in both whispered tones [F(5,15) = 6.168, p = 0.002], and modal tones [F(5,15) = 57.465, p < 0.001]. Comparison shows that among the whispered tones, low falling tone had significantly lower intensity than all other tones except mid level tone (p < 0.01). Intensity of high level tone was higher than all the low tones (p < 0.01).
Comparable standard deviation values of intensity (SD intensity) were found between modal and whispered tones. They ranged from 2.9 dB to 4.1 dB for modal tones and 3.1 dB to 3.8 dB for whispered tones. rmANOVA revealed significant effect of tone to standard deviation
of intensity in both whispered tones [F(5,15) = 3.839, p = 0.003], and modal tones [F(5,15) = 6.283, p < 0.001]. Among whispered tones, significant differences were mainly found between level tones and rising tones (p < 0.01), and between low falling and other tones (p < 0.01).
Formant frequencies. In the present study, the first two formant (F1 and F2) values were measured. Compared with modal tones, significantly higher average F1 and F2 values were found in whispered tones [t(120) = -21.2, p < 0.001 and t(120) = -25.7, p < .0005 respectively]. rmANOVA revealed significant effect of tone to F1 in both whispered tones [F(5,15) = 6.283, p
< 0.001] and modal tones [F(5,15) = 5.693, p < 0.001]. Significant effect of tone to F2 was also spotted for whispered tones [F(5,15) = 21.976, p < 0.001] and modal tones [F(5,15) = 3.912, p = 0.003]. For whispered tones, the only significant F1 difference was between high rising and mid level tones, which was also found for modal tones. For F2 of whispered tones, the high level tone was significantly higher than other tones (p < 0.01). Significant F2 differences were also found between high or mid tones to low tones (p < 0.01). Fewer significant differences were found in modal tones, but the pattern of difference was generally the same as whispered tones.
Perceptual Characteristics
Perceptual accuracy of tones was indicated by the percent correct identification. As seen in Tables 3 and 4, the overall percent correct identification of tones was 31.32% for whispered tones and 93.73% for modal tones, both of which were above chance level (i.e., 16.6%) with the exception of whispered high level tone.
For modal tones, percent correct identification of low rising and low level tones was the lowest. More than 10% of the low level tones were incorrectly perceived as low level tones. Low rising tones were mainly misjudged as high rising tones (8.63%) and 5.13% of high rising tones perceived as low rising tones. Over 90% percent correct identification was observed for high
Table 3
Confusion matrix of perception of whispered tones.
Actual tone presenteda
High level High rising Mid level Low falling Low rising Low level
T one pe rc eived High level 16.25% 4.13% 6.88% 4.00% 5.25% 6.63% High rising 9.50% 34.75% b 6.50% 3.00% 27.50% b 4.75% Mid level 26.50% b 8.25% 23.13% b 8.25% 12.75% 19.38% b Low falling 21.00% b 11.63% 25.50% b 65.38% b 16.25% 35.25% b Low rising 9.25% 32.50% b 13.00% 4.63% 24.88% b 10.50% low level 17.50% b 8.75% 25.00% b 14.75% 13.38% 23.50% b
Note. Percent identification is calculated by the average percent identification of 20 listeners. Percent identifications above 16.67% are marked with b. Shaded cells represent percent correct identification of the respective tone. an = 800 for each actual tone presented
Table 4
Confusion matrix of perception of modal tones.
Actual tone presenteda
High level High rising Mid level Low falling Low rising Low level
T one pe rc eived High level 99.25% b 0.13% 2.00% 0.00% 0.00% 0.00% High rising 0.13% 93.75% b 0.00% 0.13% 8.63% 0.13% Mid level 0.63% 0.13% 93.75% b 0.00% 1.38% 10.63% Low falling 0.00% 0.00% 0.50% 99.63% b 0.25% 1.13% Low rising 0.00% 5.13% 1.13% 0.00% 88.00% b 0.13% low level 0.00% 0.75% 2.63% 0.25% 1.75% 88.00% b
Note. Percent identification is calculated by the average percent identification of 20 listeners. Percent identifications above 16.67% are marked with b. Shaded cells represent percent correct identification of the respective tone. an = 800 for each actual tone presented
level, high rising, mid level and low falling tones.
For whispered tones, percent correct identification of low falling tones was the highest among all other tones. Surprisingly, 29% of all the tones were (correctly or incorrectly)
perceived as low falling tones. Accuracy of high level tone perception was slightly below chance level, the lowest among all whispered tones. Similarly, high level tone was incorrectly perceived most of the time; only 7.19% of the tones were perceived as high level tone. An analysis of the confusion pattern of whispered tones reveals that low rising tones were often perceived as high rising tones, and the three level tones were often perceived as mid level, low falling and low level tones.
Discussion
Acoustical characteristics associated with Cantonese tones
The present study investigated how Cantonese tones produced using modal and
whispered voices are perceived by examining the associated acoustic measures and perceptual accuracy. Differences in duration, intensity and formant frequencies were found among different modal tones, suggesting that beside F0, other perceptual cues are likely present to help identify different tones.
By examining the various acoustical measurements, it is found that differences between whispered tones are less prevalent than modal tones. This implies diminished acoustical
discrepancy between different tones produced using whispered voices. Many acoustically different tones have become more “similar” and not as contrastive when produced with
whispered voices. It follows that perception of whispered tones should be more difficult and error-prone, and it becomes more difficult for listeners to identify whispered tones correctly.
According to the present data, whispered voices are associated with longer duration, lower intensity, and higher formant frequency than modal voices. Such differences between
modal and whispered phonation may be related to the different physiologies involved during tone production. Speaker’s adjustment during whispered phonation may also account for some of the differences. For example, some speakers may unconsciously have prolonged the vowels and elevated F2 by adjusting their articulatory gesture during whispered phonation. Such
idiosyncratic adjustments have been referred to as “maneuvers” in previous studies (Abramson, 1972). In previous studies, maneuvers of articulatory movements were observed by comparing whispered and modal voices (Mansell, 1973; Peterson, 1961). Differences between whispered and modal voices found in current study also demonstrated the effect of speaker’s maneuvers in production of whispered phonation. Speakers may have enhanced the perceptual accuracy of whispered tones unconsciously through these adjustments in their production. The possible maneuvers and their effect is discussed below.
Duration. According to Schwartz (1971), there is a greater leakage of air during
whispered phonation from the posterior glottal chink. It follows that whispered tones should be associated with a shorter duration than their modal counterparts. However, a contradictory finding is observed in the present study; whispered tones were generally longer in duration than modal tones. Such finding is consistent with Cheung (2004). The longer whispered tones might indicate speakers’ intentional prolongation of whispered tones, in order to better transmit linguistic information to listeners. This change in duration appears to be a compensatory
behavior to absence of pitch information, and to loss of information due to the reduced signal-to-noise ratio condition in whispered voices. Speakers unconsciously extended the duration in an attempt to provide more information to signal whispered tones.
The current data also suggests an interrelationship between tones and duration. In modal tones, low falling tones were significantly shorter than other tones. A similar tone-duration relationship was observed in whispered productions. With the exception of high level tone, the
low falling tones were consistently shorter than the other tones. This indicates that, despite using whispered voice, similar tone-duration relationship was maintained in whispered tones.
Intensity. As expected, whispered tones were generally softer than their modal counterparts. The reduced intensity in whispered tones may be related to the physiological change during whisper production. Vocal folds are not completely adducted during whispered phonation, leaving a posterior glottal chink is observed which causes a leakage of air during whispered phonation (Zemlin, 1988). This is reflected aerodynamically by the lower glottal resistance in whispers (Hoit & Hixon, 1987). As a result of the air leakage, subglottal pressure that is required for forceful vocal fold opening cannot be easily maintained. The extent and amplitude of vocal fold vibration is thus greatly reduced, if any, rendering the intensity of whispered voices sharply diminished. This may be why whispered tones are generally produced with a reduced intensity than modal tones.
In addition, a tone-intensity relationship is observed in current study. In general, intensity of high and mid tones was higher than that of low tones in modal voice. This tone-intensity relationship was also observed in whispered tones, with a reduced contrast. It is possible that the low signal-to-noise ratio associated with whispered voices had led to a diminished intensity contrast. The consistent intensity contrasts found in modal and whispered tones suggest a possible role of intensity in identification of tones.
Besides the tone-intensity relationship, the present data indicates similar SD intensity in whispered tones, despite the generally diminished intensity associated with whispered tones. This may imply that speakers intentionally maintain a comparable amount of variation in intensity for whispered tones.
Formant frequency. The present finding of higher F1 and F2 values associated with whispered voices is in line with that reported in previous studies (Kallail and Emanuel, 1984a, b;
Peterson, 1961; Traunmüller & Eriksson, 2000). Such formant differences indicated an adjustment in speaker’s articulatory configuration during production of whispered tones. It is possible that speakers were unconsciously making use of these adjustments to maintain
intelligibility of their whispered speech. Traunmüller and Eriksson (2000) also reported increases in F1 and F2 values in both whispered and effortful speech. They suggested that such formant change was the result of speaker’s elevated effort in increasing audibility of their speech. Results from the current study also support this suggestion. Apparently, further studies focusing on the manipulation of F2 and possibly other higher formants are needed in order to verify the
suggested notion.
The average F2 value of high level whispered tone was higher than that of other tones. The elevated F2 associated with high level tone was not found in phonated tones. The presence of such additional F2 contrast in whispered tones was possibly a result of speakers’ adjustment to maintain pitch height contrast among different whispered tones. Previous studies using
synthesized materials suggested the correlation between F2 value and perceptual pitch height of whispered tokens (Thomas, 1969; McGlone & Manning, 1979). In phonated speech, pitch height information is efficiently transmitted through F0 contours (Gandour, 1978, 1981). F2 contrast thus becomes redundant in conveying pitch height information for accurate tone perception. However, for whispered voices where clear F0 contour was not available, it is likely that speakers compensate the loss of pitch height information by exaggerating the F2 contrasts, as a result of which F2 contrasts were found to be more prominent in whispered tones. This possible explanation of apparent F2 contrast among whispered tones is also supported by another trend of F2 contrast observed. In whispered tones, high and mid tones were found to have higher F2 compared to low tones, whereas similar contrast exists in the F0 values in modal tones (Khouw & Ciocca, 2007). This finding also supports the possibility of the speakers’ use of F2 contrast to
compensate the loss of F0 contrast.
The relationship between tone and F1 was not prominent in both whispered and modal tones. Previous studies demonstrated a weak relationship between F1 and perceptual pitch of whispered voices when compared with F2. The present finding also suggests that F1 did not provide significant contrast between tones. The role of F1 as perceptual cue for whispered tone perception may be restricted to only certain tone pairs.
Perception of Tones
In a tonal language such as Cantonese, accurate tone perception is crucial for effective daily communication. The present data reveals that tonal perception was not perfect even for tones produced using modal phonation by native Cantonese listeners, as indicated by the percent correct identification of tones (See Table 4). This shows that contextual cues play an important role in accurate tone perception during daily conversation, as target words used for the
perceptual study were isolated vowels that were not contextually related to the carrier phrase. It is likely that when tones are isolated from the context, they cannot be perfectly identified even by native Cantonese speakers. For modal tones, high percent correct identification was found (generally above 90%), with the exceptions of low rising and low level tones. This finding agrees with previous studies (Lee, Ching, Chan, Cheng & Mak, 1995). Pattern of listeners’ errors was revealed by the confusion matrix, as noticeably higher identification rate were found for some tones. The identification rate, although much lower than chance level, suggested traces of confusion pattern between the rising tones and between mid and low level tones. These traces will be further discussion in followings.
Identification of whispered tones revealed different findings. Although at a rate not as high as modal tones, correct identification of whispered tones was well above chance level. In fact, the percent correct identification was higher than data reported by Fok (1974) and Cheung
(2003). A possible reason for the higher identification rate may be related to the use of isolated vowel in this study. Cheung (2003) suggested that syllable structure has an effect on the perceptual accuracy of whispered tones. The use of isolated vowels in the current study may possibly reduce the distraction and interference caused by the presence of differing initial and final consonants, facilitating correct identification of whispered tones.
Table 3 illustrates the pattern of confusion of whispered tones. Different confusion patterns were observed in rising and level tones. Yet, low falling tones were consistently perceived with high accuracy. The relationship between acoustic characteristic and confusion pattern of whispered tones is revealed by comparing Tables 2 and 3. If the acoustic measures were all effective perceptual cues for correct tone perception, confusions should only be
observed in tone pairs with no significant contrasts in any of the measurements. The findings in rising and falling tones support this deduction, suggesting that some acoustic features were possible cues for the perception of these tones. Yet, findings in level tones are complicated. By comparing Tables 2 and 3, no direct relationship between the acoustic contrast and perceptual performance was observed. The role of different acoustical parameters in the perception of rising, level and falling whispered tones will be further discussed in the following.
Rising Tones. The rising tones were fairly distinguishable from the level and falling tones. This suggested that, at least in some of whispered tones, pitch movement contrast of rising tones was transmitted. If this holds, a consistent acoustic feature, which acts as the perceptual cue for pitch movement, should be found in both rising tones. Such feature was not identified among the measurements included in current study, suggesting that additional feature may present as the perceptual cue for tone perception. A possible acoustic cue was suggested by Fu and Zeng (2000) in studying Mandarin Chinese modal tones. They found that amplitude contours, which are the changes of amplitude across the vocalic duration, closely resembled pitch movement. It is
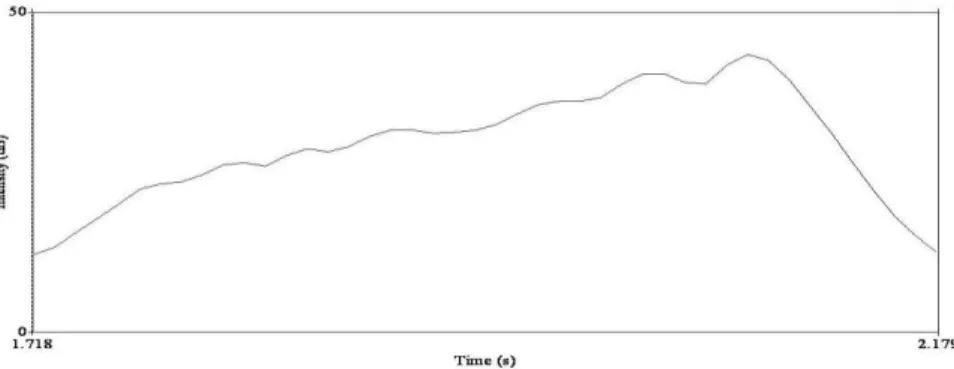
possible that if amplitude contours are retained in whispered speech, they may act as perceptual cues for pitch movement in the absence of F0. Figure 2 shows the intensity-time graph of a typical whispered high rising tone. The movement of intensity throughout the vocalic duration resembled the F0 movement observed in phonated rising tones described in previous studies (Khouw & Ciocca, 2007). However, a similar rising pattern was rarely observed in other whispered tones, suggesting that a contrast provided by the unique intensity contour exists between rising tones and other tones. This contrast may function as a perceptual cue that
distinguishes rising tones from level and falling tones. However, this suggestion is only based on typical intensity contour observed by visual inspection of voice samples. Variability of intensity contour and significance of the contrast are not accounted for in current study. The reliability and efficiency of this cue to tone perception need to be further studied.
Figure 2. Intensity-time graph of a typical sample of high rising tone.
Confusion matrix reveals confusion between two rising whispered tones, which resemble the trace of confusion noticed in modal tones. Comparing between two rising whispered tones, perception of high rising tones was better. This difference is predictable from Table 5. It is likely that significant differences in F1, F2 and SD intensity between high rising tones and other tones assisted in the correct perception of high rising tones. Such acoustic measurements was less prominent in low rising tones, making the tone less accurately identifiable compared to other tones.
Low Falling Tone. The whispered low falling tones yielded noticeably higher
identification rate, which is predictable considering the relatively adequate acoustic contrasts present (See Table 2). The short duration, low intensity and low F2 associated with the tone were likely to contribute to its more accurate identification.
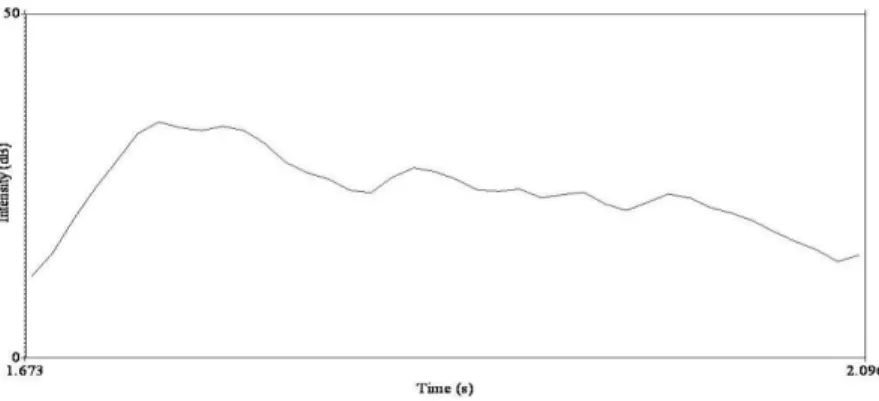
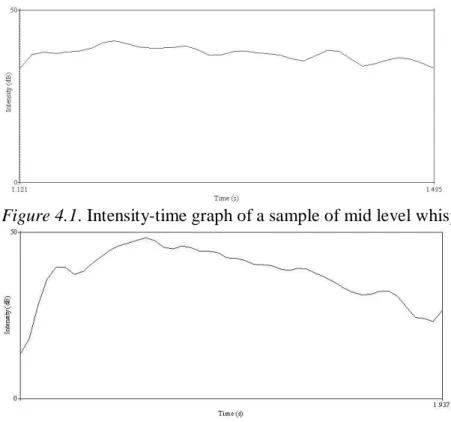
However, although many low falling tones were accurately identified, level and falling tones were not readily distinguishable. A possible reason of this is the influence of intensity contour. As discussed above, intensity contour is a possible perceptual cue for pitch movement in whispered tones. Listeners’ correct perception of low falling tones may rely on a falling intensity contour (See Figure 3), closely resembling the falling F0 contour of modal low falling tone (Khouw & Ciocca, 2007). Meanwhile, should a whispered level tone be correctly identified, a relatively flat intensity contours resembling a level F0 contour would be needed. Unexpectedly, flat and slight falling intensity contours were observed among the whispered level tone samples (See Figures 4.1 and 4.2). The similarity in intensity contours between whispered level and falling tones rendered correct perception of whispered level tones difficult. It is not surprising that, when listeners heard level tone samples, they were misled and tended to perceive them as falling tones. This observation once again suggested the relationship between intensity contours and pitch movement of perceived tone. Apparently this is preliminary, and further studies on this issue are needed to understand the role of intensity contours in whispered tone perception.
Figure 4.1. Intensity-time graph of a sample of mid level whispered tone.
Figure 4.2. Intensity-time graph of another sample of mid level tone
Level tones. According to Table 5, F2 appears to be the major acoustic contrast between the level tones. However, the pattern of perceptual confusion between the level tones seems to suggest that F2 contrast was not an effective cue for correct identification. Further analysis was done to compare the average F2 value of the level tones using one way ANOVA with perceived tones as grouping variables. Significant F2 difference was found between all three tones (p < 0.01). Samples that were perceived as high level tone had the highest F2, followed by mid level tone. The result suggested that listener’s perception of pitch contrast in level tones is guided by average F2 value, further supporting the relationship between F2 and perceptual pitch suggested in previous studies (McGlone & Manning, 1979; Thomas, 1969). It is likely that the perceptual confusion between level tones was caused by speaker’s limitation in producing prominent and consistent F2 contrasts.
Conclusion
The result of current study indicated that context-free whispered tones of Cantonese can still be identified with fair accuracy (31.32%). The above-chance level percent correct
identification of whispered tones in the absence of contextual cues confirmed earlier hypothesis that in additional to F0, tonal information in Cantonese was also transmitted by other acoustic features. Acoustical analysis of speech samples revealed that vowel duration, average intensity and F2 are possible perceptual cues for whispered tones. Among them, vowel duration and average intensity were found to be effective cues for perception of low falling tone. Average F2 was found to have a close relationship with pitch height of perceived tones, which agrees with findings in previous studies (McGlone & Manning, 1979; Thomas, 1969). Preliminary data in current study also showed a resemblance of intensity contours of whispered tones to pitch movement of the tones, suggesting intensity contours as a possible perceptual cue of pitch movement in whispered tones.
Speaker’s maneuvers were spotted by comparing the acoustical parameters of whispered and modal tones. Results suggested that speakers tend to lengthen duration and elevate formant frequencies during whispered phonation to make their productions more audible and intelligible.
Limitations of the present study and direction for further study
The current study only focused on a limited number of possible factors that may affect tone perception in whispered Cantonese. Other possibly contributing factors such as speaker’s gender, phonetic context and vowel type were not examined in great enough details. Future studies on these factors are needed to reveal a more complete picture of tone perception in Cantonese. The current study also suggested the involvement of speaker’s maneuver and the role of intensity contour in perception of whispered tones, but no empirical data could be provided to support the notions. Further studies are suggested to further investigate the two factors and their
effect to tone perception.
Several limitations are found in the use of recordings of human whispers in current study. Similar to previous studies, a great difficulty was faced in getting reliable measurements in acoustical analysis, mainly due to the instable nature of human whisper. Higher formants cannot be measured from the samples due to their high variability. Also, using recordings of human whisper, it is not possible to manipulate the acoustical parameters to study their effect on tone perception. A possible way to solve these problems is by the use of synthesized speech material in future studies. Previous studies on other areas have demonstrated the use of synthesized material is possible in the study of tones and whispered phonations (Abramson, 1972; McGlone & Manning, 1979; Thomas, 1969). Further studies of Cantonese whispered tones adopting similar methodology should yield promising results.
Acknowledgement
I am heartily thankful to my supervisor, Dr. Lawrence Ng, whose encouragement, guidance and support throughout the course of the project enabled me to explore the subject and express my ideas.
I would also like to offer my most sincere regards and blessings to my classmates, friends and family who supported me in any respect during the completion of the project. This project would not have been possible without their assistances, advices and participations.
References
Abramson, A. S. (1972). Tonal Experiments with Whispered Thai. In A. Valdman. (ed.) Papers in Linguistics and Phonetics. (pp. 32-44) The Netherland: Mouton & Co.
Bauer, R. S., & Benedict, P. K. (1997). Modern Cantonese Phonology. New York: Mouton de Gruyter.
Chao, Y. R. (1968). A grammar of spoken Chinese. Berkeley: University of California Press. Cheung, K. Y. (2004). An acoustic analysis of Cantonese whispered tones (Unpublished
dissertation). Hong Kong: The University of Hong Kong.
Cheung, Y. M. (2003). Recognition of lexical tones in Cantonese whispered speech
(Unpublished dissertation). Hong Kong: The University of Hong Kong.
Francis, A.L., Ciocca, V., & Yu, J.M.C. (2003). Accuracy and variability of acoustic measures of voicing onset. Journal of the Acoustical Society of America, 113(2), 1025-1032.
Fok, C. Y. Y. (1974). A perceptual study of tone in Cantonese. Hong Kong: University of Hong Kong Press.
Fu, Q. J., & Zeng, F. G. (2000). Identification of temporal envelope cues in Chinese tone recognition. Asia Pacific Journal of Speech, Language, and Hearing, 5, 45–57.
Gandour, J. (1978). Crosslanguage differences in tone perception: A multidimensional scaling investigation. Language and Speech, 21(1), 1-33.
Gandour, J. (1981). The nondeviant nature of deviant phonological systems. Journal of Communication Disorders, 14, 11-29.
Ho, A. T. (1976). The acoustic variation of Mandarin Tones. Phonetica, 33, 353-367.
Hoit, J. & Hixon, T. (1987). Age and speech breathing. Journal of Speech and Hearing Research,
32, 351-366.
Johnson, K. (2003). Acoustic and auditory phonetics (2nd ed.). Cornwall: Blackwell publishing. Kallail, K. J., & Emanuel, F. W. (1984a). Formant-frequency differences between isolated
whispered and phonated vowel samples produced by adult female subjects. Journal of Speech and Hearing Research, 27, 245-251.
Kallail, K. J., & Emanuel, F. W. (1984b). An acoustic comparison of isolated whispered and phonated vowel samples produced by adult male subjects. Journal of Phonetics, 12, 175-186. Khouw, E., & Ciocca, V. (2007). Perceptual correlates of Cantonese tones. Journal of
Phonetics,35, 104-117.
Lau, S. (1977). A Practical Cantonese –English Dictionary. Hong Kong: The Government Printer.
Lee, T., Ching, P. C., Chan, L. W., Cheng, Y. H., & Mak, B. (1995). Tone recognition of isolated Cantonese syllables. IEEE Transactions on Speech and Audio Processing, 3(3), 204-209. Lin, H. B., & Repp, B. H. (1989). Cues to the perception of Taiwanese tones. Language and
Speech, 32(1), 25-44
Mansell, P. (1973). An experimental investigation of articulatory reorganization in whispered speech. Working Papers, Institut für Phonetik und Sprachliche Kommunikation der Universität München Forschungsberichte, 2, 201-253.
McGlone, R. E., & Manning, W. H. (1979). Role of the second formant in pitch perception of whispered and voiced vowels. Folia Phoniatrica, 31(1), 9-14
Morris, R. W., & Clements, M. A. (2002) Reconstruction of speech from whispers. Medical Engineering and Physics, 24, 515-520
Peterson, G. E. (1961). Parameters of vowel quality. Journal of Speech and Hearing Research, 4, 10-29
So, L. K. H. (1996). Tonal changes in Hong Kong Cantonese. Current Issues in Language and Society, 3 (2), 186-189.
Solomon, N. P., McCall, G. N., Trosset, M. W., & Gray, W. C. (1989). Laryngeal configuration and constriction during two types of whispering. Journal of Speech and Hearing Research, 32, 161-174.
Thomas, I. B. (1969). Perceived pitch of whispered vowels. Journal of the Acoustical Society of America, 46(2), 468-470.
Traunmüller, H., & Eriksson, A. A. (2000). Acoustic effects of variation in vocal effort by men, women, and children. Journal of the Acoustical Society of America, 107(6), 3438-451. Vance, T. J. (1976). An experimental inverstigation of tone and intonation in Cantonese.
Phonetica, 33(5), 368-392.
Wise, C. M., & Chong, L. P. H. (1957). Intelligibility of whispering in a tone language. Journal of Speech and Hearing Disorders, 22(3), 335-338.
Zemlin, W. R. (1988) Speech and hearing science: Anatomy and physiology. Englewood Cliffs, New Jersey: Prentice-Hall.