WHITE PAPER
CONTENTS
INTRODUCTION
INDUSTRY CHALLENGES IN LOGISTICS
UNDERSTANDING BIG DATA
BUILDING A VALUE-DRIVEN BIG DATA STRATEGY
BIG DATA IN LOGISTICS
LOGISTICS AS A DATA-DRIVEN BUSINESS OPERATIONAL EFFICIENCY
CUSTOMER EXPERIENCE NEW BUSINESS MODELS
SUCCESS FACTORS FOR IMPLEMENTING BIG DATA ANALYTICS
OUTLOOK
LIST OF FIGURES
5
6
10
1112
12 16 18 21 2325
26
INTRODUCTION
DEAR READER,
Big Data Analytics has been recently dominating the headlines and it is surely one of the most influencing current trends in the world of information management. However, unlike many other topics that have shaken the IT industry in the past, it is not primarily driven by a discussion on technology. Admittedly disruptive technology approaches propel the performance of data processing to a new order of magnitude. But first and foremost, Big Data Analytics is about leveraging extensive information assets in order to enhance business process performance or to even create entirely new business models. Consequently, fully understanding Big Data always means to look at it in front of a particular business context.
In this respect, the logistics industry is a promising target for applying Big Data techniques as it heavily relies on extensive information flows. A timely and accurate delivery can only be assured if data travels ahead of every single shipment. On a global scale, the tracing of goods from origin to destination creates an enormous data set that fuels a variety of valuable Big Data use cases.
With the paper in hand T-Systems is proud to present a comprehensive analysis of Big Data applications along the logistics value chain. We elaborate a series of use cases that help to increase the efficiency of logistics operations or that enhance customer experience and loyalty. Moreover, opportunities for logistics providers to capitalize on their own information assets and to deploy innovative business models are discussed. Spotlights on successful real-world applications show what Big Data can achieve in logistics environments today.
In summary, the study provides a tool to logistics providers for navigating their journey towards an information-driven business. It has been jointly developed with the Solutions & Innovation department at Deutsche Post DHL and with experts from Detecon Consulting. The research team has combined world-class experience from both the logistics domain and the information management domain.
I now invite you to explore the game-changing power of Big Data Analytics for the logistics industry. Enjoy reading!
Yours sincerely,
The world is changing – faster and faster. The accelerated economic development across the globe has created entirely new business net-works and flows of goods. In the light of global competition, companies focus on core competencies and reduce their own vertical integration. In addition, variations of a particular product are ramped up to satisfy regional demand while at the same time the product lifecycle shortens. As a result, the complexity and dynamics of global supply chains are taken to a higher level. Customers require sophisticated services like just-in-time supplies, same-day delivery and dynamic shipment routing. In many vertical segments, logistics become a critical element of compe-titiveness and market success. In order to meet these rapidly changing requirements logistics providers have to master a number of challenges imposed by political, economic and demographic movements. Urbanization
More than half of the world’s population already lives in urban areas. Projections indicate that many regions will experience a continued growth of megacities in the coming decades, cf. figure 1. In these areas the density of deliveries will surge as will the traffic density and the occurrence of congestion. In order to further ensure timely delivery of shipments, logistics providers have to reshape their delivery process. Innovative solutions for the last mile and real-time guidance for optimized delivery performance have to be put in place to keep up with urban population growth.
In the same way as megacities grow, population density in remote areas will decrease. Consequently a dedicated delivery network in rural areas will be expensive to maintain as the cost per delivery is going up. In order to protect margins, logistic providers are forced to enter into partnerships. Shared networks and cooperative last mile delivery may become popular among CEP (Courier, Express and Parcel) companies in the future.
INDUSTRY CHALLENGES IN
LOGISTICS
FIG. 1, Source: “World Urbanization Prospects, the 2011 Revision”, United Nations Depart-ment of Economic and Social Affairs, 2012; cf. http://esa.un.org/unpd/wup/Analytical-Figures/Fig_1.htm. 0 10 20 30 40 50 60 70 80 90 [%] North America Latin America, Caribbean Europe
Oceania Asia Africa
1950 1960 1970 1980 1990 2000 2010 2020 2030 2040 2050
URBAN POPULATION BY MAJOR GEOGRAPHICAL AREA PER CENT OF TOTAL POPULATION
Volatility
Changing economic conditions are the “new normal”. The continuous transformation of operating models has become an imperative for enterprises in the light of changing demand, new competitors, substitute products, scarce resources as well as political and social developments. As major shifts in economy gain in size and geographical reach, global players must frequently scale their production up or down according to their volatile business environment. As a consequence, logistics providers are in turn facing high amplitudes in the demand for transportation services. The figure below illustrates that after a long period of steady growth the demand for freight capacity has become virtually unpredictable in recent years.
CUstomer expeCtations
Current research on logistics trends shows that market players are increasingly concerned about satisfying their customers’ expectations. Across different categories of firms, managers have ranked “meeting customer requirements” as their top priority, cf. figure below.
Why do customer expectations finally become of importance in logistics? Basically the effect originates at both ends of the supply chain. In the downstream direction, consumers have a heightened demand for flexible shipment options like self-collection, follow-me routing or same-day delivery. In this respect, consumers may even switch e-Commerce sup-pliers when experiencing poor delivery services. With an ever-increasing volume of goods ordered online and shipped directly to the consumer, there is a rising power on the recipient side that logistics providers have to consider. In the upstream direction, manufacturers and retailers are also increasingly demanding with regards to performance and agility of logistics services. Driven by the development of a global economy, companies are serving more regional markets and are sourcing from more different countries. Consequently the complexity of supply chain systems is growing while requirements for tight delivery windows stay unchanged. In addition industry-specific features like real-time tracking, cold chain management and shelf stocking are stretching the capabilities of logistics providers to the limit.
FIG. 3, Source: “Trends and Strategies in Logistics and Supply Chain Management”, p. 16, BVL International, 2013.
FIG. 2, Source: “EU Transport in Figures – Statistical Pocketbook 2013”, European Com-mission, 2013. 2000 1800 1600 1400 1200 1000 Road Sea 1997 1999 2001 2003 2005 2007 2009 2011
EU-27 PERFORMANCE BY MODE FOR FREIGHT TRANSPORT 1995 – 2011
[%]
0 5 10 15 20
meet customer requirement on-time delivery green logistics delivery time innovation csr logistics cost logistics quality schedule flexibility
PERCENTAGE OF LOGISTICS OBJECTIVES RANKED AS TOP PRIORITY
In order to constantly adapt to changing demand with regards to quantity as well as quality logistics providers have to enhance their strategic and operational capabilities. On the one hand a “breathing” infrastructure is required to quickly reshape network capacity and service performance. On the other hand means for comprehensive prediction of market and supply chain dynamics have to be established to anticipate changing economic conditions well in advance.
FIG. 4, Source: Detecon.
business layer
transaction layer
physical layer
logistics & production
networked business operating system
bank producer producer seaship insurer scanning data
rfid data rfid data scanning data
seaship
forwarder agent retail
end consumer
road transport distribution inland shipping
terminal
shipping line
ORCHESTRATION OF A BUSINESS NETWORK
Fragmentation and Complexity
Many logistics domains like road freight and supply chain solutions are highly fragmented markets. The majority of market participants owns a comparatively small market share and is limited to either geographical boundaries or vertical segments. Sub-contracting and collaboration exists but the level of standardization and business interoperability is low. In fact, many providers operate in a niche of industry or local knowledge. In contrast, globalization forces many logistics customers to expand the complexity of their operational model as part of their efforts to serve more markets with more product variations through different sales chan-nels. Subsequently the requirements for logistics services with regards to adaptability, scalability and localization are increasing. The complexity becomes even higher as the management of sustainability, governmental regulation and risk on a global scale are demanding.
How do logistics providers overcome the divergence that lies in the fragmentation of their own market landscape and a rising complexity of services to be delivered? The concept of smart business networks1
offers a solution to the problem. It is about the capability to quickly rear-range an operational model by orchestrating transactions and resources from a number of business partners, cf. figure below.
What differentiates a smart business network from just a partnership is the ability to execute this change in an agile and cost-efficient way. However it takes transparency, standardization and interoperability to rapidly interconnect complementary business functions across different companies. Successful logistics providers will master the development and adoption of a “networked business operating system” as a platform to link up business processes and create new modular services.
logistiCs and big data are a perFeCt matCh
It is obvious that neither bigger trucks nor faster trains are a relief from the challenges discussed above. Instead, transparency, foresight and res-ponsiveness are the key controls to successfully navigate the transition of the entire industry. In this respect the logistics sector is ideally suited to benefit from the technological and methodological advancements of Big Data Analytics. In its ancient Greek roots, logistics means “practical arithmetic2”, which gives a strong hint that mastering data was a key
factor in this discipline from the beginning. Today logistics providers manage a massive flow of goods and at the same time create vast data sets. For millions of shipments every day origin and destination, size, weight, content and location are tracked in order to efficiently operate the provider’s global delivery network. But does that fully exploit the value within this inexhaustible stream of data? Probably not.
Most likely there is a huge untapped potential for optimizing resources, improving customer experience or creating new business models. Moreover the integration of supply chain data streams from multiple logistics providers may overcome the current market fragmentation and enable powerful cooperative services.
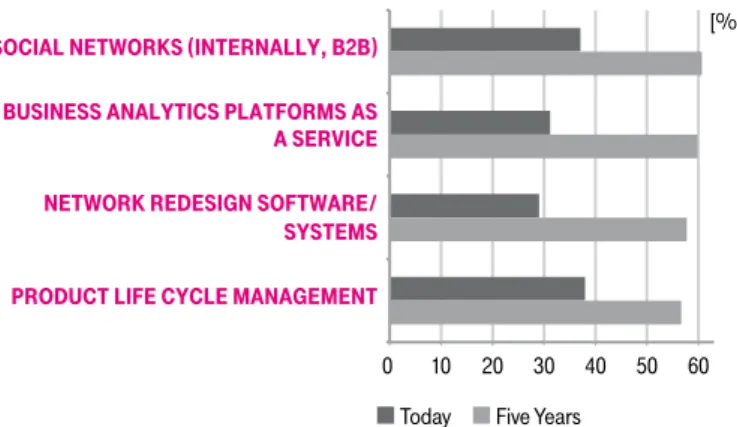
Many market players become aware of the fact that Big Data is a game-changing trend for the logistics industry. In a recent study on supply chain trends, sixty percent of the respondents stated that they are planning to invest in Big Data Analytics within the next five years3, cf.
figure 5. However, the quest for competitive advantage starts with the identification of strong Big Data use cases. In the course of this paper we first demystify Big Data Analytics and examine the value it is driving. Thereafter, a number of use cases specifically targeted at the logistics sector are discussed.
0 10 20 30 40 50 60
social networks (internally, b2b) business analytics platforms as a service network redesign software/ systems product life cycle management
Today Five Years
[%]
CURRENT AND PLANNED INVESTMENT AREAS FOR BIG DATA TECHNOLOGIES
2) “Definition and development”, Logistik Baden-Württemberg, cf. http://www.logistik-bw. de/Definition.411+M52087573ab0.0.html, (accessed Oct. 23, 2013).
3) „Trends and Strategies in Logistics and Supply Chain Management”, BVL International, 2013.
FIG. 5, Source: “Trends and Strategies in Logistics and Supply Chain Management”, p. 51, BVL International, 2013.
UNDERSTANDING BIG DATA
The sustained success of internet powerhouses like Amazon, Google and Facebook have provided evidence that there is a fourth production factor in today’s hyperconnected world. Besides resources, labor and capital, information has become a new frontier of competitive differentia-tion. Companies from every vertical sector are making efforts to trade gut-feeling for accurate data-driven insight in order to make thoughtful business decisions. No matter if it is an expected sales volume, the prefe-rence of customers for a specific product or next month’s work shift plan, data is the new oil that makes businesses successful. But like a quest for oil, it takes educated drilling before a well of valuable information is revealed.
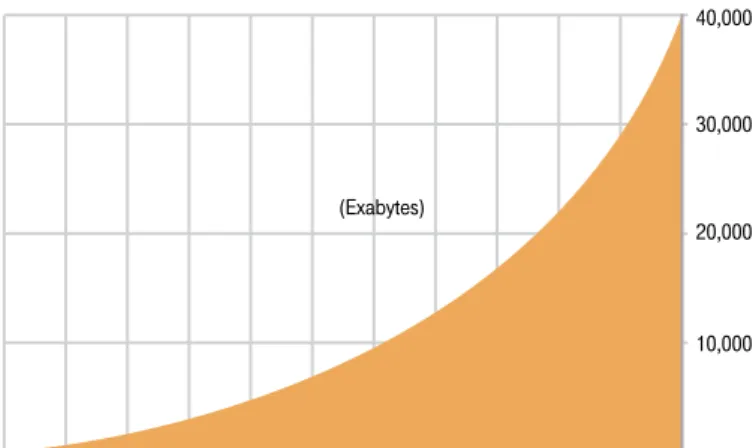
What makes the search for meaningful information so complex is the enormous growth of available data both inside companies as well as on the public internet. Social media, ubiquitous network access and a steadily increasing amount of smart connected devices have caused the number of available digital information pieces4 to pass the number
of stars in the universe5 back in 2008. Currently, the “digital universe”
expands at a speed of doubling the data volume every two years6, cf.
figure below. (Exabytes) 2009 2010 2011 2012 2013 2014 2015 2016 2017 2018 2019 2020 10,000 20,000 30,000 40,000
EXPONENTIAL GROWTH: DATA VOLUME INCREASES BY A FACTOR OF 50 BETWEEN 2010 AND 2020
In addition to the exponential growth in volume two further characteristics of data have substantially changed. Firstly, the vast majority of newly created data stems from camera images, video and surveillance footage, blog entries, forum discussions and e-commerce catalogues. All of these unstructured data sources contribute to a much higher variety of data types. Secondly, the massive deployment of connected devices like cars, smart phones, RFID readers, webcams and sensor networks adds a huge number of “autonomous” data sources. Those devices that conti-nuously generate data streams without human intervention increase the velocity of data aggregation and processing.
Volume, velocity and variety – is this Big Data? In literature, the “3V” have been widely discussed as the characteristics of Big Data Analytics. But in our opinion, for businesses to leverage information as a production factor and strengthen their competitive position there’s more to it than that. beComing an inFormation-driVen bUsiness
When Otto Retail Group started out to optimize their sales forecast accuracy7, the company was already capable of processing millions
of data records from the electronic storefront each day. Thus, handling a huge number of online orders at high speed was not the main issue. Instead, the key question Otto Group had to answer on the journey to significantly cutting excess stock by utilizing predictive analytics: “What additional value does the existing bulk of data carry and how can we capitalize on it?”
While consumers are used to make information-driven daily-life decisi-ons like purchases, route planning or finding a place to eat, companies are lagging behind. For exploiting their information assets companies have to – above all – change the attitude to how they use data. In the past data analytics have been used to confirm decisions that have already been taken. The cultural change largely consists of a transition towards a forward-looking style of data analysis that generates new in-sight and better answers. This shift in mindset also implies a new quality of experimentation, cooperation and transparency across the company. The second prerequisite for becoming an information-driven business is to establish a specific set of data science skills. This includes both mastering a wide spectrum of analytical procedures as well as a compre-hensive understanding of the business. Finally it takes new technological approaches to explore information in a higher order of detail and speed. Disruptive paradigms of data processing like in-memory databases or eventually consistent computing models promise to solve large-scale data analytics problems at economically feasible cost.
4) i.e. Bits, the smallest quantity of digital information. 5) „The Diverse and Exploding Digital Universe“, IDC, 2008.
6) „The Digital Universe in 2020: Big Data, Bigger Digital Shadows, and Biggest Growth in the Far East“, IDC, December 2012.
7) Cf. http://www.blue-yonder.com/en/otto-automated-merchandise-planning.html (accessed Nov 13, 2013).
Coming back to the introduction if information is the new oil every company already owns a lot of information wells, but most of their data is like crude. Unless it is refined it cannot be transformed into business value. Ultimately, Big Data Analytics comprise the attitude, skill set and technology it takes for a company to become a data refinery and create additional value from its own information assets.
BUILDING A VALUE-DRIVEN BIG DATA STRATEGY
In this respect, capitalizing on the value of information assets is a new strategic objective for most enterprises and organizations. Apart from internet powerhouses that have successfully established information-driven business models companies in other verticals are in an early stage of exploring how to benefit from their growing pile of data. According to recent research8 only 14% of European companies already address Big
Data Analytics as part of their strategic planning. In contrast almost half of the respondents expect a yearly data growth in their organization of more than 25%.
big data ValUe dimensions
When companies adopt Big Data as part of their business strategy the first question that surfaces is about what type of value Big Data is driving. Does it contribute to top or bottom line, or is it a non-financial driver? From a value point of view an application of Big Data Analytics falls into one of three dimensions, cf. figure below. The first and most obvious is operational efficiency. In this case data is used in order to make better decisions, to optimize resource consumption and to improve process quality and performance. It’s what automated data processing has always provided, but with an enhanced set of capabilities. Customer experience being the second dimension aims at increasing customer loyalty, at performing precise customer segmentation and at optimizing customer service. Covering the tremendous lot of data from public internet Big Data propels CRM techniques to the next evolutionary stage. Finally Big Data enables new business models to complement revenue streams from existing products or to create additional revenue from entirely new (data) products.
Depending on business priorities the identification and elaboration of Big Data use cases can be navigated by applying the above value dimensions. For all three dimensions, applications of Big Data Analytics specifically targeted at the logistics industry are discussed in the following chapter.
8) „Big Data Survey Europe“, BARC-Institute, February 2013.
[%] 0 15 63 23 14 30 45 60 no
has your company defined a big data strategy?
planned yes
75
BIG DATA AS A STRATEGIC OBJECTIVE IN EUROPEAN COMPANIES
FIG. 7, Source: Big Data Survey Europe, BARC, February 2013, p.17, Statistics from BARC study, n = 273.
operational
efficency experiencecustomer new businessmodels Usage of data in order to:
Increase Level of Transparency Optimize Resource Consumption Improve Process Quality and Performance
Exploit data for:
Increase customer loyalty and retention Performing precise customer segmentation and targeting Optimize customer interaction and service
Capitalize on data by:
Expanding revenue streams from existing products
Creating new revenue streams from entirely new (data) products VALUE DIMENSIONS FOR BIG DATA USE CASES
1. Optimization to the core
When seen individually most logistics services appear to be simple. From a functional point of view moving a parcel from origin to destination does not require a lot of planning. The complexity arises from the vast number of shipments and destinations, the deterministic lead time and the
finite amount of available resources. As a consequence the optimization of properties like delivery time, resource utilization and geographical coverage is an inherent challenge of large-scale logistics operations. But how good can optimization be without data? Information on payload, quantity, size, location, destination and many more are fundamentally required to control efficiency and service quality in a transport network. The earlier this information is available and the more precise the infor-mation is the better the optimization results will become. Therefore, the strong dependency of logistics operations on timely and accurate infor-mation is a key opportunity for Big Data to address. Advanced predictive techniques and real-time processing of events promise to provide a new quality in capacity forecasts and resource control.
2. Tangible goods, tangible customers
A number of vertical industries has sacrificed direct customer interaction in favor of standardi-zation and cost efficiency. Travel, banking and all kinds of commerce are increasingly using indirect channels for customer interaction, above all internet and mobile portals. Although this move
has inarguably driven down the cost of core sales and customer service processes it has at the same time abandoned a number of opportunities that result from a personal customer touch point. In contrast to flight booking or transfer of funds the transportation of tangible goods requires a direct communication at pick up and delivery. Apart from some auto-mation efforts mainly for parcel delivery, logistics providers largely stay in direct contact with their customer base. On a global scale, millions of customer touch points a day create a bi-directional communication link for market intelligence, product feedback or even demographics. Big Data concepts provide versatile analytic means as well as complementary data points from public internet sources in order to generate valuable insight on consumer sentiment and product quality.
BIG DATA IN LOGISTICS
1 6 3 9 1 6 3 9
Companies are learning to turn large-scale data amounts into competitive advantage. Precise forecasting of market demand, radical customization of services and entirely new business models are lighthouse examples for the exploit of untapped data sources. As current best practices touch many vertical markets it is reasonable that Big Data will also become a disruptive trend for the logistics industry. However, the application of Big Data Analytics is not obvious. The particularities of the logistics business have to be thoroughly examined first in order to discover valuable use cases.
LOGISTICS AS A DATA-DRIVEN BUSINESS
A kick-start for the discussion of how to apply Big Data to logistics is to look at its characteristics with regard to creating and consuming information. Which parts are heavily dependent on data? Where are opportunities to generate data in unmatched detail or accuracy? The answer to these questions highlights sector-specific areas where smart usage of data unleashes a new order of efficiency or a unique asset for monetization. For the logistics industry, five distinct properties make Big Data Analytics a viable instrument for competitive advantage.
3. In sync with customer business
The global expansion of markets and supply chains is further increasing – and with it increases the relevance of logistics services as a critical factor in a company’s operational procedures. Modern logistics solutions tailored to customer-specific requirements seamlessly integrate into
production and distribution processes in various industries. On the whole, the tight level of integration with customer operations let logistics providers feel the heartbeat of individual businesses, vertical segments as well as regional markets. Leveraging this comprehensive knowledge puts logistics providers in a unique position to become valuable advisors for their business customers. The application of analytic methodology re-veals supply chain risks and provides remedial action in case of disruption.
4. A network of information
A distinct asset of a logistics provider is the main-tenance of a transport and delivery network. This highly optimized infrastructure that constantly forwards goods around the globe is at the same time a high-resolution data source. Apart from using data for further optimizing the network itself
(cf. “Optimization to the core” above) it may also provide valuable in-sights to external parties. On an aggregated, macroscopic level logistics data has been used as an economic indicator already in the past. Today, applying the power and diversity of Big Data Analytics moves the level of observation down to a micro-economic viewpoint. A detailed analysis and segmentation of the global flow of goods is a powerful tool for every business to detect developing trends and changing conditions in any given market.
5. Global coverage, local presence
Another characteristic that separates logistics from many other industries is that decentralized operation is a necessity. Local presence is requi-red in order to serve customers at the starting point and endpoint of far-flung supply chains. Therefore, many logistics providers engage a fleet
of vehicles that moves across the country with blanket coverage in order to pick up, forward and deliver various types of shipments. When picking up shipments, why not picking up data at the same time? Automated collection and analysis of local information along the transport routes can create a valuable zoom display for demographic, environmental and traffic statistics. Google has been successful with its “Street View” service for providing local footage as a business model. However, creating this data required customized cars being sent to every single location. For global logistics providers, the ability to collect and monetize local data virtually comes for free.
1 6 3 9 1 6 3 9 1 6 3 9
The five characteristics above help to discover Big Data fields of appli-cation as they provide a roadmap to the unique information assets of a logistics provider. The next step is to identify specific use cases that exploit information value and contribute to operational efficiency, customer experience or to the development of new business models.
SPOTLIGHT: SMART PORT LOGISTICS
Intelligent deployment of innovative ICT solutions at the Port of Hamburg has improved end-to-end operations. Thanks to a real-time overview of the traffic situation at the site and on connecting motorways, the digital distribution of cargo documents and additio-nal services, trucks spend less time stopping and driving around unproductively. This lowers costs for all stakeholders. Moreover, despite having limited space, the port is now equipped to handle the forecasted increase in container transloading, thanks to greater process efficiency.
OPERATIONAL EFFICIENCY
A straight-forward way of applying Big Data Analytics in a business envi-ronment is to increase the level of efficiency in operations. Ultimately, it’s what IT has been doing forever: Acceleration of business processes. In this respect, Big Data Analytics simply opens the throttle.
last mile optimization
A constraint in achieving high operational efficiency in a distribution network occurs at the “last mile9”. This final hop in a supply chain is
often the most expensive one. In turn the optimization of last mile delive-ry is a promising application for Big Data techniques in order to drive down production cost. Two fundamental approaches make data a po-werful tool for increasing last mile efficiency. In a first rather evolutionary step a massive stream of information is processed to further maximize performance of a conventional delivery fleet. This is mainly achieved by real-time optimization of delivery routes. The second, more disruptive approach utilizes data processing to control an entirely new last-mile delivery model. Thereby, external transport capacity is aggregated in order to substitute dedicated resources by leveraging a scalable existing workforce.
Use Case #1: Real-time route optimization
The traveling salesmen problem has been formulated around eighty years ago, but it still defines the core challenge for last mile delivery. Route optimization on the last mile basically aims at saving time in the delivery process. Rapid processing of real-time information can support this goal in multiple ways. When the delivery vehicle is loaded and unloa-ded a dynamic calculation of the optimal delivery sequence based on sensor-based detection of shipment items frees the staff from manual sequencing. On the road telematics databases are tapped to automati-cally change delivery routes according to current traffic conditions. Finally, the routing intelligence considers availability and location infor-mation posted by recipients in order to avoid unsuccessful delivery attempts. In summary, every delivery vehicle receives a continuous adaptation of the delivery sequence that takes geographical and envi-ronmental factors as well as the recipient status into account. What makes this a Big Data problem? An execution of combinatorial optimiza-tion procedures that are fed from correlated streams of real-time events is required to dynamically re-route vehicles on the go. As a result, driving directions for the onboard navigation system are updated in an instant to guide the staff to the next best point of delivery.
Use Case #2: Consolidated pick up and delivery
Sharing infrastructures that do not contribute to the differentiation of a service has become a strong lever for increasing business efficiency. Telecommunications or railway networks are shared between a number of market participants that provide individual services on top of the same infrastructure. Applied to a distribution network the concept of a “Share Economy” may create substantial efficiency enhancements on the last mile. The idea is simple: Underused transport capacities like taxi, public transport and homecare fleets are aggregated to take over last mile delivery on routes that they are travelling anyway. Even a collaboration between competing logistics providers is an option to gain cost efficiencies. Scaling the number of these affiliates up to a critical mass of occasional carriers can effectively take load off the delivery fleet. Despite the fact that a consolidated pick up and delivery has to be incentivized it creates a potential to cut last mile delivery cost, especially in rural and sparsely populated areas. On the downside shared network approach also issues a vital challenge. The automated control of a large number of randomly moving delivery resources requires extensive data processing capabili-ties. That’s where Big Data techniques like complex event processing and geo-correlation come into play. A real-time data stream is traced in order to assign shipments to available carriers based on their respective location and destination. Interfaced through a mobile application affiliates publish their current position and accept pre-selected delivery assignments.
9) The term “last mile” has its origin in telecommunications and describes the last segment in a communication network that actually reaches the customer. Taken to the logistics sector, the last mile is a metaphor depicting the last leg within a supply chain where goods are handed over to the recipient. Source: “The definition of the first and last miles”, DHL Discover Logistics, cf. http://www.dhl-discoverlogistics.com/cms/en/ course/technologies/reinforcement/first.jsp, (accessed Oct. 23, 2013).
SPOTLIGHT: PLATFORM CEP (COMPLEX EVENT PROCESSING)
Complex Event Processing (CEP) is a new technology to analyze real-time streaming data. CEP engines handle poly-structured data streams from different sources (M2M, Sensor Data, Social Media, Traffic Data, Video Data, etc) in real time (< 20 µs) to detect defined data patterns (Events) and to react on in a predefined manner. The actions can be warnings, exception handlings or start of an automated new business process. CEP is an important part of the overall Big Data landscape.
SPOTLIGHT: CONNECTED CAR – TRAFFIC & DIAGNOSTICS
T-Systems Connected Car offers a platform-based big data solution that provides value-added services, opening up new opportunities for auto-owners and companies with a large number of vehicles. Data processing and storage takes place within the big data cloud.
Capture of data, e.g., diagnostics data and information from sensors (ambient temperature, rain sensor, fog lights, position/ speed, etc.)
Additional information such as road repairs, local weather reports and hazard warnings improve the driving situation and enable changes in delivery routes.
big data sources big data techniques big data usage Optimization to the Core
Telematics and traffic information services
Complex Event
Processing Real-time Sequencing and driving directions for delivery staff Scheduling of assignments for crowd-based pick up/ delivery
Real-time prediction of ETA (estimated time of arrival)
Geo-Correlation Combinatorial Optimization RFID tags attached to
delivery items Location data of recipients Sensors attached to delivery vehicles Data from order management and shipment tracking Position and status of delivery crowd members
1
6 3 9
LAST MILE OPTIMIZATION
The two use cases above illustrate approaches to an optimized last mile delivery process, but they are diametrically opposed. However, in both cases massive real-time data originating from sensors, external databa-ses and mobile devices is combined to operate delivery resources at a maximum level of efficiency. Apart from the advanced capabilities in data processing the pervasion of mobile technologies is another key enabler to these Big Data applications.
prediCtiVe network and CapaCity planning
The optimal utilization of resources is a key competitive advantage for a logistics provider. On the one hand excess capacities lower profitability which is critical for low-margin forwarding services. On the other hand a capacity shortage impacts service quality and puts customer satisfaction at risk. As a consequence a thorough planning of resources has to be performed both on a strategic and on an operational level. Whereas the strategic view focuses on the long-term configuration of the distribution network, the operational planning scales capacities up or down on a daily or monthly basis. For both perspectives Big Data techniques impro-ve planning results in their reliability and leimpro-vel of detail in order to per-fectly match demand and available resources.
Use Case #3: Strategic network planning
On a strategic level, the topology and capacity of the distribution network are adapted according to an anticipated future demand. The results from this stage of planning usually drive investments with long requisition and amortization cycles like warehouses, distribution centers or custom-build vehicles. Therefore, more precise capacity demand forecasts increase efficiency and lower risk for investments in storage and fleet capacity. Big Data techniques support network planning and optimization by analyzing comprehensive historical capacity and utilization data of transit points and transportation routes. In addition seasonal factors and emerging trends of freight flows are considered by learning algorithms that are fed with extensive statistical series. External economical data like industry-specific and regional growth forecasts are included for more accurate prediction of specific transportation capacity demand. In summary a much higher volume and variety of information is exploited by advanced regression and scenario modeling techniques to push the predictive value to a higher order. The new quality of planning results and the expansion of forecast periods effectively take the risk out of long-term obligations for infrastructure investments or contracted external capacities. In the reverse case that strategic planning exposes an impen-ding overcapacity an automated feedback accelerates the sales volume. This is achieved by dynamic pricing mechanisms or a transfer of overhead capacities to spot market trading.
Use Case #4: Operational capacity planning
On the operational level transit points and transportation routes have to be managed efficiently on a day-to-day basis. This involves capacity planning for trucks, trains or aircrafts as well as shift planning for person-nel in distribution centers and warehouses. Often operational planning tasks are based on historical averages or even on personal experience causing resource efficiency to be unsatisfactory. Instead, using the capa-bilities of advanced analytics the dynamics outside and within the distri-bution network is modeled and the impact on capacity requirements is calculated in advance. Real-time information about shipments that enter the distribution network, those in transit or those stored is aggregated to predict the allocation of resources for the next 48 hours.
FIG. 9
SPOTLIGHT: BUSINESS2CAR-PLATFORM
T-Systems offers a standardized and highly scalable Business2Car-Platform based on WSO2 (WSO2 is a provider of service oriented middleware platforms). The platform integrates a broad variety of telematic services like real-time traffic information, driver related services, car related services like remote update, e-mobility, content and safety & assistance. It is able to connect to the car-headunit as well as mobile handsets, OBD-adapters or telematic boxes. In connection with Deutsche Telekom’s secure connectivity worldwide, implemen-tation of know-how and enterprise mobility services Business2Car-Platform delivers the comprehensive solution for modern vehicles.
SPOTLIGHT: TELEMATIC ONE & ARRIVAL CONTROL
Telematic One from T-Systems is an integrated, vendor-independent portal for logistics service providers. Truckage companies can take advantage of having access to freight-specific data from both truck and trailer telematic systems in one application. With TelematicOne logistics companies have a central control unit for all their logistics activities, regardless of the manufacturer of the truck or the trailer. Even subcontractors who use a different telematics software, can be integrated.
Central monitoring of trucks, trailers or containers and parcels.
Order-related monitoring of vehicle and cargo data for arrival prediction.
Arrival Control App to communicate and monitor ETA (estimated time of arrival) in real-time.
Both Big Data scenarios above aim to increase resource efficiency in the distribution network, but the style of data processing is different. The strategic optimization combines a high data volume from a variety of sources in order to support investment and contracting decisions. In contrast, the operational optimization continuously forecasts network flows based on real-time streams of data.
The data is automatically sourced from warehouse management systems and sensor data along the transportation chain. In addition a detection of ad-hoc changes in demand is derived from externally available customer information, e.g., on product releases, factory openings or unexpected bankruptcy. Additionally local incidents are detected, e.g., regional disease outbreaks or natural disasters that skew demand figures for particular regions or products.
The look ahead on upcoming resource requirements helps operating personnel to scale capacity up or down in a particular location. But there’s more to it than that. A precise forecast also reveals upcoming congestions on routes or in transit points that cannot be addressed by local scaling. A freight aircraft that is working to capacity leaves any further expedited shipments behind at the airport of origin. Simulation results give an early warning to reassign shipments to uncongested routes and thus mitigate the local shortfall. In this respect the application of Big Data Analytics turns the distribution network into a self-optimizing infrastructure.
big data
sources big data techniques big data usage
Shipment data of Warehouse Management Systems Predicitve Analytics Scenario analysis Learning Systems Complex Event Processing Data mining for pattern detection Real-time Analytics Optimized transportation and delivery network planning Operational transportation capacity planning Operational workforce planning Shipment data of Transportation Management Systems Regional industry and trade growth forecasts Public news on regional incidents Customer data on product demand Weather data Optimization to the Core 1 6 3 9
PREDICITVE CAPACITY AND NETWORK PLANNING
CUSTOMER EXPERIENCE
The part of Big Data that currently catches the most attention is the acquisition of customer insight. For every business it is of vital importance to learn about customer demand and satisfaction. But with increasing business success the individual customer blurs into the anonymous crowd of a large customer base. Big Data Analytics help to win back individual customer insight and to create targeted customer value.
CUstomer ValUe management
Data from the distribution network carries a significant value for the analysis and management of customer relations. Enriched by public internet mining, Big Data techniques can be applied to minimize the attrition on the sender side as well as to understand demand on the receiver side.
FIG. 10
SPOTLIGHT: EFFICIENT FLEET MANAGEMENT
Efficient Fleet Management from T-Systems is a platform-based big data solution that cuts costs and protects the environment. It meets EU legislation requirements like 30% reduction of CO2 emissions by 2020. Optimization of shipments and routes means cost savings (fuel and operating costs).
Intelligent and transparent real-time collection of consumption and emission data through detailed vehicle information related to movement profiles which is compared with standard values to display deviations
Complete transparency of driving behavior and fuel consumption for each vehicle in order to maximize fuel efficiency by improving driving behavior
Supports multiple client systems (multitenancy), OEM-neutral hardware
Use Case #5: Customer loyalty management
For most business models the cost to win a new customer is by far higher than the cost to retain an existing customer. However, the fact that customer touch points become more and more indirect – through portals, apps and indirect sales channels – makes it difficult to trace and analyze individual customer satisfaction. As a consequence many businesses fail to establish effective customer retention programs. Again, it is the smart usage of data that enables the identification of valuable customers that are about to leave for the competition. Big Data Analytics allow a compre-hensive assessment of customer satisfaction by merging multiple exten-sive data sources. For a logistics provider this materializes in a combined evaluation of records from customer touch points, operational data on logistics service quality and external data. How do these pieces fit toge-ther? Imagine a customer that lowers shipment volumes while publishing sales records through newswire at the same time. In addition, delivery records show that the customer has recently experienced delayed ship-ments. Looking at the bigger picture of this information, the need for immediate customer retention activity becomes apparent. In order to create this insight on a large customer base, various data sources have to be tapped. Customer touch points include responses to sales and mar-keting activities, customer service inquiries and complaint management details. This digital customer trail is correlated with data from the distribu-tion network comprising statistical series on shipping volume and recei-ved service quality levels. Finally the internet also tells customer stories: Publicly available information from news agencies, annual reports, stock trackers or even sentiments from social media sites enrich the internal perspective on individual customers. From this comprehensive information pool the attrition potential for every single customer is extracted by applying techniques like semantic text analytics, natural language processing and pattern recognition. Pro-active countermeasures as well as customer loyalty programs are initiated based on automatically generated triggers.
Despite the fact that the business relationship usually relates to the sender side, loyalty management has to target the recipient side as well. Recipients are even more affected by poor service quality and their feedback influences the sender in selecting a shipment service. Especially in internet or catalog shopping recurring customer complaints let vendors consider a switch of the logistics provider. However, including recipients into loyalty management requires an even larger amount of data to be processed, especially in B2C markets. Big Data Analytics help to produce this integrated view on customer interactions and operational performance in order to keep senders and recipients satisfied.
Use Case #6: Continuous service improvement and product innovation
Collecting Customer feedback also provides valuable insight on service quality issues as well as on customer expectations and demand. There-fore it is the major source for continuous improvement of service quality and an important input for the ideation of new service innovations. To get solid results from evaluation of customer feedback it is necessary to aggregate information from as many touch points as possible. In the past ingests from CRM systems and customer surveys have been the single source of information. Today Big data solutions provide access to the gargantuan data volume stored in public internet sites. In social networks and discussion forums customers openly and anonymously share their service experience. However, extracting relevant feedback from natural language content created by billions of internet users by hand is like looking for a needle in a haystack. Sophisticated techniques like text mining and semantic analytics allow the automated retrieval of customer sentiment from huge text and audio repositories. In addition, the unsolicited feedback on quality and demand is broken down on region and time in order to identify correlations with one-time incidents or to track the effect of initiated actions. In summary, combing through the entire public internet brings unbiased customer feedback to light that empowers product and operational managers to design services properly to customer demand.
SPOTLIGHT: AFTERMARKET SOLUTION
T-Systems’ aftermarket solution is an innovative combination of a cloud platform, a smartphone app and a Bluetooth enabled OBD-adapter. It provides car repair shops and car manufacturers with a completely new way to interact with owners of used vehicles and to offer a far better service to their customers.
But also logistic companies can make use of the solution, which provides over 20 data points from cars like mileage, distance, error codes and battery charge. It enables the monitoring of each used vehicle in the fleet and its performance and reliability. Fleet Management get’s easier and better.
SPOTLIGHT: INTELLIGENT NEWS DISCOVERY
Businesses in every industry have vast amounts of unstructured data with tremendous potential – that they can make good use of. Petabytes of data are created every day. Intelligent News Discovery from T-Systems is a platform-based big data solution that enables you to find, index and analyze your media assets quickly and easily and to reduce decision uncertainty through more knowledge.
Analysis of up to 2 billion web pages and videos on a daily basis without own IT capabilities.
Indexing and semantic analysis of untapped information from audio and video material.
Based on thematic user queries, contextually relevant sections in the indexed data can be found und utilized immediately.
sUpply Chain risk management
Uninterrupted supply of direct material is essential to businesses that operate global production chains. Lost, delayed or damaged goods have an immediate negative impact on revenue streams. Whereas logistics providers are prepared to control their own operational risk in supply chain services, disruptions increasingly result from major events such as civil unrest, natural disasters or sudden economic developments10. To
anticipate supply chain disruptions and mitigate the effect of unforeseen incidents global enterprises seek to deploy business continuity manage-ment (BCM) measures11.
This demand for improved business continuity creates an opportunity for logistics providers to expand their customer value in outsourced supply chain operations. Rapid analysis of various information streams can be used to forecast events with a significant or disastrous impact on customer business. In response to arising critical conditions counter-measures can be initiated early to tackle arising business risks.
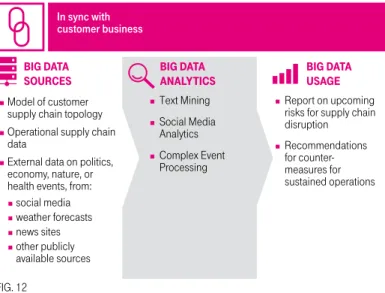
Use Case #7: Risk evaluation and resilience planning
Contract logistics providers know their customers’ supply chain in great detail. In order to cater to customer needs with regard to a predictive risk assessment, two things have to be interrelated. On the one hand, a mo-del describing all elements of the supply chain topology has to be conti-nuously checked against forces that can affect supply chain performance on the other. These checks require data from a plethora of sources on local developments in politics, economy, nature and health to be aggre-gated and analyzed. This data originates from social media, blogs, weather forecasts, news sites, stock trackers and many other publicly available sources. As most of this information stream is unstructured and continu-ously updated Big Data Analytics power the retrieval of meaningful input for detecting supply chain risks. Apart from semantic analytics it needs complex event processing techniques that detect patterns in a host of interrelated information pieces12. In case a pattern points to a critical
condition arising for one of the supply chain elements, e.g., a tornado warning for a region where a transshipment point is located, the custo-mer gets notified. The report contains probability and impact of the risk as well as suitable counter-measures that mitigate the potential disruption. This can lead to a re-planning of transport routes or to ramping up supplies from other geographies.
Robust supply chains that are able to cope with unforeseen events are a vital business capability in today’s rapidly changing world. On top of a resilient and flexible supply chain infrastructure it is the foresighted risk detection that keeps a business running when disaster strikes. Logistics providers are well-positioned to secure customer operations by performing predictive analytics on global affairs.
11) „Making the right risk decisions to strengthen operations performance“, Pricewater-houseCoopers and MIT Forum for Supply Chain Innovation, 2013.
12) “The Power of Events: An Introduction to Complex Event Processing in Distributed Enterprise Systems“, David C. Luckham, Addison-Wesley Longman, 2001. SPOTLIGHT: CONNECTED CAR – PREDICTIVE MAINTENANCE
Logistics companies face the challenge of unexpected break downs with costly standstills. Reactive maintenance is leading to high cost of operation. Predictive and pro-active maintenance based upon real-time in-memory Analytics leads to cost efficiency and customer satisfaction. The continuous evaluation of data enables to recognize the typical pattern for normal operation as well as patterns for deviations (errors). Based on these data, machines may be continuously monitored and possible deviations from normal operation are recognized early.
big data
sources big data techniques big data usage
Customer data e.g., shipping volumes in CRM systems
Data mining for pattern detection Semantic analytics Natural language processing Cluster analysis Data mining for pattern detection Geo-correlation Customer value assessment for business potential analytics Anticipation of customer attrition Continuous service improvement and identification of new product innovation requirement Data bases of financial
analyst firms Transport management systems for shipment records
Call center records Customer emails and feedback forms Social media like blogs or social networks
Tangible goods, tangible customers
CUSTOMER VALUE MANAGEMENT
FIG. 11
10) “Are you ready for anything?“, DHL Supply Chain Matters, 2011, cf. http://www.dhlsup-plychainmatters.dhl.com/efficiency/article/24/are-you-ready-for-anything, (accessed October 12, 2013).
big data sources big data analytics big data usage Model of customer
supply chain topology Text Mining Social Media Analytics Complex Event Processing
Report on upcoming risks for supply chain disruption Recommendations for counter-measures for sustained operations Operational supply chain
data social media weather forecasts news sites other publicly available sources External data on politics, economy, nature, or health events, from:
In sync with customer business
SUPPLY CHAIN RISK MAMAGEMENT
NEW BUSINESS MODELS
b2b demand and sUpply Chain ForeCast
The logistics sector has been a macroeconomic indicator for long. Global transportation of goods can act as a benchmark for future economic developments. The type of goods and the shipped volumes indicate regional demand and supply levels. The predictive value of logistics data for the global economy is constituted by existing financial indices measu-ring the macroeconomic impact of the logistics sector. Examples are the Baltic Dry Index13, a price index for raw materials shipped, and the Dow
Jones Transportation Average14, showing the economic stability situation
of the 20 largest U.S. logistics providers.
By applying the power of Big Data Analytics logistics providers have the unique opportunity to extract detailed microeconomic insights from the flow of goods through their distribution network. The huge digital asset that is piled up from the millions of daily shipments is exploited by captu-ring demand and supply figures in various geographical and industry segments.
Use Case #8: Market intelligence for small and medium-sized enterprises
The aggregation of shipment records comprising origin, destination, type of goods, quantity and value forms an extensive source of valuable market intelligence. As long as postal privacy is retained logistics providers may refine this data in order to substantiate existing external market research. The fine-grained information in the shipment data base signifi-cantly enhances the precision of conventional demand and supply fore-casts based on regression analysis. The resulting high predictive value makes the compound market intelligence a compelling service for exter-nal parties. In order to serve a broad range of potential customers the generated forecasts are segmented by industry, region and product category. Particularly small and medium-sized enterprises that do not have the capacity to conduct customized market research are the primary target group for this advanced data service.
13) “Baltic Dry Index“, Financial Times Lexicon, cf. http://lexicon.ft.com/Term?term=Baltic-Dry-Index, (accessed Oct. 23, 2013).
14) “Dow Jones Transportation Average”, S&P Dow Jones Indices, cf. http://www.djave-rages.com/?go=transportation-overview (accessed Oct. 23, 2013).
FIG. 12 SPOTLIGHT: PLATTFORM SAP HANA
Main memory plays a key role. In-memory technology is based on an innovative method of storing and managing data. All data is kept in a server’s main memory, eliminating time-consuming access to hard-drive systems. Database technologies with column based indexing and a hybrid data model (row- and column-based storage) are employed. This leads to data compression and significantly improves analysis capabilities. The bottom line: performance of transactional and analytical processes can be increased significantly.
SPOTLIGHT: PLATTFORM HADOOP
Big data would be inconceivable without Hadoop because it provi-des the foundation for processing extremely high and unstructured data volumes. Hadoop is a Java-based software framework that helps users handle compute-intensive processes on server clusters with large data volumes. With the help of Hadoop, applications can distribute complex computing tasks across thousands of nodes
and process data volumes in the petabyte range. Use Case #9: Financial demand and supply chain analytics
Financial analysts rely heavily on data to generate growth perspectives and stock ratings. Sometimes analysts even perform manual checks on supply chains as the only available source to forecast sales figures or market volumes. Therefore, access to the detailed information collected from a global distribution network is of particular value for the banking and insurance sector, for rating agencies and advisory firms. A commer-cial analytics platform that let a broad range of users slice and dice raw data according to their field of research is an option for logistics provi-ders to create new revenue streams from the huge amount of informati-on that cinformati-ontrols logistics operatiinformati-ons.
The application of analytic techniques to vast amounts of shipment data presented in the use cases above illustrates the implementation of infor-mation-driven business models for a logistics provider. In addition, the monetization of data that already exists adds highly profitable revenue to the company’s top line.
Use Case #11: Environmental intelligence
The continued growth of urban areas15 has caused both city planning
activities and environmental monitoring to become a matter of im-portance. Through the use of a variety of sensors attached to delivery vehicles logistics providers are enabled to produce rich environmental statistics. Data sets may include ozone and fine dust pollution, tempera-ture and humidity as well as traffic density, noise or parking spot utiliza-tion along urban roads. As all this data can be collected “en passant”, a data service offered to authorities, environment agencies and real estate developers creates complementary revenues that subsidize the mainte-nance of an extensive delivery fleet.
15) According to the United Nations, by 2050 85.9% of the population in developed countries will live in urban areas. Taken from: „Open-air computers“, The Economist, Oct. 27, 2012. cf. http://www.economist.com/news/special-report/21564998-cities-are-turning-vast-data-factories-open-air-computers (accessed Oct. 12, 2013). SPOTLIGHT: ADDRESS DATA QUALITY & VERIFICATION
Internationally operating businesses depend on correct customer or supplier addresses. Part of doing business worldwide is making sure that your databases are correct and in good quality. Companies have to face different languages, alphabets and spelling formats – especially in B2B and B2C cross-border traffic and e-commerce. Big Data address processing in realtime enables dynamic sorting, sequencing, routing and re-routing for logistics.
Direct match of input data with reference data.
Return incomplete or incorrect incoming data with validated data from database.
Significant increase of data quality for planning purposes and realtime route planning and optimization.
Prerequisite for a correct calculation of ETA (estimated time of arrival) of shipments and deliveries.
Use Case #10: Address verification
The verification of a customer’s identity and delivery address is a funda-mental requirement for online commerce. Whereas address verification is broadly available in industrialized nations, for developing countries and remote areas the quality of address data is poor. This is also due to the lack of a structured naming scheme for streets and buildings in many remote areas. Generated from daily freight, express and parcel delivery, logistics providers can automatically verify address data, store geographic coordinates and provide verification schemes as a premium service to retail and other businesses as well as to public sector entities.
SPOTLIGHT: SMARTER PROCUREMENT
Smarter Procurement from T-Systems is an end-to-end big data solution. It helps enterprises cut costs, shorten lead times and protect liquidity – throughout their organization, around the world. Cash flows can be forecasted and controlled proactively to gain a solid basis for judging and managing out-going payments. There is no need of high cash reserves “just in case” anymore, ratings and analyst reviews can be improved.
But the accurate prediction of lead times and generation of cost savings not only effect the procurement process but also the supply chain in total. The company can achieve visibility throughout the entire enterprise including the logistic value chain.
real-time loCal intelligenCe
Information-driven business models are frequently built upon existing amounts of data, but this is not a prerequisite. An established product or service can be extended as well in order to generate new information assets. For a logistics provider the opportunity for a complementary new business model emerges from the pick up and delivery of shipments. The constantly moving and geographically distributed fleet of vehicles maintains a local presence with blanket coverage that no other industry can provide. With the “Internet of Things” driving a continued miniaturi-zation of cameras, sensors and mobile connectivity a delivery vehicle can easily be equipped with devices that collect rich sets of information on the go. This unique capability enables a set of value-added data services that a logistics provider can present to existing and new customers.
big data sources big data techniques big data usage
Shipment data from logistics production (origin, destination, type of good, quantity, price)
External market intelligence sources
Regression analysis Data fusion and integration Predictive Modeling Cluster Analysis Statistics Time Series Analysis
Demand and supply forecast figures for different industries and regions Data analytics platform for financial analytics
A Network of Information
B2B DEMAND AND SUPPLY CHAIN FORECAST
SUCCESS FACTORS FOR IMPLEMENTING BIG
DATA ANALYTICS
Up to this point the discussion of Big Data Analytics has been focused on the value of information assets and how logistics providers can leve-rage data for better business performance. So far, so good, as solid use cases are a fundamental requirement for adopting new information-driven business models. But beyond assessing business value it is im-portant to notice that when it comes to implementation Big Data is not going to be like any other IT project. Five success factors have to be taken into account before getting serious.
bUsiness and it alignment
In the past advancements in information management have been clearly targeting either a business problem or a technology problem. While trends like CRM has been strongly affecting the way sales and service people work, other trends like Cloud Computing has been primarily giving headaches to IT people regarding how operate dynamic IT resour-ces across the internet. Consequently adopting capabilities and mana-ging change had to take place predominantly on one side. For Big Data Analytics this does not apply. For a successful transformation towards an information-driven company business and IT departments have to contri-bute with substantial changes in their respective environments. In this respect a strong alignment between business unit and IT department on objectives, benefits and risks of a Big Data use case is essential. There has to be a mutual understanding of the challenges as well as a joint commitment of knowledge and talent in order to complete a Big Data implementation.
data transparenCy and goVernanCe
Big Data use cases often build upon a smart combination of individual data sources that jointly provide new perspectives and insights. However the reality in many companies reveals three major challenges that have to be addressed to ensure a successful implementation. At first there has to be full transparency on information assets and ownership in order to locate data that is already available in the company. Secondly data attri-butes have to be clearly structured and explicitly defined across multiple data bases to prevent ambiguous data mappings. Finally strong gover-nance on data quality has to be maintained. Effective cleansing proce-dures must remove incomplete, obsolete or duplicate data records that otherwise compromise the validity of mass query results. It is of greatest importance that a high overall data quality has to be assured on the individual data sources as the boosted volume, variety or velocity of the joint data set inhibits efficient validation and adjustment procedures. There are numerous other local intelligence use cases exploiting the
ubiquity of a large delivery fleet. From road condition reports that steer plowing or road maintenance squads to surveys on the thermal insulati-on of public households logistics providers are in a head-start positiinsulati-on to become a search-engine in the physical world. Innovative services that provide all kinds of data in microscopic geographical detail equally attract advertising agencies, construction companies and public bodies like police and fire departments. Thereby, Big Data techniques that extract structured information from real-time footage and sensor data are building the technical backbone for the deployment of new data-driven business models.
big data
sources big data techniques big data usage
Vehicle-attached sensors and cameras Driver-collected data (e.g., adress data) Sensor data from mobile devices GPS location data Image/video recognition Ecent processing Statistics Cluster Analysis Geo-correlation
Microstudies for urban development, marketing, demo-graphic statistics, real-estate and construction industry Road condition screening Environmental monitoring Address verification Global coverage, local presence
REAL-TIME LOCAL INTELLIGENCE
FIG. 14
SPOTLIGHT: SMARTER ENERGY MANAGEMENT
Smarter Energy Management from T-Systems is a platform-based big data solution that verifies, aggregates and processes big data and turns it into actionable information. It provides businesses and private households with the information they need to increase their energy efficiency and to gain greater visibility into power usage in order to reduce their spending.
Meter Data Management is the link between technical systems for electronic meter reading / reporting and the economic management systems of actors in the market.
High-performance, parallel / distributed processing of data from 50 million virtual metering points.
Ad hoc processing of requests from the consumption data analysis over the entire dataset.
BIG DATA CUBE OF COMFORT: QUALITATIVE SELECTION OF BIG DATA TECHNOLOGIES
data priVaCy
The exploit of information assets frequently touches personal data, espe-cially when gaining customer insight is the target of the data analysis. In this case the adherence to data privacy regulations is compulsory. In countries with a strict data protection act in place particular use cases prove elusive due to data privacy rights. Thus, a consideration of regulations that apply is a given in the conceptual phase of every Big Data project. But legislation is not the only constraint. Even if the use case is compliant with prevailing law, a massive collection and exploit of data may arouse a public debate that subsequently damages company reputation and brand value.
data sCienCe skills
A key to a successful Big Data implementation is the mastery of the manyfold data analysis and manipulation techniques that turn bulks of raw data into valuable information. The skillful application of computational mathematics makes or breaks the generation of reliable and meaningful insights. In most industries the required mathematical skill is rather scarce. In fact a talent war has begun as more and more companies recognize that they have to source additional data science skills externally. For Big Data projects it is important to consider that deploying the right technique for a particular data processing problem requires very speci-alized knowledge.
teChnology Usage
Many data processing problems that are currently hyped as Big Data could have been technically solved five years ago. However, back then the required investment in technology would have shattered every busi-ness case. In the meantime not only raw computing power has exponen-tially increased but advanced data processing concepts have become available enabling a new dimension of performance at a fraction of cost.
The most prominent approaches are in-memory data storage on the one hand and distributed computing frameworks on the other. The downside of these new concepts is that they require entirely new technologies to be adopted. Thus, for IT departments the implementation of Big Data projects requires a thorough evaluation of established and new technology components regarding their capability to support a particular use case. For example in-memory databases like SAP’s HANA technology are very fast but limited in the data volume that can be stored. On the contrary, distributed computing frameworks like Apache Hadoop are able to scale out to a huge number of nodes but at the cost of a delayed data consi-stency across multiple nodes. In addition, earlier investments in conventi-onal technologies have to be taken into account as they may also be scaled up for higher performance.
The figure below illustrates a scheme that helps selecting Big Data tech-nology options. Depending on requirements of a use case regarding volume, velocity and variety of the processed data, it will be placed into one of eight technology cubes.
Use cases that get along with technology that is already in place (Number 2,3,7 and 10) are positioned in the blue cube. If the require-ments for a use case regarding the volume, velocity or variety of data exceed the performance boundaries of the blue cube they are placed in the adjacent orange cubes. Each cube represents the application of a technology set that satisfies the respective requirements.
The schema above provides generic guidance on major concepts that most Big Data technologies follow. For selecting a particular product or product family the individual features have to be analyzed in more detail.
Real-Time Route Optimization Consolidated Pick up and Delivery Strategic Network Planning Operational Capacity Planning Customer Loyality Management Continuous Service Improvement Risk Evaluation and Resilience Planning
Address Verification Market Intelligence for SME
Environmental Intelligence
Financial Demand and Supply Chain Analysis
blobs scale up external storage in-memory storage scale out no sql structures velocity volume variety 11 10 9 8 7 6 1 5 8 9 4 11 6 2 7 3 10 5 4 3 2 1