August 15, 1993
eCONOMIC
GOMMeNTORY
Federal Reserve Bank of ClevelandAssessing Real Interest Rates
by John B. Carlson
MM assessing real rates, the central issue is their relationship to an equilibrium interest rate...level that, if maintained, would keep the economy at its produc-tion potential over time. Rates persisting above that level, history tells us, tend to be associated with slack, disinflation, and economic stagnation— below that level with eventual resource bottlenecks and rising inflation, which ultimately en-genders economic contraction. Maintain-ing the real rate around its equilibrium level should have a stabilizing effect on the economy, directing production toward its long-term potential.
Alan Greenspan, Chairman, Federal Reserve Board Since the late 1970s, the Federal Open Market Committee (FOMC) of the Fed-eral Reserve System has set ranges for growth of money and debt at the begin-ning of each year, as required by the Humphrey-Hawkins Act. These ranges are reconsidered at the FOMC's July meeting, where preliminary ranges are chosen for the next calendar year. Monetary targets were intended not only as policy guides, but also as a means to communicate the thrust of monetary policy to others—particu-larly in regard to its long-term inten-tions. For example, in the 1980s the FOMC sought to slow trend money growth in order to reduce the inflation rate over time. Financial markets have thus paid a great deal of attention to monetary targets.
The usefulness of monetary targets both as a policy guide and as a means to communicate policy intentions has traditionally owed in large part to the
relatively simple and stable relationship between money and prices. In recent years, however, it has become evident that this historical relationship is no longer as reliable as it once was. Pru-dence suggests that the FOMC look to alternative longer-term guides. It is in this context that Chairman Greenspan has identified real interest rates as "one important guidepost," while also not-ing that estimates of real interest rates and their equilibrium values themselves embody a great deal of uncertainty. This Economic Commentary examines the concept of a real interest rate and presents some estimates of real rates on both short-and longer-term Treasury se-curities. The results show that although analysis of real interest rates may add a forward-looking element to the policy process, the relationship between real interest rates, output, and inflation is complex and difficult to assess. Given these complexities, a real-interest-rate guidepost is not likely to serve as well as monetary targets have done as a device for communicating long-term policy intentions, especially in regard to infla-tion. I contend that supplementing the policy process with an explicit long-term objective, especially for a nomi-nal anchor on the price level, could serve to eliminate some of the uncer-tainties attending the assessment of real interest rates.
• Real Interest Rates
It is useful to emphasize that the real in-terest rate is an ex ante, not an ex post, concept. Ex post real rates for any finan-cial instrument may be obtained by subtracting the actual average annual
The recent breakdown in the relation-ship between M2 and the price level has led the Federal Reserve to exam-ine alternative longer-term policy guides. One such guide is the real in-terest rate. While this focus adds a forward-looking element to the policy process, the relationship between real interest rates and policy goals is com-plex and difficult to assess. Thus, the usefulness of a real-interest-rate guide-post as a means for communicating long-term policy intentions is limited, especially in regard to inflation.
inflation rate (over the term of the in-strument) from the nominal rate of the instrument. Ex post interest rates are not viewed as relevant for economic de-cisions, particularly over long horizons, since they cannot be known at the time a loan is made. Decisions are instead based on an anticipated return, which necessarily involves some forecast of inflation.
Real interest rates are not directly observ-able, of course, but may be inferred from nominal interest rates and esti-mates of inflation expectations. The common method for estimating the real interest rate is based on a hypothesis proposed by Irving Fisher in the early part of this century. Fisher accepted the premise that forward-looking borrow-ers and lendborrow-ers did not always presume price stability, but would anticipate that the price level would vary from time to time. Thus, lenders would seek
compensation for any expected loss in nominal value due to expected changes in the price level. Very simply, Fisher's hypothesis is summarized by
(1) i«r+p'\
where i is the nominal rate, r is the real rate, and pe is the expected average annual inflation rate over the term of the instrument.
The Fisher hypothesis implies that the nominal rate rises point-for-point with anticipated inflation, leaving the real rate unaffected. Thus, the real interest rate can be estimated by subtracting the expected inflation rate from the observ-able nominal interest rate. Fisher believed that inflation expectations were based both on information about the future and on past observations. Moreover, he argued that inflation expectations are slow to develop and slow to disappear. A monetary policy guided by the real rate thus would need at least two com-ponents: 1) a method for assessing in-flation expectations to estimate an ex ante real interest rate; and 2) a means for estimating the equilibrium real rate so that actions could be directed toward moving the rate closer to its equilib-rium value.
• Estimates of Real Rates Figure 1 shows that the real federal funds rate, the interest rate on bank re-serves set by the Federal Reserve Sys-tem, has hovered near zero in recent quarters. Because fed funds are of such short duration, this estimate is based on actual inflation for the same quarter. Such low real rates have not occurred since the 1970s, when they prevailed over much of the decade. Thus, some analysts fear that if allowed to persist, current rates might generally lead to inflationary imbalances.
Estimates of real rates on instruments with longer maturities require meas-ures of expected inflation over the term of the instrument. Survey data are an important source of information on such expectations. Unfortunately, these data are few, and new sources
would be costly. In many cases, avail-ability is sporadic and just plain non-existent for most horizons.
Figure 2 uses existing survey data to esti-mate ex ante real rates for both one-year and 10-one-year Treasury securities. The one-year real rate is based on annual inflation expectations from the Univer-sity of Michigan's Survey of House-holds (UMSH). A 10-year real rate is based on each of the UMSH and Hoey (economic decisionmaker) surveys when available.
Currently, the estimated real interest rates across maturities are relatively low at both the short and long end. The estimate of the one-year Treasury rate has been negative for four consecu-tive quarters. The 10-year Treasury rate—considered to be less influenced by policy and more by underlying eco-nomic conditions—is substantially higher, although it too is near its bot-tommost level since 1975. The differ-ence, or yield curve, between long-term and short-term real rates, however, is high by historical experience. The steep slope is also interpreted as being unsustainable if inflationary imbalances are to be avoided.
• Inflation Expectations
In discussing the role of real interest rates as a policy guide, Chairman Greenspan was careful to note the un-certainties embodied in estimates of ac-tual and equilibrium interest rates. One key uncertainty is related to the preci-sion with which inflation expectations can be measured. This problem can be illustrated at both the 10-year and one-year horizons.
Figure 3 presents the two series on long-term inflation expectations used to estimate the real rate on 10-year Treasury bonds. The Hoey survey polls decisionmakers— including financial managers, analysts, and economists— regarding their expectations of infla-tion over a 10-year horizon and reports the average value of responses. This se-ries begins in September 1978 and ends in February 1991. The UMSH polls households concerning inflation
expectations over a horizon of five to 10 years; due to data limitations, the median value of responses is reported here. This series, while more sporadic in the early years, has recently become available continuously on a monthly frequency since early 1991.
The differences between the two series in common periods offer a crude sense of the potential imprecisions of such data. These discrepancies may reflect any number of factors, such as differ-ences in samples, the form of the ques-tions individuals are asked, and what inflation measures are implied. More-over, it not clear how representative the survey sample is for estimating the expec-tations of securities traders.
Both series seem to be consistent with Fisher's conjecture that inflationary expec-tations are slow to develop and slow to disappear. As a benchmark, figure 3 in-cludes a measure of inflation 10 years ahead to enable a comparison between what was expected and what actually happened. In 1980, for example, survey respondents predicted that inflation would average about 9 percent over the decade; in fact, it amounted to only half that much. This peak in 10-year expec-tations occurred about eight years after ex post inflation peaked and converged only slowly to the lower level of infla-tion experienced in the decade. Some analysts argue that the slow con-vergence reflects the heightened uncer-tainty of markets about future price-level increases. Moreover, this vigilance on future inflation leads many to believe that the mistakes of the 1970s are less likely to recur. Convincing evidence for such a conjecture, however, would require observing policy over several episodes that include inflation shocks of the kind experienced in that decade. A similar picture emerges at a one-year horizon. Figure 4 presents the mean value of the UMSH responses on ex-pected inflation for one year ahead. These data are available quarterly from 1956 onward. Since 1981, annual inflation expectations have been relatively sta-ble around a 4 percent rate, roughly consistent with the average rate over
FIGURE 1 THE REAL FEDERAL FUNDS RATE
1955 1960 1965 1970 1975 1980 1985 1990
SOURCES: Board of Governors of the Federal Reserve System; and U.S. Department of Labor, Bureau of
Labor Statistics.
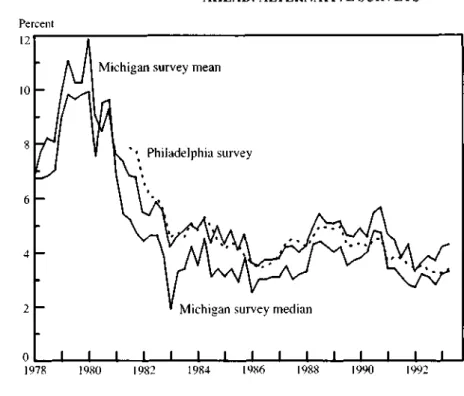
the same period. Nevertheless, actual annual inflation over the same horizon has on occasion drifted persistently be-low its expected level. As a result, some believe that the series is biased, pointing to the skewness in the distribution of sur-vey responses as confirming evidence. In light of the skewness, many analysts prefer to use the median value, rather than the mean value, of survey responses. Indeed, some surveys report only the median value. Figure 5 contrasts the UMSH mean and median expected in-flation rates and the median of the Con-sumer Price Index forecasts of the Sur-vey of Professional Forecasters compiled by the Federal Reserve Bank of Phila-delphia. Although all the series move together, survey medians are typically lower—sometimes by as much as two percentage points. The appropriateness of any measure remains controversial, again illustrating the degree of uncer-tainty embodied in estimating real inter-est rates.
FIGURE 2 EX ANTE REAL RATES: SHORT-TERM VERSUS LONG-TERM
10-year Treasury rate
-2
1975 1980 1985 1990
SOURCES: Board of Governors of the Federal Reserve System; the University of Michigan; and Barclays de
Zoete Wedd, Inc.
• The Equilibrium Real Interest Rate
The notion of an equilibrium interest rate is often identified with Knut Wick-sell. He formalized a theory around two concepts: a natural rate of interest, essentially the rate that realizes savings and investment necessary for the opti-mal level of output and employment, and the money (or market) rate, the interest that banks charge on loans. The natu-ral rate is essentially determined by real investment opportunities, while the money rate is determined in the market for loanable funds and can be affected by the central bank.
Wicksell made no distinction between real and nominal interest rates, perhaps reflecting the prevailing influence of the gold standard, which then anchored the price level. Under that regime, infla-tion was neither persistent nor forcastable. Hence, nominal interest rates were tan-tamount to ex ante real rates. Moreover, Wicksell advocated a policy aimed at a constant price level. Thus, the equilib-rium real interest rate implied an equi-librium zero inflation rate.
Modern versions of the Wicksellian framework imply an equilibrium real rate associated with inflation stability rather than price-level stability. Here, maintaining the real interest rate around its equilibrium value would serve to stabilize the rate of inflation around some predetermined level. Such a policy framework would require an explicit objective for inflation. While the Federal Reserve has not been pre-cise about its price-level goals, it has established a consistent pattern of annual monetary targets over the past decade, providing a basis on which to identify such an objective.
Under the real-interest-rate approach, discrepancies between the natural and money rates set in motion a cumulative process that produces the sequence of outcomes described in Chairman Greenspan's testimony. That is, periods during which the market rate persist-ently exceeds the natural (that is, equi-librium) rate are associated with slack, disinflation, and economic stagnation. Conversely, periods during which the market rate persistently falls below the natural rate are associated with rising inflation, culminating in economic con-traction. Maintaining the market rate around its equilibrium value produces price stability and directs output growth toward its long-term potential. Unfortunately, there is no simple way to measure this equilibrium rate. Evi-dence suggests that the equilibrium real interest rate can vary substantially. This seems clearly illustrated over the past two decades. Table 1 presents outcomes for inflation and output along with esti-mates of real interest rates for the first two years of the last three expansions lasting that long. One finds no simple correspondence between the estimated level of real interest rates and output growth or inflation. For example, rapid expansions can occur when real inter-est rates are both high (early 1980s) and low (mid-1970s). A sluggish expan-sion can also ensue when real rates are low (early 1990s).
The rapid growth in the U.S. economy in the 1980s in the face of such high real interest rates surprised many
econo-FIGURE 3 LONG-TERM INFLATION: EXPECTED VERSUS ACTUAL Percent 10 _ Ex post inflation"1 Expected inflation: Hoey surveya Expected inflation: Michigan survey 1970 1975 1980 1985 1990 a. 10 years ahead. b. 5 to 10 years ahead. NOTE: All data are quarterly.
SOURCES: U.S. Department of Labor. Bureau of Labor Statistics; the University of Michigan; and Barclays de Zoete Wedd. Inc.
FIGURE 4 INFLATION ONE YEAR AHEAD: EXPECTED VERSUS ACTUAL
Percent 16 14 12 10 ExPe c t ed inflation: Michigan survey 1956 1961 1966 1971 1976 1981 1986 1991
NOTE: All data are quarterly.
mists. Such unprecedented levels were previously thought to be inconsistent with a booming economy. The puzzle was addressed in the 1985 Economic Report of the President, which con-cluded that
...the high level of real interest rates is in large part attribut-able to the major change in business depreciation allow-ances ..., which raised the real after-tax internal rate of return on new business invest-ment. With a higher rate of re-turn on new investment, it is worthwhile for businesses with little cash but good investment opportunities to borrow at higher interest rates to finance investment.... The substantial increase in the prospective rate of return on business invest-ment has therefore pulled up the real rate of interest in the financial markets.
In recent months, however, the puzzle has been to explain the limited extent of the expansion given the depressed interest-rate structure. The substantial cumulative easing of policy over the past four years has reduced short-term rates to near zero. Why, then, has the recovery that began in mid-1991 been so sluggish?
Chairman Greenspan addressed this question in his July testimony, identify-ing "the build-down of national defense" and "sharply reduced spending on non-residential real estate in response to overbuilding" as key elements dampen-ing output growth and the equilibrium interest-rate structure. At the same time, business investment in labor-saving technologies has depressed employ-ment growth and made households more frugal. Cautious spending has in turn reduced prospective rates of return on investment opportunities. The net impact has been to encourage consum-ers and businesses alike to pay down debt and "repair their balance sheets." The Chairman has compared these cir-cumstances to driving in the face of a 50-mile-per-hour headwind.
FIGURE 5 INFLATION EXPECTATIONS ONE YEAR AHEAD: ALTERNATIVE SURVEYS
Michigan survey mean
Michigan survey median
I I I I I I I I I I I I I I I
0
1978 1980 1982 1984 1986 1988 1990 1992
SOURCKS: The University of Michigan; and Federal Reserve Bank of Philadelphia.
TABLE 1 AVERAGE REAL INTEREST RATES, INFLATION, AND OUTPUT GROWTH3
1975:IIQ-1977:IQ 1983:IQ-1984:IVQ 1991:IIQ-1993:IQ Real Int. Rate— lYear 0.2 5.4 0.3 Real Int. Rate— 10 Year 2.7 6.8 3.1 GDP Deflator— Inflation 6.4 4.2 2.7 Real GDP Growth (annual rate) 4.8 5.6 2.1
a. Expressed as percentages for first two years of economic expansion.
SOURCES: Board of Governors of the Federal Reserve System; U.S. Department of Commerce; U.S.
Depart-ment of Labor, Bureau of Labor Statistics; the University of Michigan. Survey of Consumers; and Barclays de Zoete Wedd, Inc.
It seems clear that the equilibrium structure of real interest rates has no simple interpretation. Indeed, policy-makers may fail to anticipate or even to recognize changes in equilibrium real rates until long after the fact. This serves to illustrate the great uncertain-ties attending the use of real interest rates as a policy guide.
• Some Concluding Thoughts The breakdown in the relationship of M2 with economic activity and infla-tion has led the central bank to focus on alternative longer-term policy guides. One such guidepost is real inter-est rates. Given the inherent uncertain-ties in estimating levels of actual and equilibrium real interest rates, however, only rough judgments can be made.
Notwithstanding these limitations, real interest rates are low by historical stan-dards. Short-term rates—those most influenced by policy—are near zero and in some cases negative. Long-term rates, which are essentially determined by economic and financial conditions, are substantially higher. This configura-tion suggests that markets expect short-term rates to head higher eventually. Policy guides are useful not only as a basis for motivating changes in mone-tary policy, but also as a means of com-municating its intentions to the public. In this regard, monetary targets have served particularly well, especially in relaying the central bank's goals in re-gard to long-term inflation. This has to some extent reflected the simplicity of the widely accepted connection between trend money growth and inflation. But the complexity of the relationship be-tween real interest rates and policy objec-tives necessarily limits its role as an informational device, especially where inflation is concerned.
Under these circumstances, a frame-work for policy expressed in terms of ultimate objectives would help to reduce uncertainties associated with a real-interest-rate guidepost. Explicit long-term targets, especially for a nominal anchor on the price level, would be an important component of such a framework.
• Footnotes
1. See 1993 Monetary Policy Objectives, Board of Governors of the Federal Reserve System, July 20, 1993, p. 10.
2. Survey data are, of course, not the only source of information on inflation expecta-tions. Estimates of such expectations are sometimes derived from econometric mod-els or from market-based alternatives that compare ordinary bonds with indexed bonds. For example, see Joseph G. Haubrich and Ann M. Dombrosky, "Gilt by Associa-tion: Uncovering Expected Inflation," Fed-eral Reserve Bank of Cleveland, Economic
Commentary, June 1, 1992.
3. For a formal treatment of the cumulative process model associated with Wicksell. see Thomas M. Humphrey, "Cumulative Proc-ess Models from Thornton to Wicksell," Federal Reserve Bank of Richmond,
Eco-nomic Review, vol. 72, no. 3 (May/June
1986), pp. 18-25.
4. See Economic Report of the President. Transmitted to the Congress, January 1985, p. 35.
John B. Carlson is an economist at the Fed-eral Reserve Bank of Cleveland. The author thanks William T. Gavin and EJ. Stevens for helpful comments and Gregory A. Bauer for excellent research assistance. The views stated herein are those of the author and not necessarily those of the Fed-eral Reserve Bank of Cleveland or of the Board of Governors of the Federal Reserve System.
Federal Reserve Bank of Cleveland Research Department
P.O. Box 6387 Cleveland, Ohio 44101
BULK RATE U.S. Postage Paid
Cleveland, OH Permit No. 385
Address Correction Requested:
Please send corrected mailing label to the above address.
Material may be reprinted provided that the source is credited. Please send copies of reprinted materials to the editor.