econ
stor
Der Open-Access-Publikationsserver der ZBW – Leibniz-Informationszentrum Wirtschaft
The Open Access Publication Server of the ZBW – Leibniz Information Centre for Economics
Nutzungsbedingungen:
Die ZBW räumt Ihnen als Nutzerin/Nutzer das unentgeltliche, räumlich unbeschränkte und zeitlich auf die Dauer des Schutzrechts beschränkte einfache Recht ein, das ausgewählte Werk im Rahmen der unter
→ http://www.econstor.eu/dspace/Nutzungsbedingungen nachzulesenden vollständigen Nutzungsbedingungen zu vervielfältigen, mit denen die Nutzerin/der Nutzer sich durch die erste Nutzung einverstanden erklärt.
Terms of use:
The ZBW grants you, the user, the non-exclusive right to use the selected work free of charge, territorially unrestricted and within the time limit of the term of the property rights according to the terms specified at
→ http://www.econstor.eu/dspace/Nutzungsbedingungen By the first use of the selected work the user agrees and declares to comply with these terms of use.
zbw
Leibniz-Informationszentrum Wirtschaft Leibniz Information Centre for EconomicsCanavire-Bacarreza, Gustavo; Nunnenkamp, Peter; Thiele, Rainer; Triveño, Luis
Article
Assessing the allocation of aid :
developmental concerns and the
self-interest of donors
The Indian economic journal Provided in cooperation with: Institut für Weltwirtschaft (IfW)
Suggested citation: Canavire-Bacarreza, Gustavo; Nunnenkamp, Peter; Thiele, Rainer; Triveño, Luis (2006) : Assessing the allocation of aid : developmental concerns and the self-interest of donors, The Indian economic journal, ISSN 0019-4662, Vol. 54, Iss. 1, pp. 26-51, http:// hdl.handle.net/10419/3983
– Developmental Concerns and the Self-Interest of Donors –
Gustavo Canavire Peter Nunnenkamp Rainer Thiele Luis Triveño AbstractIn this paper, we perform a Tobit analysis of aid allocations, covering the period 1999-2002 and accounting for both altruistic and selfish donor motives. We first compare the allocative behavior of all bilateral donors taken together with that of multilateral aid agencies, and then look at nine major bilateral donors individually. It turns out that poorer countries get clearly more aid from both bilateral and multilateral donors, with the possible exception of France and Japan. Most bilateral donors and the multilateral agencies are also found to direct significantly more aid to well governed recipients if governance is measured by the World Bank’s CPIA. If the CPIA is replaced by the Kaufmann index, however, the policy orientation of aid becomes extremely weak. In contrast to a recent paper by Dollar and Levin (2004), our estimates do neither suggest that multilateral aid is more poverty and policy oriented than bilateral aid, nor that IDA performs particularly well within the group of multilateral donors. Post-conflict resolution, the third altruistic motive considered in the paper, emerges as a significant determinant of aid allocations in 2002. The importance of selfish aid motives clearly differs between bilateral and multilateral donors. We find no evidence that donor countries were able to push through their individual trade and political interests at the multilateral level. By contrast, the export-related self interest of DAC countries provided a fairly strong incentive to grant bilateral aid, as did colonial ties.
JEL classification : C24 ; F35
I. INTRODUCTION
The fight against absolute poverty and widening income disparities between the poorest and the richest countries figures prominently in both the academic and political debate. Recent reports, notably UNDP (2005), argue that a substantial increase of official development aid would help considerably in making progress in this regard. At the same time, the effectiveness of aid could be improved by an appropriate targeting of aid. This raises the question of whether donors have increasingly directed aid to needy and deserving recipients, i.e., developing countries that are particularly poor and have reasonable local conditions in place for aid having the desired effect of reducing poverty and stimulating income growth.
Dollar and Levin (2004) have made a strong point that the allocation of aid has recently become much more efficient as donors increasingly adhere to the principle of selectivity. The short review of the literature in Section II points to several unsettled questions, however. Most importantly, the allocation of aid can only be assessed appropriately if both developmental concerns and selfish donor motivations are taken into account.
Therefore, we perform a regression analysis that includes altruistic and selfish determinants of aid, employing a Tobit model, presented in Section III, to account for the censored nature of the aid variable. We compare the allocative behavior of all bilateral donors with that of multilateral donors to evaluate the widespread view that the latter are superior donors due to a stronger orientation to poverty concerns and local conditions for aid being effective. In addition, we assess nine major bilateral donors individually to account for differences with regard to the relative importance of selfish and altruistic motivations of aid. The empirical results are presented in Section IV. Section V concludes and proposes some avenues for future research.
II. WHERE DO WE STAND?
Industrialized countries may grant aid to developing countries for a variety of reasons. On the one hand, donors may be concerned about humanitarian needs in recipient countries and, thus, help foster the recipients’ economic development. On the other hand, donors may pursue selfish motivations. Aid may be used to support the donor’s economy, notably through promoting exports of the donor country to the recipient country. Furthermore, the allocation
of aid may be shaped by former colonial ties and current strategic and political interests of donors.
According to earlier empirical studies, selfish motivations of donors have traditionally played an important role in the allocation of aid. Schraeder et al. (1998: 319) “clearly reject the rhetorical statements of policymakers within the industrialized North who publicly assert that foreign aid is an altruistic tool of foreign policy.” Alesina and Dollar (2000) found that bilateral aid was dictated as much by political and strategic considerations as by the economic needs and policy performance of the recipients. Collier and Dollar (2002) concluded that the actual allocation of aid was radically different from the poverty-efficient allocation. Alesina and Weder (2002) rejected the rhetoric of donors that aid rewarded efficient and honest governments. McGillivray (2003: 7) summarized the evidence available from earlier studies as follows: “Developmental or humanitarian concerns, including the reduction of poverty, receive a relatively low or even zero weight.”
However, these findings may no longer apply. Bilateral and multilateral donors claim to have adjusted their aid allocation in order to take recent academic insights into account. Influential contributions to the debate on foreign aid have shown that its effectiveness could be greatly improved if aid was directed primarily to poor countries pursuing development-friendly economic policies (World Bank 1998; Burnside and Dollar 2000; Collier and Dollar 2001). Isenman and Ehrenpreis (2003) as well as Collier and Hoeffler (2004) argue that aid could also be effective under conditions of post-conflict reconstruction. Such insights are underlying the so-called Millennium Challenge Account of the United States, according to which good governance and market-friendly economic policies are required for developing countries to receive US aid (Clemens and Radelet 2003). OECD representatives reckon: “After the cold war, donors have given more emphasis to development criteria than previously, including selectivity according to both poverty needs and policy performance” (Isenman and Ehrenpreis 2003: 10). McGillivray (2003) refers to a recent survey of ten donors to make the point that developmental criteria have received higher priority in aid allocation. Multilateral institutions, in particular, are said to have a clearer developmental focus. The World Bank (2002: 69) contends that the allocation of its aid “has improved dramatically in recent years.”
Nevertheless, there is reason to be sceptical whether fine words have been translated into noble deeds. Langhammer (2004) considers it naïve that aid granted for strategic reasons has become an issue of the past, especially after September 11, 2001. The descriptive statistics and bivariate correlations presented by Nunnenkamp et al. (2004) do not support the view that
the targeting of aid has improved significantly. Most donors did provide more aid to relatively poor countries, but so far the fight against poverty does not appear to have resulted in a stronger focus on recipient countries with particularly high incidence of absolute poverty. According to Nunnenkamp et al. (2004), many donors also failed to direct aid predominantly to where local conditions were conducive to a productive use of inflows. The response of donors to changing institutional and policy conditions in recipient countries is shown to be fairly weak.
Some recent studies, applying multivariate econometric techniques to account for various determinants of aid, portray a more favorable picture on the allocation of aid:
• Neumayer (2005) analyses the allocation of food aid by the three most important donors and non-governmental organizations in the 1990s. He shows that neither export and military-strategic interests of donors nor former colonial ties with recipients had an impact on food aid. As noted by the author, his findings differ strikingly from previous results relating to overall aid. This contrast may be because food aid is peculiar in that it is more oriented to recipient need than other forms of foreign aid.1
• Based on an extremely rich dataset, Berthélemy and Tichit (2004) perform a three-dimensional panel analysis covering 22 donors and 137 recipients over the period 1980-1999. Major findings are: (i) Aid commitments per capita of the recipients’ population were higher for recipients at a lower income level, which proxies for the need for aid. (ii) Most donors rewarded good economic policy outcomes in the 1990s and paid great attention to good governance in recipient countries. (iii) The end of the cold war has reduced the bias of aid towards former colonies, whereas donors have increasingly favored trade partners. Using the same dataset, Berthélemy (2005) stresses that aid allocation differs considerably across bilateral donors. Switzerland, Ireland, Denmark and Norway turn out to be most altruistic, whereas the United Kingdom, Italy, France and Australia are considered “selfish” donors.
• Dollar and Levin (2004) estimate a regression equation across aid recipients for each of some 40 bilateral and multilateral donors, on the basis of which they construct a poverty selectivity index as well as a policy selectivity index. These authors use gross disbursements of aid, net of emergency aid, as the dependent variable. The main
finding is that the same group of donors that are very poverty focused are also very policy focused. This group includes the International Development Association (IDA), Denmark, the United Kingdom, Norway and the Netherlands. Policy selectivity is shown to have increased significantly between the periods 1984-1989 and 1995-1999. However, “overall bilateral aid is not very selective” (Dollar and Levin 2004: 14) as some quantitatively important donors, notably France and the United States, are neither poverty focused nor policy focused.
The studies by Berthélemy and Tichit as well as Dollar and Levin provide important benchmarks against which to compare the approach and findings of this paper. This is also because these studies give rise to a number of questions and suffer from several shortcomings which we would like to address. As concerns the dependent variable, Dollar and Levin net out emergency relief on the plausible premise that this type of aid would not necessarily adhere to selectivity concerns. However, the approach taken by these authors cannot account for negative net disbursements of aid and treats the large number of zero observations arbitrarily. As noted by Roodman (2004), the log-linear regression model ignores that the distribution of aid disbursements is truncated and thus may lead to biased estimates.
The analysis of Dollar and Levin is also flawed in that it does not consider variables that may capture the self interest of donors. For example, the favorable assessment of the United Kingdom as a strongly poverty and policy focused donor is in striking contrast to Berthélemy and Tichit, who classify the United Kingdom as “selfish”. This difference may be due to the neglect of bilateral trade relations and colonial heritage as independent variables by Dollar and Levin.
Berthélemy and Tichit do account for the truncated nature of the dependent aid variable as well as for the trade interests of donors. It remains open to question, however, why the authors apply the ratio of the donor’s exports plus imports to GDP. It would be more appropriate to consider only the donor’s exports since export promotion seems to be the motive underlying tied aid. More importantly, the policy outcome variables used by Berthélemy and Tichit to reveal the policy orientation of aid allocation are highly problematic.2 Annual GDP growth of the recipient country reflects not only the local policy framework, but may also be shaped by
2 The same applies to Berthélemy (2005), who uses essentially the same variables to assess the quality of the policy framework in recipient countries.
external factors beyond the control of policymakers. Furthermore, it is unlikely that the simultaneity problem, resulting from possible growth effects of aid, can be overcome by a one-period lag. Other variables such as infant mortality and primary school enrolment capture the recipients' need for aid, rather than the quality of local policies.3 Similarly, the attractiveness of recipient countries to foreign direct investment is more likely to reveal that a country is relatively advanced and, thus, less dependent on aid.4
Berthélemy and Tichit (2004) as well as Berthélemy (2005) state that they tried policy variables considered by Burnside and Dollar (2000) to indicate under which conditions aid is likely to be effective in stimulating growth. It is mainly because these variables, including the rate of inflation, government budget deficits and openness to trade, turned out to be insignificant in shaping the allocative behavior of donors why Berthélemy and Tichit turn to the aforementioned “outcome variables”. This procedure implies that the insignificance of policy variables does not offer any relevant insights. Actually, however, the insignificant results may be a strong indication that aid donors were less policy oriented than suggested by the authors. The regression analysis to which we now turn attempts to solve this puzzle by applying different measures of the institutional and policy environment prevailing in aid recipient countries.
III. DATA AND METHODOLOGY 1. Definition of Variables
We choose total net Official Development Assistance (ODA) disbursements as compiled by the OECD’s Development Assistance Committee (DAC) to be our dependent variable, and follow Dollar and Levin (2004) in netting out emergency relief.5 The main advantage of looking at disbursements rather than commitments is that they more accurately reflect the
3 See Kanbur (2004), who argues that, in order to assess policy outcomes, the change in variables such as infant mortality and literacy, rather than their level, should be considered.
4 Foreign direct investment in developing countries tends to be concentrated in relatively advanced countries.
5 The only exception is IDA, for which DAC does not report emergency relief. See annex for definition and sources of variables.
resource transfers actually taking place.6 Those who prefer to work with commitments tend to argue that commitments constitute the only variable over which donors exert full control if for some reason recipients lack the willingness or administrative capacity to request committed resources. The existing controversy notwithstanding, estimations are unlikely to be affected much by the choice of either commitments or disbursements as the two are highly correlated (Neumayer 2003). Opting for total aid instead of aid per capita appears to be justified as donors are more likely to allocate a fixed overall amount of money on a country basis than on a per capita basis (McGillivray and Oczkowski 1992).
With regard to the set of explanatory variables to be considered, we assume in accordance with most of the recent literature (e.g. Alesina and Dollar 2000; Berthélemy and Tichit 2004; Neumayer 2003) that donors are neither entirely selfish nor entirely altruistic. Hence, we account for both donor interest and recipient need. Bilateral exports of donors to recipients, expressed as a percentage of total donor exports, serve as a proxy of donors’ commercial self-interest. When aid is tied, a simultaneity bias might arise as more tied aid will lead to more imports from the respective donor. This problem is mitigated by taking values of the trade variable that are lagged one year. To examine further whether large shareholders might be able to push through their trade interests in multilateral aid institutions, we also construct a specific trade variable for the multilateral regressions that is defined as the sum of exports from the nine most important bilateral donors to each recipient, divided by total exports of the nine donors.
Donors’ political and strategic interest is represented here by colonial dummies that enter the bilateral aid regressions for France, the Netherlands, and the United Kingdom, plus a dummy that reflects the special relationships of the United States with Egypt and Israel.7 Analogous to the case of trade, we allow for the possibility that colonial powers influence multilateral aid allocations in favor of their former colonies, by specifying a colonial dummy that is set equal to one for all recipients that were former colonies of Belgium, France, the Netherlands or the United Kingdom.
6 In principle, the so-called Effective Development Assistance (Chang et al. 1998) provides an even better measure of the resource flows than ODA. The EDA calculates the grant equivalent value of loans rather than counting them at face value as soon as the grant element exceeds 25 per cent. However, EDA data are only available at the aggregate bilateral and multilateral level und thus will not be used here.
The findings of the aid effectiveness literature cited above suggest that poverty, good governance and post-conflict situations are key factors that donors may take into account if their objective is to foster recipient needs. The most straightforward indicator of humanitarian need is per-capita income, measured as GDP per capita in purchasing power parities, which is also adopted here. A direct measure of poverty might be more closely related to humanitarian need, but poverty indicators are much less readily available and not easily comparable across countries and over time, even though the World Bank has made great strides in this respect by devising the well-known one-Dollar-a-day poverty headcount.
Among the various available governance indicators, we opt for the World Bank’s Country Policy and Institutional Assessment (CPIA) , because this is the indicator that has figured most prominently in recent discussions about aid allocations, particularly in the World Bank itself, but arguably also in major donor countries such as the United States. The main drawback of this choice is that the World Bank does not provide comprehensive information on the CPIA.8 A full classification of more than 100 countries into five CPIA categories ranging from very good to very poor is only available for one year (Collier and Dollar 2001). For a comparison over the period 1999-2002, we have to rely on a grouping of IDA eligible countries by quintiles, with a “one” assigned to countries with least favorable policies and a “five” to those with most favorable policies. Given this limitation, we conduct a sensitivity analysis employing the so-called Kaufmann index, another comprehensive governance indicator (Kaufmann et al. 2003). Since the Kaufmann index is known to be highly correlated with GDP per capita, which may give rise to multicollinearity problems, we first regress GDP per capita on the index and then include the estimated residuals in the aid regressions.
To investigate whether aid is higher than usual in case of post-conflict reconstruction needs, we construct a dummy variable that is set equal to one if according to the World Bank Post Conflict Fund (PCF) database a country received PCF grants in a particular year.
Finally, in addition to the variables representing donor interest and recipient need, we also control for the population of the recipient country, expecting that in absolute terms aid
8 A more fundamental critique of the CPIA and, for that matter, of any policy-based indicator is provided by Kanbur (2004). He argues that country assessments should more strongly focus on outcome variables such as reductions in infant mortality, given that the link between policies and outcomes is far from obvious. However, Kanbur’s critique has to be interpreted as a normative statement regarding the future allocation of aid and barely touches on the question of past aid allocations raised here.
increases with country size, even though it may fall in per-capita terms and thus exhibit a small-country bias.
2. Estimation Method
The statistical analysis of aid allocation is affected by the truncated nature of the aid variable. This is particularly true for smaller donors such as Denmark or Norway, which tend to concentrate their aid on a few recipients. With many ‘zero’ observations, OLS estimates such as those presented by Dollar and Levin (2004) tend to be biased as they do not account for the non-linearity in the relationship that is estimated. Three different approaches to deal with this issue have been suggested in the literature (Neumayer 2003; Berthélemy and Tichit 2004). The first approach is a two-part model, where the first step involves a Probit estimation that determines the probability of receiving aid (selection equation), and the second step an OLS estimation that determines the amounts of aid for the sub-sample of positive aid observations (allocation equation). Formally, aid to recipient i is defined as:
, ) ( ) 0 Pr( i i i i i i v bZ aid u aY F aid + = + = >
where F(.) denotes the cumulative distribution function, Y and Z are explanatory variables for the selection and allocation equation, a and b the respective vectors of coefficients, and u and
v independent and normally distributed error terms.
The crucial assumption underlying this approach is that the choice of the recipient and the amount of aid allocated are independent of each other (u and v are not correlated). If this assumption does not hold, which appears to be highly plausible, the regression in the second step suffers from a selection bias.
The second approach is the sample selection or Heckman model, which resembles the two-part model, except that u and v are not assumed to be independent. Again, a Probit estimation is performed in the first step. In the second step, the so-called inverse Mill’s ratio from the first step is added to the set of explanatory variables in order to correct for the selection bias. We then obtain: , ) ( / ) ( ) ( 0 Pr( i i i i i i i i i i v u aY F u aY f bZ aid u aY F aid + + + + = + = > ρσ
where ρ stands for cov(u,v), σ for var(v), and f(.)/F(.) for the inverse Mill’s ratio.
The third approach is the Tobit model, which estimates aid allocations in one step, taking the truncated nature of the aid variable directly into account. Aid to a specific recipient is specified as the maximum of zero and a linear combination of the explanatory variables so as to guarantee that predicted aid flows cannot become negative:
). 0 ), max( i i i bZ v aid = +
The main difference compared to the Heckman model is that the variables are restricted to have an identical impact on aid eligibility and the amount of aid given so that the more general specification might be regarded as superior.9 The Heckman procedure, however, suffers from its own problems: if the same set of explanatory variables is employed in both equations, estimates risk to become unreliable due to severe multicollinearity problems. Since it is very difficult to find appropriate exclusion variables for the first step of the Heckman procedure, we follow Berthélemy and Tichit (2004) and adopt the Tobit model for our regression analysis.
IV. EMPIRICAL RESULTS
The subsequent analysis proceeds in two major steps. First, we compare the allocative behavior of all bilateral donors taken together with that of multilateral aid agencies. In this way, it can be assessed whether the latter are more poverty and policy oriented than presumably more self-interested bilateral donors. Second, we run estimates for nine major bilateral donors individually. These are: Denmark, France, Germany, Japan, the Netherlands, Norway, Sweden, the United Kingdom, and the United States. This group accounted for 83 per cent of total bilateral aid in 2002. The allocative behavior is expected to differ between these bilateral donors, e.g. with regard to the relative importance of selfish and altruistic motivations of aid. In both steps of our analysis, we focus on the most recent past. Depending on the availability of data, the starting point is 1998 or 1999. Hence, we cover the period in which aid should have become more poverty and policy oriented according to the public announcements made by several donors (see Section II).
9 Note that the Tobit model can be derived as a special case of the Heckman procedure with coefficients, variables and residuals that are the same in the selection and allocation equation.
1. Total Bilateral and Multilateral Aid
In addition to comparing the behavior of all bilateral donors and all multilateral agencies, we present separate estimates for aid from IDA. This is not only because IDA represents the most important multilateral aid agency, accounting for about 30 per cent of total multilateral aid disbursements in 2003, but also because Dollar and Levin (2004) found IDA aid to be particularly well targeted to poor countries with favorable local conditions.
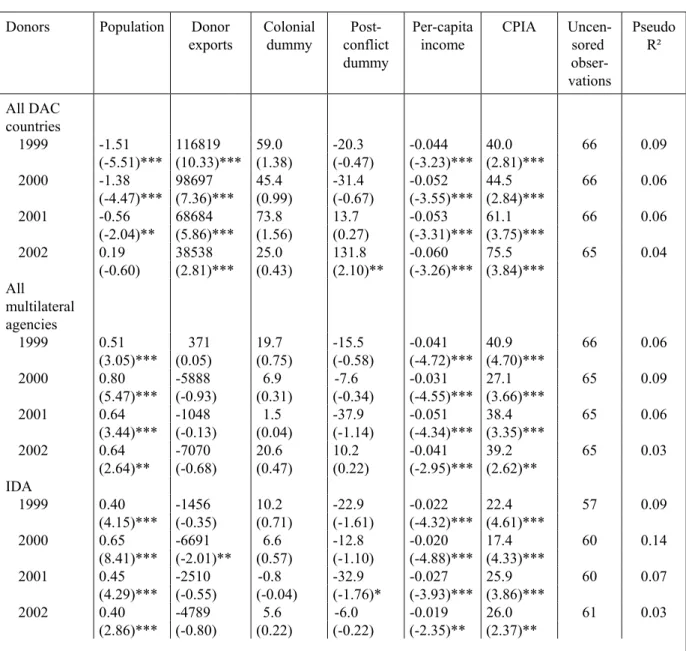
As concerns the poverty orientation of aid, the estimates presented in Table 1 do not support the view that multilateral aid is superior to bilateral aid. If anything, there is weak evidence in favor of the opposite view. Taking the per-capita income of recipients as the usual proxy of recipient need, we find that poorer countries get clearly more aid from both bilateral and multilateral donors. Almost all coefficients of per-capita income are significantly negative at the 1 per cent level. With the size of the coefficients varying between –0.02 and –0.06, an increase in per-capita income by US$ 1000 would, on average, reduce aid disbursements by US$ 40 million.
Likewise, there is little difference between bilateral and multilateral donors with regard to the two dummies included in our estimates. The colonial dummy remains insignificant without exception. This indicates that former colonial powers did not, or were not able to, influence the allocative behavior of all bilateral donors taken together or that of multilateral agencies. Post-conflict resolution did not result in higher multilateral aid throughout the period under consideration, while bilateral donors provided more aid to post-conflict countries only in 2002. For this year, however, our results suggest that countries eligible for PCF grants received on average the impressive amount of US$ 132 million more in bilateral aid than those not eligible.
Both bilateral and multilateral donors directed significantly more aid to well governed recipients if the CPIA is applied as a measure of the quality of local conditions. All coefficients of the CPIA variable are significantly positive at the 5 per cent level or better. The policy orientation of bilateral donors appears to have strengthened over time. In 2002, a country grading up from, say, “three” to “four” in the CPIA ranking would, on average, have raised aid inflows by US$ 75 million, compared to a mere US$ 40 million in 1999. Furthermore, in contrast to Dollar and Levin (2004), we do not find the policy orientation of aid provided by IDA to be stronger than that of multilateral aid from other sources. This result
is striking as donors other than IDA could be expected to have more reservations to accept the World Bank’s CPIA as a guiding principle for allocating aid.
In addition to these minor discrepancies between bilateral and multilateral aid, there are also some pronounced differences. In particular, the exports of donor countries to recipient countries did not affect the allocation of multilateral aid, whereas the export-related self interest of DAC countries provided a fairly strong incentive to grant bilateral aid. In 2001, for example, 50 per cent higher average donor exports were associated with more than US$ 30 million additional aid disbursements, which suggests a considerably stronger impact of commercial interests on aid than that found by Berthélemy and Tichit (2004) for the 1990s. In other words, the aforementioned poverty and policy orientation must not be misunderstood to imply that selfish motivations of bilateral aid are no longer relevant. This supports the reasoning in Section II that Dollar and Levine (2004) missed important determinants of aid in their estimation approach.
As expected, more populous recipients got more multilateral aid, but – strikingly – the coefficient for population turns out to be significantly negative in the case of bilateral aid. It has to be taken into account, however, that the inclusion of both donor exports and recipients’ population in the Tobit model may pose problems of multicollinearity. Hence, we performed additional estimates, not reported here, in which we entered either the export variable or the population variable. Population then becomes positively related to bilateral aid, too, though less significantly so than to multilateral aid. The weaker relationship between bilateral aid and country size is largely due to the behavior of two major donors, France and the United States. France, in particular, exhibits an extremely strong small-country bias, rendering the simple correlation between total aid and recipients’ population even slightly negative.
Subsequently, we check the robustness of these findings to changes in the measurement of local conditions for aid being effective as well as to changes in the sample of recipient countries. As indicated before, the World Bank’s CPIA is publicly available only in rudimentary form for IDA eligible countries. By contrast, exact indicator values are accessible for the Kaufmann index on institutional conditions in essentially all recipient countries. The price to be paid for the more precise information from Kaufmann et al. (2003) is that the coverage of the CPIA, which includes macroeconomic and structural policy parameters, is much broader (IDA 2003). Yet, the recent literature on the primacy of institutions for economic development (e.g., Rodrik and Subramanian 2003) renders it plausible to consider
the Kaufmann index as an alternative measure to assess the developmental orientation of donors when allocating foreign aid.
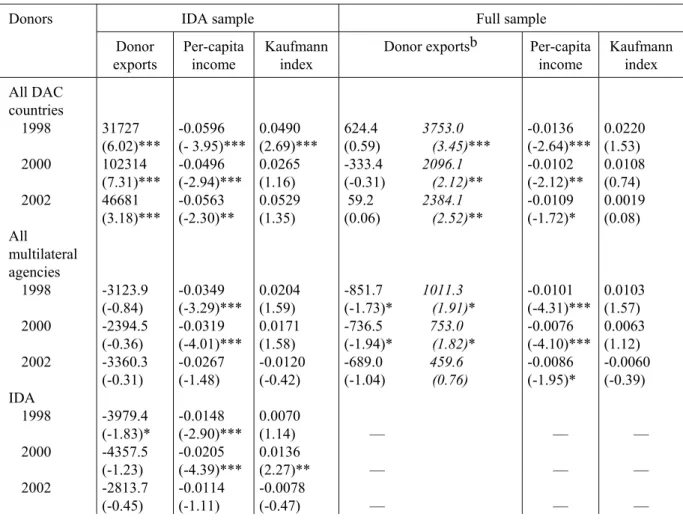
In Table 2, we present the results for those determinants of aid that are of major interest in evaluating the allocative behavior of bilateral and multilateral donors.10 The estimates are run for two different samples of recipient countries: (i) IDA eligible recipients as in Table 1, and (ii) the full sample of recipients for which the Kaufmann index and other required data are available.11 Hence, it can be identified whether results that diverge from those reported before are due to the measurement of local conditions or the inclusion of relatively advanced recipient countries.
In some respects, the substitution of the CPIA for the Kaufmann index has little effect. This applies especially to the poverty orientation of aid. As before, almost all coefficients of the per-capita income variable are significantly negative.12 Furthermore, the view that multilateral aid is better targeted to poor recipients is rejected once again. Nor do we find evidence indicating an intensified poverty orientation since 1998. As concerns the export variable, Table 2 underscores the differences between bilateral and multilateral donors. This is even though the export variable remains insignificant for bilateral donors when running the Tobit model for the full sample and including the population of recipients as a control. If population is dropped from the specification, the export variable turns significantly positive at the 5 per cent level or better for the full sample, too.13
The most striking result is that the policy orientation of both bilateral and multilateral donors is extremely weak when local conditions are measured by (the residuals of) the Kaufmann index. There are several possible reasons for the discrepancy between the two measures of local conditions. The CPIA may be applied as a guiding principle for allocating aid not only
10 The results for variables not reported in Table 2 are fairly similar to those shown in Table 1. Complete results are available upon request.
11 We do not present estimates of IDA’s aid for the full sample, since more advanced developing countries do not get aid from this source by definition.
12 The only exception is the insignificant coefficient in the estimate for multilateral aid to IDA eligible countries in 2002.
13 By contrast, the export variable is, at best, weakly significant for multilateral donors if population is dropped in the estimate covering the full sample.
by IDA itself but also by other donors. As a matter of fact, the UK Department for International Development (DFID) has used since recently an aid allocation model which relies on the CPIA (and per-capita income of recipients).14 Dollar and Levin (2004: 7) note that some donors explicitly follow allocation rules comprising the CPIA, which is, for example, true for the African Development Bank (McGillivray 2003). On the other hand, the classification of recipient countries into quintiles may have as a result that the policy orientation of aid is overstated when applying the CPIA measure. In contrast to what one might expect, the variance of the CPIA index values appears to be much smaller than the range from “one” to “five” for the quintiles suggest. According to IDA (2003), which reports the average index values for the quintiles in 2002, countries with a very poor rating were assigned an average CPIA of 2.57; countries with a very good rating had an average CPIA of 3.69. Dollar and Levin (2004) state that the standard deviation of the CPIA across developing countries is just about 20 per cent.
In any case, our results reveal that the policy orientation of foreign aid strongly depends on how local conditions are measured. Considering the widespread belief that institutions matter most for economic development, the extremely weak results we get for the Kaufmann index suggest that the allocation of aid leaves much to be desired in order to render foreign aid an effective means to stimulate the development of recipient countries. Compared to the measurement of local conditions, the composition of the sample has relatively little effect. The results for multilateral aid in Table 2 are not affected when running the estimate for the full sample instead of the sub-sample of IDA eligible countries. As concerns bilateral donors, the impact of the Kaufmann index on aid allocation across IDA eligible countries in 1998 becomes insignificant for the full sample of recipient countries.
2. Bilateral Aid of Major Donors
The same set of estimates is performed for individual bilateral donors. To keep the presentation within reasonable limits, results reported in Tables 3 and 4 are restricted to the variables of particular interest in the present context.
14 This information was provided by John Burton from DFID, whom we would like to thank for comments and suggestions related to an earlier paper.
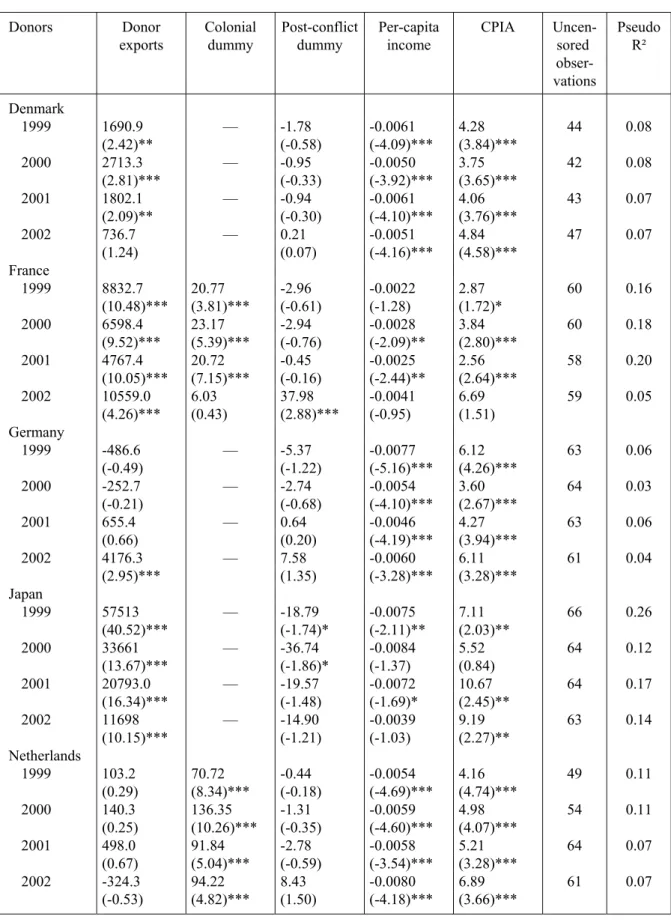
Similar to earlier studies, we find that the poverty focus differs across bilateral donors. The coefficient of the per-capita income variable is consistently negative at the 5 per cent level or better for the three Scandinavian countries, Germany, the Netherlands and the United Kingdom. Even within this group, there are significant differences. Especially in the estimates run for the sample of IDA eligible countries (Table 3 and first half of Table 4), the United Kingdom stands out in that the coefficient of the per-capita income variable is clearly highest. An increase in per-capita income by US$ 1000 would, on average, reduce UK aid by more than US$ 10 million, compared to a drop of about US$ 3.5 million in the Norwegian and Swedish case.15 However, we find hardly any evidence supporting the claim of donors that the poverty focus of aid has been strengthened over time.
The poverty orientation of aid granted to IDA eligible recipients is weaker for the remaining three donors. This applies to Japan in particular.16 In the case of France, the per-capita income of recipients did not have a significant impact on the allocation of aid in several years. No consistent pattern emerges for the United States.
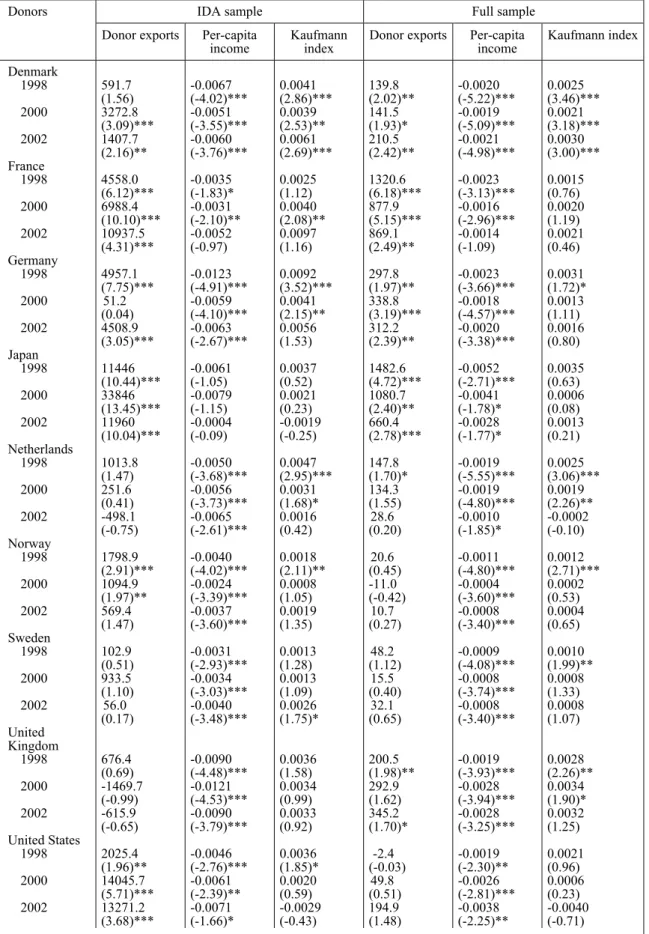
The impact of per-capita income on aid allocation is essentially the same independently of whether the CPIA or the Kaufmann index is taken as a measure of local conditions. By contrast, the results are affected if the estimates are performed for the full sample of recipient countries instead of IDA eligible recipients only. The second half of Table 4 points to several notable changes. First of all, the coefficient of the per-capita income variable declines for all bilateral donors which were shown before to have a relatively strong poverty orientation. On the other hand, more favorable results are achieved for France and the United States. In 2002, the coefficient of per-capita income even turns out to be higher for the United States than for the United Kingdom. Hence, the differences in the poverty orientation across important bilateral donors are less pronounced when the sample is extended to include more advanced developing countries.
The donor-specific estimates underscore what has been said before on the policy orientation of aid. Recipients with a better CPIA classification typically got more aid, whereas the
15 Relatively speaking, the impact is similar for aid granted by these three donors, as the overall aid budget of the United Kingdom is almost three times the aid budget of Norway and Sweden, respectively.
16 Note that the two significant coefficients of the per-capita income variable reported in Table 3 for Japan turn insignificant when the Tobit model is estimated without the export variable.
allocative behavior of donors was rarely related with the Kaufmann index. Yet, bilateral donors behaved differently:
• Similar to Dollar and Levine (2004), Table 3 reveals that the group of poverty oriented donors was also relatively policy oriented. The coefficient of the CPIA is consistently positive for exactly the same donors (the Scandinavian countries, Germany, the Netherlands, and the United Kingdom). Moreover, the United Kingdom again stands out within this group in that changes in the CPIA have the biggest impact on aid allocation, with an improvement by one mark in the CPIA ranking raising UK aid by US$ 6–11 million. As in the case of the per-capita income variable, the coefficients of the CPIA variable do not support the claim of an increasing policy orientation over time, except for the Netherlands and Sweden.
• The results for Japan and the United States are in conflict with Nunnenkamp et al. (2004), who found the share of aid granted to recipients with a favorable CPIA rating to be highest for these two donors. Once other aid determinants are controlled for, the CPIA classification plays a minor role in shaping the allocation of US aid. In the case of Japan, the coefficient of the CPIA appears to be high, but this result is far from robust.17
• If the CPIA is replaced by the Kaufmann index, the aid allocation of most donors is, at best, weakly shaped by local conditions. For several donors, still poorer results are achieved when estimating the model for the full sample, rather than IDA eligible recipients only. Denmark represents a major exception. All coefficients of the Kaufmann index are highly significant for this donor, independently of the sample considered.18
17 In addition to the insignificant coefficient for the year 2000, two of the remaining coefficients turn insignificant when the export variable is excluded from the specification of the model.
18 The extension of the sample to more advanced developing countries has little effect as Denmark provides aid to a limited number of relatively poor countries. As a result, the number of left-censored observations is exceptionally high, especially when the full sample is considered.
The post-conflict dummy typically remains insignificant, particularly in earlier years.19 Japan is an exception insofar as its allocation of aid was biased against post-conflict countries. On the other hand, some donors, namely France, Sweden and the United States, appear to have adjusted their aid allocation recently to take into account that post-conflict resolution may require increased aid efforts. The United States is leading in this respect. According to the estimates run for the full sample, US aid to countries under post-conflict conditions has been increased significantly since 1998, with the extra amount rising from US$ 12 to 27 million (not shown).20 Considering that it is only since recently that aid is supposed to be an effective means of post-conflict resolution (Isenman and Ehrenpreis 2003), this needs-oriented motivation of aid can be expected to gain in importance in the future.
In contrast to the post-conflict dummy, the colonial dummy should have become less relevant if recipient need had increasingly shaped the allocation of aid. This is hardly the case, however. With just one exception (France in 2002), Table 3 shows that former colonies still received significantly more aid from France, the Netherlands and the United Kingdom. In the restricted sample, disbursements to former colonies exceed the average amounts given to other recipients by more than US$ 20 million for France, by US$ 25-45 million for the United Kingdom, and by an extraordinary US$ 70–140 million for the Netherlands, which exhibit an extreme bias in favor of Indonesia. These quantities indicate that colonial ties still play a key, or perhaps even the dominant, role in former colonial powers’ aid allocation. Moreover, the extra amounts involved do not reveal a declining trend since the late 1990s. This also holds if the estimates are run for the full sample. In addition, the estimates for the full sample include a dummy set equal to “one” for US aid to Egypt and Israel, in order to reflect the strategic interest of the United States in these two countries (not shown). This strategic interest remains a dominant factor in the allocation of US aid. In 2002, Egypt and Israel accounted for 13 per cent of total US aid.
Finally, trade interests continue to have an important impact on aid allocation by some bilateral donors. This applies especially to France and Japan. In the estimates for the full sample, French and Japanese aid was by US$ 4–8 million higher in 2000 and 2002 for
19 The post-conflict dummy is listed only in Table 3, as the results for this variable are hardly affected by changes in the measurement of local conditions and the sample of recipient countries. The same applies to the colonial dummy.
recipients with twice as big a share in the total exports of these two donors. The coefficients of the export variable rise dramatically if the sample is restricted to IDA eligible recipients, but this is mainly because trade relations are less intense with these recipients, most of which are not only relatively poor but also relatively small.
Though less pronounced than for France and Japan, trade-related interests have also shaped the aid allocation of other donors, including donors which are often regarded as altruistic. For example, it is in striking contrast to Berthélemy (2005) that Denmark granted more aid in recent years to countries absorbing a higher share of its exports. To some extent, the same is true for Norway and the United States (both for the restricted sample) as well as Germany (especially for the full sample). Results are not clear-cut for the United Kingdom: The export variable turns out to be insignificant if the estimates are based on the restricted sample of IDA eligible recipients. However, this result is sensitive to the specification of the Tobit model; the coefficient becomes significantly positive if population is dropped as a control. By contrast, the export variable remains insignificant for Dutch and Swedish aid, independently of how the model is specified and which sample is underlying the estimates. Hence, it is only for these two donors that it can safely be concluded that the allocation of aid was unaffected by selfish trade interests.
V. CONCLUDING REMARKS
In this paper, we performed a Tobit analysis of aid allocation that accounts for both altruistic and selfish motives on the part of donors. We first compared the allocative behavior of all bilateral donors taken together with that of multilateral aid agencies, and then looked at nine major bilateral donors individually. It turned out that poorer countries get clearly more aid from both bilateral and multilateral donors, with the possible exception of France and Japan. This is very much in line with what Dollar and Levin (2004) found in their recent study. In contrast to Dollar and Levin, however, our estimates do neither suggest that multilateral aid is better targeted to poor countries than to bilateral aid, nor that IDA performs particularly well within the group of multilateral donors.
A more differentiated picture emerges when it comes to the policy orientation of foreign aid. Empirical findings strongly depend on how local conditions are measured. If the World Bank’s CPIA is taken as an indicator of governance in recipient countries, the result is that both bilateral and multilateral donors directed significantly more aid to well governed
recipients. The group of poverty oriented bilateral donors also turns out to be relatively policy oriented. Again, our estimates do not support Dollar and Levin’s conclusion that multilateral donors perform better than bilateral donors, and that the policy orientation of aid provided by IDA is stronger than that of multilateral aid from other sources. If the CPIA is replaced by the Kaufmann index, the policy orientation of aid becomes extremely weak, with a few notable exceptions such as Denmark.
Post-conflict resolution, the third altruistic motive considered here, emerges as a significant determinant of aid allocation only in 2002, driven by France, Sweden and the United States. Given that the prospect of higher aid effectiveness in post-conflict situations has only recently been recognized, this needs-oriented motivation of aid can be expected to gain in importance in the future.
The importance of selfish aid motives clearly differs between bilateral and multilateral donors. Our results provide no indication that donor countries were able to push through their individual trade and political interests at the multilateral level. By contrast, the export-related self interest of DAC countries provided a fairly strong incentive to grant bilateral aid. This applies especially to France and Japan, but export interests have also shaped the aid allocation of donors often regarded as altruistic. It is only for the Netherlands and Sweden that export interests did not at all affect the allocation of aid. Furthermore, colonial ties still play a key role in the aid allocation of former colonial powers.
Taken together, our findings lead to the conclusion that the allocation of aid still leaves much to be desired. In other words, the current focus in the political arena to provide more aid in order to help achieve the Millennium Development Goals tends to ignore that such a move might have minor effects on poverty or income disparities unless major donors such as France and Japan become more poverty and policy oriented and put less weight on their self-interest in providing aid.
As for future research priorities, the most promising next step would be to perform a more disaggregated analysis. This is equally true for the aid and the governance variable. Roodman (2004) argues, for instance, that the motives behind project and program aid might differ. While the former would tend to be given to less well-governed recipients under strict surveillance by donors, the latter would, at least in principle, be tilted in favor of well-governed recipients and involve less external control. With respect to governance, donors might be more inclined to base their decisions on specific issues such as corruption, the rule
of law, or democracy than on fairly complex summary measures. The potential value added of disaggregating aid flows and governance indicators is not confined to getting a better understanding of how aid is actually allocated. As a recent paper by Clemens et al. (2004) illustrates, a careful distinction between different aid categories might also shed new light on the issue of whether aid is effective in raising growth rates, which would in turn inform the discussion about optimal disbursements. In the same vein, disaggregating the conventional governance indicators might reveal that some of their components are more conducive to aid effectiveness than others.
REFERENCES
Alesina, A., and D. Dollar (2000). Who Gives Aid to Whom and Why? Journal of Economic Growth 5(1): 33–63.
Alesina, A., and B. Weder (2002). Do Corrupt Governments Receive Less Foreign Aid?
American Economic Review 92(4): 1126–1137.
Berthélemy, J.-.C. (2005). Bilateral Donors’ Interest vs. Recipients’ Development Motives in Aid Allocation: Do All Donors Behave the Same? Paper presented at the HWWA Conference “The Political Economy of Aid”, Hamburg, mimeo.
Berthélemy, J.-.C., and A. Tichit (2004). Bilateral Donors’ Aid Allocation Decisions: A Three-Dimensional Panel Analysis. International Review of Economics and Finance
13(3): 253–274.
Burnside, C., and D. Dollar (2000). Aid, Policies and Growth. American Economic Review
90(4): 847–868.
Chang, C.C., Fernandez-Arias, E., and L. Serven (1998). Measuring Aid Flows: A New Approach. World Bank, Washington, D.C.
Clemens, M., and S. Radelet (2003). The Millennium Challenge Account: How Much Is Too Much, How Long is Long Enough? Center for Global Development Working Paper 23. Washington, D.C.
Clemens, M., S. Radelet, and R. Bhavnani (2004). Counting Chickens When They Hatch: The Short-term Effect of Aid on Growth. Center for Global Development Working Paper 44. Washington, D.C.
Collier, P., and D. Dollar (2001). Can the World Cut Poverty in Half? How Policy Reform and Effective Aid Can Meet International Development Goals. World Development 29 (11): 1787–1802.
Collier, P., and D. Dollar (2002). Aid Allocation and Poverty Reduction. European Economic Review 46 (8): 1475–1500.
Collier, P., and A. Hoeffler (2004). Aid, Policy, and Growth in Post-Conflict Societies.
European Economic Review 48(5): 1125–1145.
Dollar, D., and V. Levin (2004). The Increasing Selectivity of Foreign Aid, 1984–2002. World Bank Policy Research Working Paper 3299. Washington, D.C.
IDA (2003). Allocating IDA Funds Based on Performance. Fourth Annual Report. Washington, D.C.
Isenman, P., and D. Ehrenpreis (2003). Results of the OECD DAC/Development Centre Experts’ Seminar on “Aid Effectiveness and Selectivity: Integrating Multiple Objectives into Aid Allocations”. DAC Journal 4 (3): 7-25.
Kanbur, R. (2004). Reforming the Formula: A Modest Proposal for Introducing Development Outcomes in IDA Allocation Procedures. Cornell University, mimeo.
Kaufmann, D., A. Kraay, and M. Mastruzzi (2003). Governance Matters III: Governance Indicators for 1996-2002. World Bank Policy Research Working Paper 3106. Washington, D.C. (http://www.worldbank.org/wbi/governance).
Langhammer, R.J. (2004). Halving Poverty by Doubling Aid: Is There Reason for Optimism?
The World Economy 27 (1): 81–98.
McGillivray, M. (2003). Aid Effectiveness and Selectivity: Integrating Multiple Objectives into Aid Allocations. DAC Journal 4 (3): 27–40.
McGillivray, M., and E. Oczkowski (1992). A Two-Part Sample Selection Model of British Bilateral Aid Allocation. Applied Economics 24: 1311–1319.
Neumayer, E. (2003). The Pattern of Giving Aid: The Impact of Good Governance on Development Assistance. Routledge Studies in Development Economics 34. London and New York.
Neumayer, E. (2005). Is the Allocation of Food Aid Free from Donor Interest Bias? Journal of Development Studies 41(3): 394–411.
Nunnenkamp, P., G. Canavire, and L. Triveño (2004). Targeting Aid to the Needy and Deserving: Nothing But Promises? Institute for World Economics, Kiel Working Papers 1229, Kiel, October.
Rodrik, D., and A. Subraminian (2003). The Primary of Institutions (and What This Does and Does Not Mean). Finance&Development 40(2): 31–34.
Roodman, D. (2004). An Index of Donor Performance. Center for Global Development Working Paper 42. Washington, D.C.
Schraeder, Peter J., Steven W. Hook, and Bruce Taylor (1998). Clarifying the Foreign Aid Puzzle: A Comparison of American, Japanese, French, and Swedish Aid Flows. World Politics 50 (January): 294–323.
UNDP (United Nations Development Programme) (2005). Investing in Development: A Practical Plan to Achieve the Millennium Development Goals. Overview. UN Millennium Project 2005. New York (United Nations).
World Bank (1998). Assessing Aid: What Works, What Doesn’t, and Why. Oxford (Oxford University Press).
World Bank (2002). The Role and Effectiveness of Development Assistance: Lessons from World Bank Experience. Research Paper from the Development Economics Vice Presidency. Washington, D.C., mimeo.
Table 1 — Tobit Model Results for Total Bilateral Aid and Multilateral Aid: IDA Eligible Recipients with CPIA Classificationa
Donors Population Donor exports Colonial dummy Post-conflict dummy Per-capita income CPIA Uncen-sored obser-vations Pseudo R² All DAC countries 1999 -1.51 116819 59.0 -20.3 -0.044 40.0 66 0.09 (-5.51)*** (10.33)*** (1.38) (-0.47) (-3.23)*** (2.81)*** 2000 -1.38 98697 45.4 -31.4 -0.052 44.5 66 0.06 (-4.47)*** (7.36)*** (0.99) (-0.67) (-3.55)*** (2.84)*** 2001 -0.56 68684 73.8 13.7 -0.053 61.1 66 0.06 (-2.04)** (5.86)*** (1.56) (0.27) (-3.31)*** (3.75)*** 2002 0.19 38538 25.0 131.8 -0.060 75.5 65 0.04 (-0.60) (2.81)*** (0.43) (2.10)** (-3.26)*** (3.84)*** All multilateral agencies 1999 0.51 371 19.7 -15.5 -0.041 40.9 66 0.06 (3.05)*** (0.05) (0.75) (-0.58) (-4.72)*** (4.70)*** 2000 0.80 -5888 6.9 -7.6 -0.031 27.1 65 0.09 (5.47)*** (-0.93) (0.31) (-0.34) (-4.55)*** (3.66)*** 2001 0.64 -1048 1.5 -37.9 -0.051 38.4 65 0.06 (3.44)*** (-0.13) (0.04) (-1.14) (-4.34)*** (3.35)*** 2002 0.64 -7070 20.6 10.2 -0.041 39.2 65 0.03 (2.64)** (-0.68) (0.47) (0.22) (-2.95)*** (2.62)** IDA 1999 0.40 -1456 10.2 -22.9 -0.022 22.4 57 0.09 (4.15)*** (-0.35) (0.71) (-1.61) (-4.32)*** (4.61)*** 2000 0.65 -6691 6.6 -12.8 -0.020 17.4 60 0.14 (8.41)*** (-2.01)** (0.57) (-1.10) (-4.88)*** (4.33)*** 2001 0.45 -2510 -0.8 -32.9 -0.027 25.9 60 0.07 (4.29)*** (-0.55) (-0.04) (-1.76)* (-3.93)*** (3.86)*** 2002 0.40 -4789 5.6 -6.0 -0.019 26.0 61 0.03 (2.86)*** (-0.80) (0.22) (-0.22) (-2.35)** (2.37)**
at-values in parentheses; ***, **, * significant at 1 per cent, 5 per cent and 10 per cent level, respectively; constant term included , but not reported.
Table 2 — Tobit Model Results for Total Bilateral Aid and Multilateral Aid: IDA Eligible Recipients and Full Sample with Kaufmann Indexa
Donors IDA sample Full sample Donor exports Per-capita income Kaufmann index
Donor exportsb Per-capita income Kaufmann index All DAC countries 1998 31727 -0.0596 0.0490 624.4 3753.0 -0.0136 0.0220 (6.02)*** (- 3.95)*** (2.69)*** (0.59) (3.45)*** (-2.64)*** (1.53) 2000 102314 -0.0496 0.0265 -333.4 2096.1 -0.0102 0.0108 (7.31)*** (-2.94)*** (1.16) (-0.31) (2.12)** (-2.12)** (0.74) 2002 46681 -0.0563 0.0529 59.2 2384.1 -0.0109 0.0019 (3.18)*** (-2.30)** (1.35) (0.06) (2.52)** (-1.72)* (0.08) All multilateral agencies 1998 -3123.9 -0.0349 0.0204 -851.7 1011.3 -0.0101 0.0103 (-0.84) (-3.29)*** (1.59) (-1.73)* (1.91)* (-4.31)*** (1.57) 2000 -2394.5 -0.0319 0.0171 -736.5 753.0 -0.0076 0.0063 (-0.36) (-4.01)*** (1.58) (-1.94)* (1.82)* (-4.10)*** (1.12) 2002 -3360.3 -0.0267 -0.0120 -689.0 459.6 -0.0086 -0.0060 (-0.31) (-1.48) (-0.42) (-1.04) (0.76) (-1.95)* (-0.39) IDA 1998 -3979.4 -0.0148 0.0070 (-1.83)* (-2.90)*** (1.14) — — — 2000 -4357.5 -0.0205 0.0136 (-1.23) (-4.39)*** (2.27)** — — — 2002 -2813.7 -0.0114 -0.0078 (-0.45) (-1.11) (-0.47) — — — at-values in parentheses; ***, **, * significant at 1 per cent, 5 per cent and 10 per cent level, respectively; see text for complete specification of the Tobit model. — bIn italics: results from alternative specification without population as an independent variable.
Table 3 — Tobit Model Results for Selected Bilateral Donors: IDA Eligible Recipients with CPIA Classificationa Donors Donor exports Colonial dummy Post-conflict dummy Per-capita income CPIA Uncen-sored obser-vations Pseudo R² Denmark 1999 1690.9 — -1.78 -0.0061 4.28 44 0.08 (2.42)** (-0.58) (-4.09)*** (3.84)*** 2000 2713.3 — -0.95 -0.0050 3.75 42 0.08 (2.81)*** (-0.33) (-3.92)*** (3.65)*** 2001 1802.1 — -0.94 -0.0061 4.06 43 0.07 (2.09)** (-0.30) (-4.10)*** (3.76)*** 2002 736.7 — 0.21 -0.0051 4.84 47 0.07 (1.24) (0.07) (-4.16)*** (4.58)*** France 1999 8832.7 20.77 -2.96 -0.0022 2.87 60 0.16 (10.48)*** (3.81)*** (-0.61) (-1.28) (1.72)* 2000 6598.4 23.17 -2.94 -0.0028 3.84 60 0.18 (9.52)*** (5.39)*** (-0.76) (-2.09)** (2.80)*** 2001 4767.4 20.72 -0.45 -0.0025 2.56 58 0.20 (10.05)*** (7.15)*** (-0.16) (-2.44)** (2.64)*** 2002 10559.0 6.03 37.98 -0.0041 6.69 59 0.05 (4.26)*** (0.43) (2.88)*** (-0.95) (1.51) Germany 1999 -486.6 — -5.37 -0.0077 6.12 63 0.06 (-0.49) (-1.22) (-5.16)*** (4.26)*** 2000 -252.7 — -2.74 -0.0054 3.60 64 0.03 (-0.21) (-0.68) (-4.10)*** (2.67)*** 2001 655.4 — 0.64 -0.0046 4.27 63 0.06 (0.66) (0.20) (-4.19)*** (3.94)*** 2002 4176.3 — 7.58 -0.0060 6.11 61 0.04 (2.95)*** (1.35) (-3.28)*** (3.28)*** Japan 1999 57513 — -18.79 -0.0075 7.11 66 0.26 (40.52)*** (-1.74)* (-2.11)** (2.03)** 2000 33661 — -36.74 -0.0084 5.52 64 0.12 (13.67)*** (-1.86)* (-1.37) (0.84) 2001 20793.0 — -19.57 -0.0072 10.67 64 0.17 (16.34)*** (-1.48) (-1.69)* (2.45)** 2002 11698 — -14.90 -0.0039 9.19 63 0.14 (10.15)*** (-1.21) (-1.03) (2.27)** Netherlands 1999 103.2 70.72 -0.44 -0.0054 4.16 49 0.11 (0.29) (8.34)*** (-0.18) (-4.69)*** (4.74)*** 2000 140.3 136.35 -1.31 -0.0059 4.98 54 0.11 (0.25) (10.26)*** (-0.35) (-4.60)*** (4.07)*** 2001 498.0 91.84 -2.78 -0.0058 5.21 64 0.07 (0.67) (5.04)*** (-0.59) (-3.54)*** (3.28)*** 2002 -324.3 94.22 8.43 -0.0080 6.89 61 0.07 (-0.53) (4.82)*** (1.50) (-4.18)*** (3.66)***
Table 3 continued Donors Donor exports Colonial dummy Post-conflict dummy Per-capita income CPIA Uncen-sored obser-vations Pseudo R² Norway 1999 1056.2 — 0.69 -0.0037 2.50 52 0.08 (3.14)*** (0.40) (-4.41)*** (4.00)*** 2000 870.5 — 0.74 -0.0026 1.52 54 0.06 (1.65)* (0.50) (-4.02)*** (2.89)*** 2001 411.4 — 1.07 -0.0031 2.19 54 0.07 (2.05)** (0.71) (-4.51)*** (4.02)*** 2002 809.2 — 2.48 -0.0040 3.20 50 0.09 (2.47)** (1.43) (-4.99)*** (4.85)*** Sweden 1999 488.1 — 2.37 -0.0032 2.11 51 0.05 (1.19) (1.15) (-3.47)*** (2.89)*** 2000 717.8 — 1.32 -0.0038 2.76 54 0.05 (0.91) (0.57) (-3.81)*** (3.34)*** 2001 315.6 — 1.10 -0.0032 2.71 50 0.05 (0.59) (0.51) (-3.62)*** (3.62)*** 2002 -141.4 — 4.30 -0.0040 3.57 52 0.08 (-0.48) (2.08)** (-4.53)*** (4.93)*** United Kingdom 1999 297.2 24.20 1.76 -0.0088 5.61 58 0.11 (0.29) (5.14)*** (0.37) (-5.31)*** (3.62)*** 2000 -1324.4 40.74 10.57 -0.0138 10.12 58 0.11 (-0.98) (6.19)*** (1.59) (-6.08)*** (4.44)*** 2001 -1677.7 32.49 13.22 -0.0150 11.02 56 0.07 (-0.97) (4.14)*** (1.62) (-5.05)*** (3.95)*** 2002 18.9 25.38 5.33 -0.0092 6.94 56 0.18 (0.02) (4.89)*** (0.99) (-4.96)*** (3.77)*** United States 1999 9793.2 — 6.37 -0.0059 3.72 63 0.04 (4.51)*** (0.95) (-2.56)*** (1.69)* 2000 13313 — 12.14 -0.0068 5.70 65 0.06 (5.55)*** (1.72)* (-3.07)*** (2.39)** 2001 14163 — -2.22 -0.0080 6.43 63 0.01 (2.12)** (-0.12) (-1.28) (1.02) 2002 12256 — 22.78 -0.0101 8.18 61 0.04 (3.52)*** (2.17)** (-2.95)*** (2.34)**
at-values in parentheses; ***, **, * significant at 1 per cent, 5 per cent and 10 per cent level, respectively; constant term and population included, but not reported.
Table 4 — Tobit Model Results for Selected Bilateral Donors: IDA Eligible Recipients and Full Sample with Kaufmann Indexa
Donors IDA sample Full sample
Donor exports Per-capita
income Kaufmann index Donor exports Per-capita income Kaufmann index Denmark 1998 591.7 -0.0067 0.0041 139.8 -0.0020 0.0025 (1.56) (-4.02)*** (2.86)*** (2.02)** (-5.22)*** (3.46)*** 2000 3272.8 -0.0051 0.0039 141.5 -0.0019 0.0021 (3.09)*** (-3.55)*** (2.53)** (1.93)* (-5.09)*** (3.18)*** 2002 1407.7 -0.0060 0.0061 210.5 -0.0021 0.0030 (2.16)** (-3.76)*** (2.69)*** (2.42)** (-4.98)*** (3.00)*** France 1998 4558.0 -0.0035 0.0025 1320.6 -0.0023 0.0015 (6.12)*** (-1.83)* (1.12) (6.18)*** (-3.13)*** (0.76) 2000 6988.4 -0.0031 0.0040 877.9 -0.0016 0.0020 (10.10)*** (-2.10)** (2.08)** (5.15)*** (-2.96)*** (1.19) 2002 10937.5 -0.0052 0.0097 869.1 -0.0014 0.0021 (4.31)*** (-0.97) (1.16) (2.49)** (-1.09) (0.46) Germany 1998 4957.1 -0.0123 0.0092 297.8 -0.0023 0.0031 (7.75)*** (-4.91)*** (3.52)*** (1.97)** (-3.66)*** (1.72)* 2000 51.2 -0.0059 0.0041 338.8 -0.0018 0.0013 (0.04) (-4.10)*** (2.15)** (3.19)*** (-4.57)*** (1.11) 2002 4508.9 -0.0063 0.0056 312.2 -0.0020 0.0016 (3.05)*** (-2.67)*** (1.53) (2.39)** (-3.38)*** (0.80) Japan 1998 11446 -0.0061 0.0037 1482.6 -0.0052 0.0035 (10.44)*** (-1.05) (0.52) (4.72)*** (-2.71)*** (0.63) 2000 33846 -0.0079 0.0021 1080.7 -0.0041 0.0006 (13.45)*** (-1.15) (0.23) (2.40)** (-1.78)* (0.08) 2002 11960 -0.0004 -0.0019 660.4 -0.0028 0.0013 (10.04)*** (-0.09) (-0.25) (2.78)*** (-1.77)* (0.21) Netherlands 1998 1013.8 -0.0050 0.0047 147.8 -0.0019 0.0025 (1.47) (-3.68)*** (2.95)*** (1.70)* (-5.55)*** (3.06)*** 2000 251.6 -0.0056 0.0031 134.3 -0.0019 0.0019 (0.41) (-3.73)*** (1.68)* (1.55) (-4.80)*** (2.26)** 2002 -498.1 -0.0065 0.0016 28.6 -0.0010 -0.0002 (-0.75) (-2.61)*** (0.42) (0.20) (-1.85)* (-0.10) Norway 1998 1798.9 -0.0040 0.0018 20.6 -0.0011 0.0012 (2.91)*** (-4.02)*** (2.11)** (0.45) (-4.80)*** (2.71)*** 2000 1094.9 -0.0024 0.0008 -11.0 -0.0004 0.0002 (1.97)** (-3.39)*** (1.05) (-0.42) (-3.60)*** (0.53) 2002 569.4 -0.0037 0.0019 10.7 -0.0008 0.0004 (1.47) (-3.60)*** (1.35) (0.27) (-3.40)*** (0.65) Sweden 1998 102.9 -0.0031 0.0013 48.2 -0.0009 0.0010 (0.51) (-2.93)*** (1.28) (1.12) (-4.08)*** (1.99)** 2000 933.5 -0.0034 0.0013 15.5 -0.0008 0.0008 (1.10) (-3.03)*** (1.09) (0.40) (-3.74)*** (1.33) 2002 56.0 -0.0040 0.0026 32.1 -0.0008 0.0008 (0.17) (-3.48)*** (1.75)* (0.65) (-3.40)*** (1.07) United Kingdom 1998 676.4 -0.0090 0.0036 200.5 -0.0019 0.0028 (0.69) (-4.48)*** (1.58) (1.98)** (-3.93)*** (2.26)** 2000 -1469.7 -0.0121 0.0034 292.9 -0.0028 0.0034 (-0.99) (-4.53)*** (0.99) (1.62) (-3.94)*** (1.90)* 2002 -615.9 -0.0090 0.0033 345.2 -0.0028 0.0032 (-0.65) (-3.79)*** (0.92) (1.70)* (-3.25)*** (1.25) United States 1998 2025.4 -0.0046 0.0036 -2.4 -0.0019 0.0021 (1.96)** (-2.76)*** (1.85)* (-0.03) (-2.30)** (0.96) 2000 14045.7 -0.0061 0.0020 49.8 -0.0026 0.0006 (5.71)*** (-2.39)** (0.59) (0.51) (-2.81)*** (0.23) 2002 13271.2 -0.0071 -0.0029 194.9 -0.0038 -0.0040 (3.68)*** (-1.66)* (-0.43) (1.48) (-2.25)** (-0.71) at-values in parentheses; ***, **, * significant at 1 per cent, 5 per cent and 10 per cent level, respectively; see text for complete specification of the Tobit model.
Appendix: Data and Sources
Variable Description Source
Aid Net disbursements of official
development assistance, without emergency relief; US$ million.
http://www.oecd.org/dac/stats/statlinks
Colonial dummy Set equal to “one” for former colonies of Belgium, France, the Netherlands and the United Kingdom
Information provided by Jean-Claude Berthélemy
CPIA Country Policy and
Institutional Assessment; classification of IDA eligible countries into quintiles, with “one” assigned to countries with least favorable policies and “five” assigned to those with most favorable policies.
International Development Association
http://siteresources.worldbank.org/IDA/ Resources/QuintilesCPIA2003.pdf (and earlier versions)
Donor exports Share of exports of donor country j to recipient country i
in total exports of donor country j; per cent; lagged one year.
IMF, Direction of Trade Statistics Yearbook, various issues
Kaufmann index Estimated residuals from regressing GDP per capita on the summary index of institutional conditions in recipient countries.
Own calculations based on Kaufmann et al. (2003)
Per-capita income GDP per capita of recipient countries in purchasing power parities; current international US$
World Bank, World Development Indicators, CD-ROM
Population Population of recipient countries; million
World Bank, World Development Indicators, CD-ROM
Post-conflict dummy Set equal to “one” for recipient countries which received grants from the World Bank’s Post Conflict Fund
http://wbln0018.worldbank.org/essd/sdv/ pcf.nsf/EHome?OpenView