Summary
ENERQI Guide (Deliverable 3.2)
(20
thFebruary 2012)
Coordinator:
DTV Consultants, Mr. Johan Janse, PO Box 3559, 4800 DN, Breda, The Netherlands, +31 76 513 6631 [email protected]
Author:
TIS, Mr. João Bernardino
Av. Marquês de Tomar, nº 36 6º andar, 1050-153 Lisbon
Phone: +351 21 350 44 00 Email: [email protected] Start date of the action: 29th of May 2010
End date of the action: 28th of May 2013
Duration: 36 months
Project website:
http://www.enerqi-online.eu
Grant agreement no. IEE/09/718/SI2.558241 – ENERQI, Energy efficiency by using daily customers' quality observations to improve public transport
Summary of the ENERQI Guide
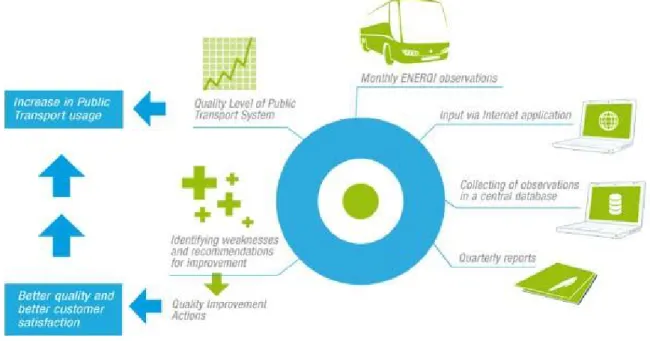
The ENERQI Guide provides guidance for the planning, implementation and operation of a public transport quality monitoring scheme based on regular observations by customers.
The ENERQI approach consists of measuring public transport service quality by involving present and potential customers in the observation and reporting of pre-defined quality aspects on a regular basis. It intends to provide continuous monitoring of public transport quality and to identify appropriate measures to improve quality. Additionally, it allows us to closely evaluate the impact on perceived quality of new measures undertaken, as well as our communication campaign.
This process emerges as a “quality loop”, giving direct inputs to the management of the public transport operator and authority. Therefore, a closer customer relation management is made possible. In the end, the “real time” availability and use of quality monitoring information will lead to an increased use of public transport and lower consumption of energy, environmental emissions and congestion through less private car use.
Figure 1 – The ENERQI Quality Loop
Up-to-date monitoring of perceived user quality, a tool for decision making at the operation and strategic level, while enhancing the relationship between customers and operator and saving resources are the main advantages of quality monitoring.
The setup phase of the ENERQI approach can be summarised in six main steps. They are:
1. Defining objectives – Particular local high and bottom level objectives have influence on the appropriate design of the scheme. For a good design it is essential to firstly clarify the objectives of the quality monitoring in the site in question.
2. Choosing targeted services – The object of quality monitoring, i.e. the targeted public transport services or lines and schedules to be covered, should be defined a priori??, in line with the objectives of the quality monitoring – which may be related to specific groups of users or characteristics of the network and considering cost-effectiveness issues. The following recommendations are given: a) Define the network and services to observe; b) Focus on services that you can change; c) If resources are limited, focus on services with higher demand; and d) If your objective is increasing PT usage, focus on services with higher sensitivity of demand to quality.
3. Defining perceived quality indicators – The indicators should provide the closest possible picture of quality as perceived by customers. The choice of appropriate quality indicators should be based on the main objectives at hand and the characteristics and expectations of the local PT users. For benchmark purposes, followers of the methodology are encouraged to use similar indicators to those used in ENERQI.
4. Survey design and assignment – Surveys are regularly given to observers for them to monitor specific trips. In terms of survey application, the first step is to provide guidelines about the timing and location of the inputs given by the observers, which may follow different approaches, like regular vs. irregular basis. Secondly, several types of survey formats may be used, depending on the type of observers: Paper survey, internet access, interest groups consulting (students, elderly people), quality audits, mystery client etc.
5. Constitution of the observers’ panel – A panel of regular, trained observers is assembled beforehand. For analysis and resource management purposes, it is desirable that this pool of observers is maintained along the period of observations. Important issues in this task are the definition of target groups of observers, their sampling, their recruitment process, their instruction/training and finally the process of communication with them.
6. Database and management system development – A database is required to gather all the information provided by the observers and other relevant information. Also, there must be a system of information analysis and interaction with the observers. The system developed within ENERQI can be replicated or easily directly applied by followers of the methodology.
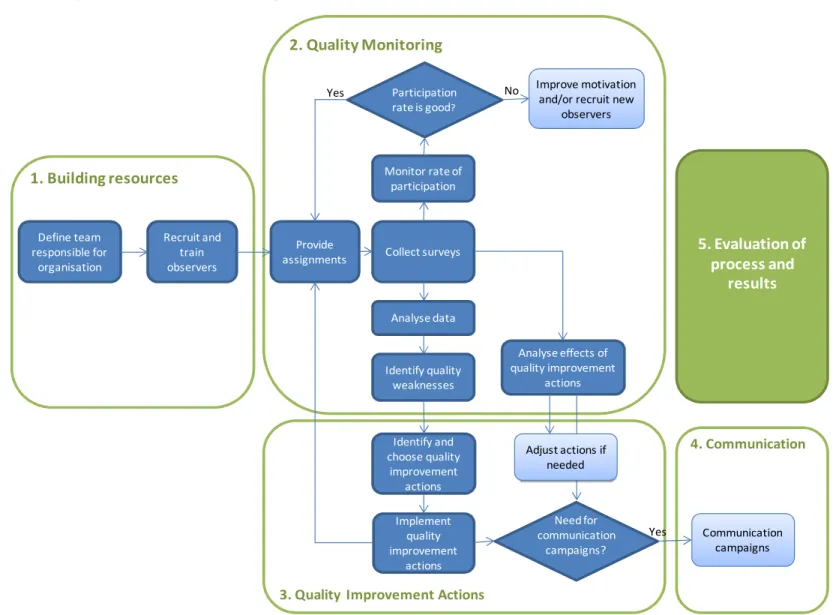
In the operation phase the resources to implement the observer based quality monitoring are gathered, then observations are carried out, data is obtained and analysed and quality improvement actions may be introduced. This phase consists of five types of tasks:
1. Building resources – Setting-up the necessary resources for the operation process. The activities include setting up the team responsible for the management of the monitoring system, the observer recruitment, the observer training, establishing channels of communication with observers and involving possible stakeholders.
2. Quality monitoring – This phase is where the process unfolds: the assignments are provided to the observers and the observers answer the questionnaires which are then submitted into the database. With the information that comes from the observations, different types of analysis are done to best assess the quality of service and evaluate which should be the most cost-effective quality improvement measures. Additionally, the level of participation of observers is monitored in order for us to motivate them or refresh the group of volunteers if necessary.
3. Quality improvement actions – This step deals with the decision on the choice of quality improvement actions to carry out in response to the feedback provided by the monitoring process or fine-tuning of previous actions. The quality improvement actions should be outlined following a cost-efficiency perspective. The goal should be to improve quality as much as possible with a minimum consumption of additional resources. These quality improvement actions should seek to respond to the public transport service needs and can be used to transform the attitudes of users. The choices have nevertheless to take into account the implementation costs and feasibility of this quality improvement actions.
4. Communication with the public - The ultimate objectives of ENERQI can only be fully achieved if the quality improvement actions implemented locally are properly translated into perceived quality by regular and non-regular public transport users. To achieve this goal, communication actions may be necessary. In the case of regular customers, it is not guaranteed that quality improvements delivered will actually translate into improvement of perceived quality, since the users may not notice the changes in question. In these cases, it may be useful to undertake communication campaigns in order to bring delivered quality into perceived quality.
5. Evaluation of process and high level results - In order to take full advantage of the lessons learned from the ENERQI process and to provide additional inputs for daily and strategic public transport management, the public transport operator should periodically evaluate the results of the costumer based continuous quality monitoring. These may include a general evaluation of the evolution of quality perceptions, the attainment of high level results and the methodology implementation process itself.
For a more detailed description of the tasks and choices involved in each step, please consult the ENERQI Guide (available in English only).
For further questions or more detailed advice, you can also contact your local ENERQI partner: [each partner to insert name organisation, contact person, email, phone]
5
4. Communication
3. Quality Improvement Actions
1. Building resources 2. Quality Monitoring Define team responsible for organisation Recruit and train observers Provide
assignments Collect surveys Monitor rate of participation Analyse data Identify quality weaknesses Participation rate is good? Improve motivation and/or recruit new
observers Communication campaigns Identify and choose quality improvement actions Implement quality improvement actions Need for communication campaigns? Analyse effects of quality improvement actions 5. Evaluation of process and results No Yes Yes Adjust actions if needed