Evaluation of the Social Skills of Full-Time, Online
Public School Students
May 2009
Interactive Educational Systems Design, Inc.
Jay Sivin-Kachala, Ed. D., and Ellen Bialo
33 West 87th Street, Suite 2A
Introduction 3
Online Public Schools: A Description 3
Purpose of This Research 4
Literature Review 4
Socialization and Conventional Schools 4
Socialization and Online Schools 5
Socialization in the Absence of Face-to-Face Contact: Results from Home-Schooling Research 5
Summary 6
Evaluation Research Questions 7
Description of the Target and Comparison Groups 7
Target Group 7
Comparison Group 8
Selection of Schools, Students, and Teachers 8
Implementation Procedure 8
Participant Totals 9
Evaluation Research Methodology 9
Data Collection Instruments 9
Assessment Administration 12
Data Analysis Procedures 14
Results 16
Analysis for Research Question 1 16
Analysis for Research Question 2 19
Analysis for Research Question 3 21
Analysis for Research Question 4 22
Analysis for Research Question 5 24
Analysis for Research Question 6 25
Analysis for Research Question 7 27
Analysis for Research Question 8 28
Analysis for Research Question 9 28
Analysis for Research Question 10 29
Conclusions 31
Social Skills 31
Problem Behaviors 32
Time Enrolled in Full-Time, Online Public Schools 33
Parent Reasons for Enrollment in Full-Time, Online Public Schools 34
Student Activities Outside the School Day 34
Experiences with Online Public Schools 35
Limitations of This Study 35
Recommendations for Future Research 36
References 37
Abstract
Concern has been expressed that students enrolled in online public schools may suffer from a lack of
opportunities for socialization, and consequently may fail to develop important social skills. In order to address this issue, an evaluation research study focusing on the social skills of students in grades 2, 4, and 6 attending full-time, online public schools was conducted February through August 2008 by Interactive Educational Systems Design (IESD), Inc., in collaboration with staff from The Center for Research in Educational Policy (CREP) at the University of Memphis (TN). The primary purpose of this research was to compare parent, teacher, and student self-assessments of the socialization skills of typical, mainstream students who have been attending full-time, online public schools to national norms for the same assessments.
The study followed a posttest-only, treatment-comparison design. The treatment group consisted of students in grades 2, 4, and 6 from four full-time, online public schools in Arizona, California, Idaho, and Ohio. The comparison group was the norming sample population for the Social Skills Rating System (SSRS), published by Pearson Assessments (Gresham & Elliot, 1990). Information was also collected from parents (via survey) about reasons for choosing a full-time, online public school; students’ involvement in activities outside of school; and parents’ perspectives on the impact of online public schooling.
The study was approved by the governing boards of the four participating online public schools and was sponsored by K12 Inc., a supplier of curriculum and technology resources to these schools. However, the findings and conclusions were the result of IESD and CREP’s independent analysis of the collected data.
With respect to social skills, SSRS parent ratings of their children were significantly higher than national norms across the elementary grades and in every grade/gender category, both on the Total Scale and on most subscales (Responsibility subscale; Self-Control subscale; Assertion subscale, except for 6th grade males; and Cooperation subscale, except for 6th grade females). Similarly, student self-ratings on social skills were
significantly higher than national norms across the elementary grades and in every grade/gender category, both on the Total Scale and on most subscales (Responsibility subscale; Cooperation subscale; and Assertion subscale, except for 6th grade males); however, student self-ratings were significantly lower on the Self-Control subscale across every grade/gender category. In contrast, teacher ratings of students across the elementary grades enrolled in full-time, online public schools were significantly higher than national norms on the Self-Control subscale; however, they did not differ significantly from national norms on the Social Skills Total Scale or the other subscales (Responsibility subscale, Assertion subscale, and Cooperation subscale).
With respect to problem behaviors, SSRS parent ratings of students enrolled in full-time, online public schools were significantly lower than national norms across the elementary grades and in every grade/gender category except 6th grade males, both on the Total Scale and on most subscales (Externalizing subscale; Internalizing subscale; and Hyperactivity subscale, except for 4th grade males). For 6th grade males, the Problem Behaviors subscales and Total Scale were not significantly different. Teacher ratings of students across the elementary grades enrolled in full-time, online public schools were significantly lower than national norms on the Problem Behaviors Total Scale and each subscale (Externalizing subscale, Internalizing subscale, and Hyperactivity subscale). (SSRS student self-ratings do not address problem behaviors.)
Comparing students who had been enrolled in full-time, online public schools for a year or less with those who had been enrolled for more than one year, there were no significant differences in parent ratings of either social skills or problem behaviors, with the single exception of the Self-Control social skills subscale, which was significantly higher for students who had been enrolled longer. This suggested that there was no cumulative long-term decrease in social skills based on enrollment in full-time, online public schools.
In addition to these main findings, the study found that the reasons parents most often identified for choosing full-time, online public schools for their children were all parent concerns (as opposed to concerns about their children or the school): a majority sought a home-based environment, but with the active support and structure of the public school system; a learning environment consistent with their family values; and more involvement in their children’s education.
The data also indicated that students enrolled in full-time, online public schools were highly engaged in activities outside of the school day. Both activities involving peer interaction and those not involving peer interaction were significantly correlated both to the Total Social Skills Scale and to all but one of the Social Skills subscales for students enrolled in full-time, online public schools. The single exception was the Self-Control subscale, which was significantly correlated to activities involving peer interaction, but was not significantly correlated to activities not involving peer interaction. In general, as the frequency of outside activities increased, the Social Skills ratings increased.
Finally, parents noted their children’s improvement in a variety of areas, including skill in using technology, balanced development of skills across many areas of learning, and academic progress in subject areas.
Introduction
This is the final report of an evaluation research study focusing on the social skills of students in grades 2, 4, and 6 attending full-time, online public schools supported by the K12 curriculum and technology resources. The
research was conducted February through August 2008 by Interactive Educational Systems Design (IESD), Inc., in collaboration with staff under subcontract from The Center for Research in Educational Policy (CREP) at the University of Memphis (TN). This study was sponsored by K12 Inc.; however, the findings and conclusions presented herein represent IESD and CREP’s independent analysis of the collected data.
Online Public Schools: A Description
Online schooling—also referred to as virtual schools, cyber schools, e-learning, and distance learning—is a growing phenomenon in U.S. public school systems.
Barker, Wendel and Richmond (1999) defined a “virtual” public school as “one that offers the mandated provincial instructional program [the equivalent of state curriculum standards in the U.S.] to students through web-based means (i.e., computer-mediated and online via the Internet)” and one that is “characterized by a structured learning environment under the direct supervision of a teacher, web-based delivery to home or in a setting other than that of the teacher, and contains instruction that may be synchronous or asynchronous” (p. 2).
Common characteristics of such programs include instruction delivered via a learning management system (LMS); courses divided into lessons and units; online course content that includes a combination of text, multimedia, and interactive tools; off-computer materials “including textbooks and hands-on materials, to complement the content delivered via the Internet”; a combination of real-time and asynchronous communication between students and teachers (and in some cases among students); and online assessments (Watson, 2007, p. 10).
Online learning programs are being used to provide educational opportunities to a variety of students with unique circumstances, including “at-risk students,…dropouts, migrant youth, pregnant or incarcerated students, and students who are homebound due to illness or injury” (Watson, 2007, p. 5). Full-time, online public schools are required to “address accountability measures in the same way as all other public schools” (Watson, 2007, p. 5).
Significant online learning programs have been identified in 44 states, and full-time, online public schools have been identified in 21 states (mostly online charter schools) (Watson, Gemin, & Ryan, 2008). In 2007, the Peak Group estimated 1 million online enrollments—up from 500,000 in 2005 (cited in NACOL, 2008). More specifically, it was estimated that as of January 2007, more than 90,000 students were enrolled in virtual charter schools—up from approximately 31,000 students in 2004-2005 (NACOL, 2008, citing statistics from the Center for Education Reform).
Purpose of This Research
The primary purpose of this research project is to compare parent, teacher, and student self-assessments of the socialization skills of students who have been attending full-time, online public schools to national norms for the same assessments.
A secondary purpose is to collect important information about the reasons students attend online public schools, student activities outside of school, and parents’ perceptions of the impact of online public schooling.
Literature Review
A growing number of states and school districts within the United States are offering online public schooling, also known as virtual or e-learning programs, intended to provide students with high quality supplemental or full courses of instruction personalized to their needs (U.S. Department of Education, 2006a). The potential merits of online public schools were acknowledged when “Support e-learning and virtual schools” was named as one of seven “action steps” in the U.S. Department of Education’s “National Education Technology Plan” (U.S. Department of Education, 2006b).
Online public schooling programs represent a fundamental change in the ways that students interact with teach-ers, administrators, and other students, raising important questions about the impact on children’s’ intellectual and social development. Specifically, some concern has been expressed that students enrolled full-time in online public schools may suffer from a lack of opportunities for socialization, and consequently may fail to develop important social skills.
Socialization and Conventional Schools
Socialization is commonly defined as “the process whereby people acquire the rules of behavior and systems of beliefs and attitudes that equip a person to function effectively as a member of a particular society” (Medlin, 2000). Socialization skills play a critical role in children’s ability to develop successful relationships, and are importantly related to early academic success (Gresham & Elliot, 1990; Griffin, 1997).
For most elementary school children, conventional schooling is the predominant area for socialization and is where many social skills are modeled and learned (Tasmajian, 2002). Tasmajian (2002) examined the acquisition of social skills in elementary children, and reported that “school is the first agency that encourages children to develop loyalties and sentiments that go beyond the family and link them to a wider social order.” However, online schools by their very nature do not provide students with regular, formal face-to-face classroom contact with other children and teachers. Thus, the growing popularity of online schools and e-learning programs represents the latest challenge to the common understanding of “a place called school” (Roblyer, 2006). Many researchers have examined the role of the school as an agency of socialization (Merrell, 2001; Tasmajian, 2002). Research has indicated that socialization occurs through both the formal social structure (teachers and related school personnel) and the informal social structure (peers) of schools (Hartup, Higgins, & Ruble, 1983). However, it has not proven possible for researchers to separate social skills that are developed within the school
from those that are learned and developed outside of school through involvement in sports, music, or other activities (Tasmajian, 2002).
Socialization and Online Schools
Currently, there is a lack of research addressing the effects of online schooling on socialization and the development of social skills, probably due to the fact that online learning is a relatively new phenomenon. Online schooling went unnoticed by educators and school districts until the mid 1990s, and many people are still unaware that online schooling “is one of the fastest-growing areas in K-12 education” (Roblyer, 2006). Pioneering researchers attempting to study the issue of socialization in online learning programs have encountered problems in defining socialization and its role within the context of online classrooms, where face-to-face communication is not available (Irwin & Berge, 2006). For instance, interactions with peers undoubtedly influence children’s socialization, but when these interactions are removed from the physical classroom and conducted through online communication, the extent of their influence becomes unclear (Irwin & Berge, 2006).
In a NACOL white paper, Watson and Gemin (2008) described promising practices that online schools have implemented with the goal of fostering student social interaction. These practices included student
interactions with online teachers; online interactions among students; and real-world, face-to-face interactions among students. However, this report did not present formal research on the outcomes of such promising practices, in terms of measuring students’ social skills development.
Socialization in the Absence of Face-to-Face Contact: Results from
Home-Schooling Research
Concerns relating to the lack of face-to-face contact among teachers, students, and their peers are not unique to online schools, and have long been a source of debate surrounding home-schooling programs (Lubienski, 2000; Van Galen & Pitman, 1991). Roblyer (2006) reported the following:
As the home-schooling movement showed that students can learn successfully from parents in homes, virtual schooling shows that they can learn “anywhere, anytime, anyplace,” without ever meeting a teacher in person. Both kinds of schooling profit from the absence of issues that often slow learning to a crawl in traditional schools: the physical plant, behavior problems, special needs, and lack of motivation (p. 5). While research is lacking in the area of socialization and online schooling, a great deal of research has focused upon the development of social skills in home-schooling, where learning also takes place in the absence of face-to-face contact with teacher and peers.
As the practice of home-schooling grew in popularity, scholars, educators, and legislators began to voice concerns about the possibility that home-schooled children might experience a “lack of socialization” or “isolation from the world” (Lubienski, 2000; Van Galen & Pitman, 1991). Since then, several studies have examined the differences in socialization between home-schooled and traditionally schooled children.
Although some debate still exists, the majority of available research suggests that the social skills acquired by home-schooled children are at least equal to those of children attending conventional schools (Francis & Keith, 2004; Kitchen, 1991; Koehler et al., 2002; Shyers, 1992; Smedley, 1992; Stough, 1992). Researchers utilizing parental ratings of their children’s socialization skills (e.g., empathy, cooperativeness) have found that home-schooled children are no different than traditionally home-schooled children (Francis & Keith, 2004; Stough, 1992). A growing amount of evidence suggests that the social skills of home-schooled children may actually surpass those of their traditionally schooled counterparts (Koehler et al., 2002; Shyers, 1992; Smedley, 1992). For example,
Smedley (1992) in a master’s thesis at Radford University used the Vineland Adaptive Behavior Scales (structured interview of parents) to assess socialization skills in home-educated and conventionally educated children. This study found that children schooled at home were more mature and better socialized (84th percentile) than those who were sent to school (27th percentile). Smedley concluded that public school students are socialized “horizontally” into conformity by their same-age peers, while home-schooled students are socialized “vertically” toward responsibility and adulthood by their parents. Koehler et al. (2002) studied 23 children utilizing the Social Skills Rating Scale (Gresham & Elliot, 1990). Seven were home-schooled, and 16 were publicly educated. Parent ratings indicated that home-schooled children scored above average in relation to overall social skills while public-schooled children scored average.
While many studies utilizing parental ratings indicate a positive trend regarding the socialization of home-schooled children, Koehler et al. (2002) note that it is important to consider that parental ratings are prone to reporter bias, thus inflating variation between home-schooled children and those attending regular schools. Similar results, however, have also been reported from other kinds of studies, based on data that are less susceptible to reporter bias. Shyers (1992) compared the actual behaviors of two groups of 70 children from the ages of 8 to 10. One group was home-schooled and the other group was drawn from public and private schools. This was a “blind” study, in which the children’s behaviors were evaluated by trained observers who did not know which of the students were home-schooled and which were not. The Child Observation Checklist Direct Observation Form was used to categorize each child’s conduct while playing in mixed groups of children from both sample groups. The home-schooled children were found to exhibit significantly fewer problem behaviors than the children from public and private schools.
Recent research has indicated that home-schooled children, who are socialized outside of the traditional face-to-face interactions that define traditional schools, are no less capable of becoming productive, participating adult members of society (Knowles, 1991; Ray, 2003; Webb, 1989). Knowles (1991) studied more than 1,000 Michigan adults who had been home-schooled. None were unemployed or on welfare (compared to 5.6% and 11.2%, respectively, for the average population). A full 94% said that home-schooling helped prepare them to be independent persons, and 79% said that it helped them to interact with those from other levels of society. There is also research suggesting that home-schooled children are especially well prepared for the academic and social demands of higher education (Galloway & Sutton, 1997; Webb, 1989). Galloway & Sutton (1997) examined leadership abilities in undergraduates from public, private, and home schools. Results revealed that home-schooled college students ranked highest in campus life leadership activities. In sum, there is a growing amount of evidence indicating that the post-adolescent performance and adjustment of children are not dependent upon the socializing agents of traditional schools (Galloway & Sutton, 1997; Knowles, 1991; Ray, 2003; Webb, 1989).
An important caveat about this entire body of research is that many of the studies have targeted small numbers of students (i.e., fewer than 100), restricting the ability to generalize to the larger population.
Summary
Conventional schooling has traditionally been viewed as a primary vehicle for socialization of children. This perception has resulted in concerns that children who do not receive conventional schooling may lack adequate opportunities to develop their social skills. Despite these concerns, most of the limited research on children who have been home-schooled has found that these children’s socialization is equal, and in some cases superior, to that of children who attend conventional schools. While this research is not directly applicable to students in other schooling situations—such as online public schools—it suggests that at least in some cases, students appear to acquire adequate social skills from settings that do not include face-to-face interaction with other children and teachers in a traditional classroom environment.
Thus far, no substantial body of research exists on the question of how online schooling impacts students’ socialization. The present study was designed to help address this research gap by comparing parent, state certified public school teacher, and student self-assessments of the socialization skills of students who have been attending online public schools (more than 250 students total) to national norms for the same nationally recognized assessment. This study also collected important information about the reasons students attend online public schools, student social and individual activities outside of school, and parents’ perceptions of the impact of online public schooling.
Evaluation Research Questions
This evaluation study of full-time, online public schooling investigated the following questions focusing on students’ social skills:
1 Are parental ratings of the social skills of their children enrolled in full-time, online public schools different from a national sample of parental ratings of children of comparable ages/grades and genders in traditional public schools?
2 Do parental ratings of their children’s social skills differ as a function of children’s time enrolled in full-time, online public schools?
3 Are teacher ratings of the social skills of children enrolled in full-time, online public schools different from a national sample of teacher ratings of children of comparable ages/grades and genders in traditional public schools?
4 Do the self-ratings of social skills of children enrolled in full-time, online public schools differ from the self-ratings of a national sample of children of comparable ages/grades and genders in traditional public schools?
5 What are parents’ reasons for choosing full-time, online public schools for their children?
6 What is the frequency of participation for students in full-time, online public schools in a variety of activities outside the school day that involve and do not involve peer interaction?
7 What are parents’ perceptions of the impact of full-time, online public schooling on specific outcomes, including outcomes related to children’s academic performance, attitude toward school and schoolwork, behavior with other children, and self-esteem?
8 Are there relationships between parent reasons for enrolling children in full-time, online public schools and the social skills ratings they assign to their children?
9 Are there relationships between frequency and type of children’s activities outside the school day and social skills ratings for students enrolled in full-time, online public schools?
10 What do parents see as the benefits and/or disadvantages and challenges of full-time, online public schooling?
Description of the Target and Comparison Groups
Target Group
All four schools selected as part of the study belonged to an informal network of online public schools that use the K12 online curriculum and many of its administrative services. The four schools were:
• Arizona Virtual Academy (AZVA)
• California Virtual Academy (CAVA)/San Diego • Idaho Virtual Academy (IDVA)
The schools offered students in grades K-8 coursework in Language Arts/English, Mathematics, History, Science, Art, and Music. A state-certified public school teacher, hired by the school, was assigned to each student to guide and track the student’s progress through the curriculum. Teacher communication with students and their parents (or other responsible adults) took place via e-mail, telephone, online meetings, and regular face-to-face meetings. Instruction was delivered online via a learning management system, with lessons featuring a mixture of online and offline teaching tools, including interactive animations, printed books with illustrations and narrative, original CDs and videos, and hands-on materials for experiments. Additionally, each family received a loaner computer and subsidized Internet access.
The parent (or other responsible adult) served as a “learning coach” to the child, helping facilitate progress through the daily lessons and working to modify the pace and schedule according to the child’s needs, while working closely with the teacher. Students were expected to put in four to six hours of study each day. A suggested lesson plan was provided for the parent each week, which updated automatically as the student progressed. Student-student interaction was stressed through online discussions and field trips. Lessons were followed by assessments to ensure that students had mastered a particular area before moving on.
Because these were public schools, they were tuition-free to the families of the attending students. Each of these online public schools was required to follow its state’s mandates related to enrollment, operation, health, and all forms of assessment and accountability. Each school adhered to its state’s testing requirements for students and to other applicable public school policies and procedures.
Comparison Group
Results from the Social Skills Rating System (SRSS) for students from the selected online public schools were compared to national public school norms for the SRSS, as reported in Social Skills Rating System: Manual (Gresham & Elliot, 1990). The comparison group for this study thus represented students in traditional, face-to-face, public school classrooms. (For additional details on the SSRS norming sample, see Information About the Social Skills Rating System [SSRS], in the Evaluation Research Methodology section, later in this paper.)
Selection of Schools, Students, and Teachers
The study assesses students’ social skills in grades 2, 4, and 6, enrolled in four separate and distinct full-time, online public schools, operating in four different states in the U.S. Criteria for participation included the following:
1 Each school had to have been in operation for three or more years.
2 Each school had to agree to distribute and collect consent forms to parents of students selected for possible participation.
3 Each school had to assign an evaluation coordinator, who served as a liaison to the participating parents and students—to get them to meet their responsibilities toward the study.
4 The lead administrator of each school, with the consent of its governing board, had to indicate in writing the school’s desire to participate and its commitment to criteria 2 and 3 above.
Implementation Procedure
Each school provided to IESD and CREP the names and addresses of parents agreeing to participate in the study. A mix of students in grades 2, 4, and 6 was sought, including both (a) students for whom 2007-2008 was their first school year attending a full-time, online public school, and (b) students who had attended such a school for more than one school year.
Students who were identified by their schools as emotionally handicapped, behaviorally handicapped, severely mentally handicapped, or autistic were excluded from the study. The reason for excluding students in these
categories was to focus on social skills among the typical range of mainstream public school students. In keeping with this focus, data from the full-time, online public school students were compared wherever possible with SSRS norms that excluded handicapped students: i.e., in the whole-group comparisons with elementary SSRS norms. However, this could not be done with the comparisons for specific grade/gender categories, since the SSRS norms by grade/gender categories grouped together both handicapped and non-handicapped students, and norms for non-handicapped students only were not provided.
The schools sent parents an introductory letter about the evaluation program, which included a consent form. The letters asked for parent participation in the study, as well as the participation of their 4th and/or 6th grade children as applicable. Packets containing directions, the instruments, and a stamped return envelope were mailed by CREP to each parent that had consented to participate.
Participating teachers were selected by the school administration. Each participating teacher completed an SSRS form for one or two children with whom they had worked for at least two years.
Participant Totals
A total of 276 SSRS Parent forms were received from 4 online public schools for students enrolled in grades 2, 4, and 6. SSRS Student self-assessment forms were collected from 176 children in grades 4 and 6. Teachers submitted a total of 58 SSRS Teacher forms on students in grades 2, 4, and 6. The number of forms received by type, grade, and gender is shown in Table 1. A total of 279 Parent Information Questionnaires were completed and submitted by parents.
Table 1.
Online Public School Study Participants by Grade and Gender
2nd Grade 2nd Grade 4th Grade 4th Grade 6th Grade 6th Grade Total Females Males Females Males Females Males
Parents 48 53 49 48 39 39 276
Students NA NA 50 49 38 39 176
Teachers 12 22 6 6 7 5 58
Evaluation Research Methodology
The study followed a posttest-only, treatment-comparison design. The treatment group consisted of students in grades 2, 4, and 6 from four full-time, online public schools that utilize K12 curriculum and technology resources.
The comparison group was the norming sample population for the SSRS, as reported in Social Skills Rating System: Manual (Gresham & Elliot, 1990). Given the constraints of the evaluation, random assignment was not a feature of the study.
Data Collection Instruments
The research included the following data collection instruments: • Social Skills Rating System (SSRS)
- Parent Rating Form: This was completed by parents of online public school students in grades 2, 4, and 6 in the four selected schools during May-July 2008.
- Teaching Rating Form: This was completed by teachers of online public school students in grades 2, 4, and 6 in the four selected schools during May-July 2008.
- Student Self-Rating Form: This was completed by online public school students in grades 4 and 6 in the four selected schools during May-July 2008.
The SSRS Student form and Teacher form were included in this evaluation design to strengthen the validity of the findings. If assessment of students’ social skills were to be based solely on a parent-completed instrument, the results might be perceived as biased in favor of the finding that students have strong social skills.
For more information about the SRSS, see the Information About the Social Skills Rating System (SSRS) section below.
• Parent Information Questionnaire (PIQ): This questionnaire, developed by the researchers, was completed by parents of online public school students in grades 2, 4, and 6 in the four selected schools during May-July 2008. The PIQ was used to collect information about:
− Reasons for choosing a full-time, online public school (e.g., parents wanting more involvement in their child’s education, children needing an individualized approach to learning, or concerns about school safety). Parents chose from a list all the reasons that applied.
− Types of children’s activities (e.g., sports involving other children, religion-affiliated or cultural
organizations, classes or lessons involving or not involving other children). Parents rated their children’s frequency of participation for each item on a list.
− Outcomes (e.g., academic performance, attitude toward school and schoolwork, behavior with other children, self-esteem) for which parents indicated “better,” “no change,” or “worse.”
− Stories, anecdotes, and/or thoughts related to the family’s experience with their online public school (addressed through an open-ended question)
For more information about development of the PIQ, see below.
Information About the Social Skills Rating System (SSRS)
The Social Skills Rating System (SSRS) (Gresham & Elliott, 1990), published by Pearson Assessments, provides a broad, multi-rater assessment of the social skills and behaviors of students. The SSRS documents the perceived frequency and importance of behaviors influencing the student’s development of social competence and adaptive functioning.
Several comparative evaluations of published rating scales have declared the SSRS to be the most comprehensive instrument because of its multi-source approach (Demaray et al., 1995; Merrell, 2001). The SSRS has been widely used in numerous studies, and the combined parent, student, and teacher forms were standardized using a diverse nationwide sample (multiracial, handicapped and non-handicapped, and male and female) of more than 4,000 cases (Merrell, 2001).1 The SSRS was selected to assess the social skills of full-time
online public school students because of “its multi-source approach…and overall strong reliability and validity” (Demaray et al., 1995).
1 “The SSRS was standardized in 1988 on a national sample of 4,170 children using children’s self-ratings and the ratings of 1,027 parents and
259 teachers. Participating facilities included public and private schools and a few non-school educational centers. Data from the standardiza-tion sample were used to construct nastandardiza-tional norms for the Elementary and Secondary levels of the Parent, Teacher, and Student forms. Norms are stratified by broad age groups corresponding to Preschool, Elementary grades (K-6), and Secondary grades (7-12). Norms are also provided by gender and by grade within gender.” Norms for the Elementary and Secondary levels were developed separately for non-handicapped and for handicapped students. However, norms by grade within gender combined both non-handicapped and handicapped students (Gresham & Elliot, 1990).
Whole-group norms to which the current study findings were compared were derived from ratings by 522 parents of elementary level (grades K-6) non-handicapped students enrolled in traditional public schools; 769 teacher ratings of students from a national sample of elementary level (grades K-6) handicapped, traditional school students; and self-ratings of 406 upper elementary level (grades 3-6) non-handicapped, traditional school students (Gresham & Elliot, 1990).
The SSRS is distinguished from other social skills assessments in that it emphasizes positive behaviors in addition to including a brief assessment of potential problem behaviors and academic competence, whereas most other assessments reviewed for this project focus on potential problem behaviors and academic competence only. The SSRS’s standardized, norm-referenced scales include three behavior rating forms (Parent, Teacher, and Student) appropriate for children from grades 3 through 12, and two behavior rating forms (Parent and Teacher) appropriate for children from preschool through grade 2.
In this evaluation project, the SSRS Parent form was administered to compare social skills and problem behaviors among children in the present sample to nationally normed data for children of comparable ages (grade level and gender). In addition, the SSRS Student form was administered to participating students in grades 4 and 6 to compare self-assessment of social skills and problem behaviors among children in the present sample to nationally-normed data for children of comparable ages. (As noted above, an SSRS Student form is not available for students in grade 2.) The SSRS Teacher form was used in the proposed study for a sample of students who have had at least two years’ instruction from the same teacher—to ensure that the teachers were qualified to make judgments about the students’ social skills and behaviors. (Teachers in the participating full-time, online public schools typically teach a cluster of consecutive grades, so it was easy to identify students who have had at least two years’ instruction from the same teacher.)
Social Skills
The SSRS Parent, Teacher and Student rating scales all focus on the area of social skills. All raters assess common core behaviors from the three sub-domains of (1) cooperation, (2) assertion, (3) self-control. In addition, the Parent version measures responsibility, and the Student version measures empathy.
1 The Cooperation subscale focuses on behaviors such as helping others, sharing materials, and complying with rules and directions.
2 The Assertion subscale includes initiating behaviors, such as asking others for information and introducing oneself and responding to the actions of others.
3 The Responsibility subscale includes behaviors that are indicative of being able to communicate with adults and having regard for propriety of work.
4 The Empathy subscale incorporates behaviors that show concern and respect for others’ feelings and viewpoints.
5 The Self-Control subscale includes behaviors that emerge in conflict situations, such as responding appropriately to teasing, and in non-conflict situations that require taking turns and compromising. The SSRS uses two types of ratings based on frequency and importance. Frequency ratings made by all raters reflect how often a social behavior occurs (Never, Sometimes or Very Often). Importance ratings are completed by parents and teachers only. Parents and teachers rate each behavior on “How Important” it is for the child’s development (parents) and the classroom or group setting (teachers). The Importance ratings provide a means of establishing the social value of the behaviors being assessed, which has important implications for the validity of the assessment results.
Problem Behaviors
The Problem Behaviors component identifies sub-domains including Externalizing problems, Internalizing problems, and Hyperactivity. Problem behaviors are included on the Parent and Teacher form only and are recorded in terms of frequency (Never, Sometimes, Very Often).
1 Externalizing problems are inappropriate behaviors involving verbal and physical aggression toward others, poor control of temper, and arguing.
3 Hyperactivity behaviors are those involving excessive movement, fidgeting, and impulsive reactions. Hyperac-tivity is measured only at the elementary level.
Development of the Parent Information Questionnaire (PIQ)
This survey instrument was developed by the researchers using the following process:
1 Literature review. IESD conducted a review of relevant sources related to social skills among elementary school children, then used the information gathered as a basis for developing an initial version of the Parent Information Questionnaire (PIQ). IESD also consulted information from the K12 website on possible reasons
why parents enroll their students in online schools.
2 Input from schools. IESD collected information from the four online public schools participating in this study related to:
• Typical reasons parents have for choosing a full-time, online public school for their children • Types of children’s activities outside of school that students typically engage in
• Student outcomes that have been established as goals for the school and outcomes parents have as goals for their children related to enrollment in the online school
This information was correlated to categories developed by IESD, and used to add new categories and refine the category definitions.
3 Reviews from CREP. Survey drafts were reviewed at multiple points by researchers from the Center for Research in Education Policy (CREP) at the University of Memphis. Comments from these reviewers helped to guide IESD’s revision process.
• Review by CREP researchers was informed by a review of relevant research literature related to online public schooling completed by CREP and by their vast experience in developing parent questionnaires for educational research.
For the text of the Parent Information Questionnaire, see the Appendix.
Assessment Administration
Assessment administration and scoring was the responsibility of IESD researchers and CREP research and evaluation staff. All children and parent information remained confidential. Each student record was assigned an Identification Code, so that each child could be identified solely through the child’s code during data analysis. The administration of each school obtained consents (expressed in writing or by email) from participating parents of students included in the study.
Data collectors in this study were staff from The Center for Research in Educational Policy (CREP) at the University of Memphis (TN), which worked under subcontract to IESD. These were graduate-level researchers experienced in gathering data and preparing it for analysis.
Parent and Student Assessments
Packets were sent to the families of all eligible students. These packets included: • Instructions for completing the assessments and submitting them to CREP • Scan sheet for the Social Skills Rating System (SSRS) Parent Rating Form • Scan sheet for the Parent Information Questionnaire (PIQ)
• Scan sheet for the SSRS Student Self-Rating Form, for students in grades 4 and 6 • A stamped return envelope
Teacher Assessments
Packets were sent to the teachers of a selected number of eligible students, who had taught the same students for at least two years. These packets included:
• Instructions for completing the assessments and submitting them to CREP • Scan sheets for the SSRS Teacher Rating Form (one scan sheet per student) • A stamped return envelope
Data were collected for only a selected number of students, typically one or two students per teacher, in order to reduce the burden on participating teachers.
Assessment Processing
Completed packets from families and teachers were mailed to CREP, which was responsible for processing the data. Scan sheets were processed by machine, and the open-ended responses from the Parent Information Form were entered into a survey management system and compiled into a listing by individual parent response. For the SSRS forms, raw and standardized Total Scale scores and subscale scores were produced for both the Social Skills scale and the Problem Behavior scale, using computer software for the Social Skills scale items and Problem Behavior scale items.
Data Analysis Procedures
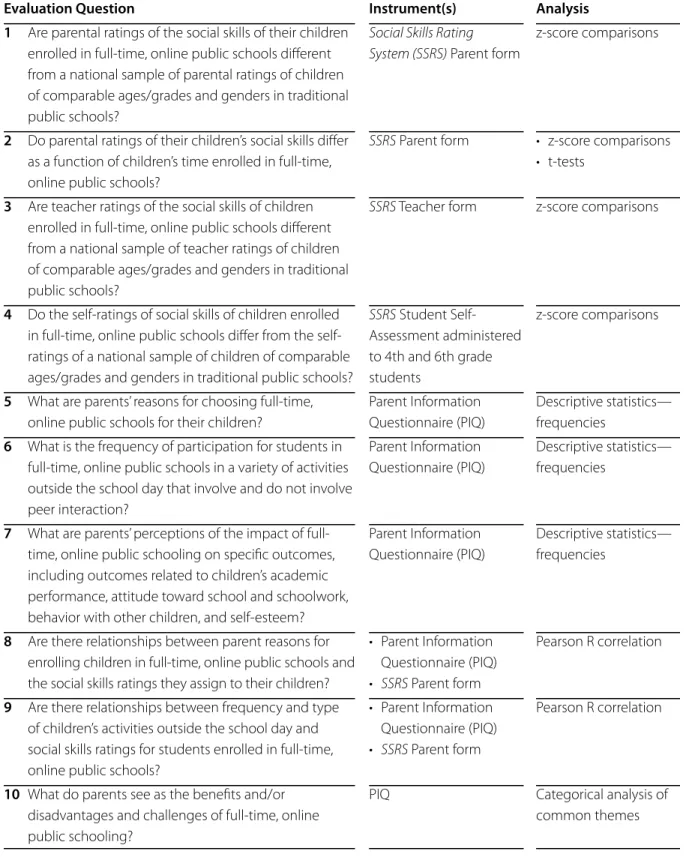
Table 2 provides an overview of the assessment instruments and the data analysis that were completed in order to answer each evaluation question.
Table 2.
Assessment Measures and Data Analyses
Evaluation Question1 Are parental ratings of the social skills of their children enrolled in full-time, online public schools different from a national sample of parental ratings of children of comparable ages/grades and genders in traditional public schools?
2 Do parental ratings of their children’s social skills differ as a function of children’s time enrolled in full-time, online public schools?
3 Are teacher ratings of the social skills of children enrolled in full-time, online public schools different from a national sample of teacher ratings of children of comparable ages/grades and genders in traditional public schools?
4 Do the self-ratings of social skills of children enrolled in full-time, online public schools differ from the self-ratings of a national sample of children of comparable ages/grades and genders in traditional public schools?
5 What are parents’ reasons for choosing full-time, online public schools for their children?
6 What is the frequency of participation for students in full-time, online public schools in a variety of activities outside the school day that involve and do not involve peer interaction?
7 What are parents’ perceptions of the impact of full-time, online public schooling on specific outcomes, including outcomes related to children’s academic performance, attitude toward school and schoolwork, behavior with other children, and self-esteem?
8 Are there relationships between parent reasons for enrolling children in full-time, online public schools and the social skills ratings they assign to their children?
9 Are there relationships between frequency and type of children’s activities outside the school day and social skills ratings for students enrolled in full-time, online public schools?
10 What do parents see as the benefits and/or disadvantages and challenges of full-time, online public schooling?
Instrument(s) Social Skills Rating System (SSRS) Parent form
SSRS Parent form SSRS Teacher form SSRS Student Self- Assessment administered to 4th and 6th grade students Parent Information Questionnaire (PIQ) Parent Information Questionnaire (PIQ) Parent Information Questionnaire (PIQ) • Parent Information Questionnaire (PIQ) • SSRS Parent form • Parent Information Questionnaire (PIQ) • SSRS Parent form PIQ Analysis z-score comparisons • z-score comparisons • t-tests z-score comparisons z-score comparisons Descriptive statistics— frequencies Descriptive statistics— frequencies Descriptive statistics— frequencies Pearson R correlation Pearson R correlation Categorical analysis of common themes
Data analysis was completed by CREP, working under subcontract to IESD, with results reviewed by IESD. A top-level overview of the analyses follows.
z-Score Comparison
The z-score comparison is a statistical analysis that is used to find out if there is a real difference between the means (averages) of a target sample group under investigation and a norming sample group. Comparisons are made to two critical values in order to determine statistical significance. If the z-score is less than critical value 1, then the target sample mean is significantly lower than the norm mean. If the z-score is greater than critical value 2, then the target sample mean is significantly higher than the norm mean. If neither is true, then there is no significant difference between the means. For example, this test was used to assess the significance of differences between students enrolled in full-time, online schools and the normative population on the SSRS Parent, Teacher, and Student Self-Assessment ratings.
t-Test
The t-test is a statistical test that is used to find out if there is a real difference between the means (averages) of two different groups. For example, this test was used to assess the significance of differences between the parent ratings of students enrolled in online public schools for one year or less to parent ratings of students enrolled more than one year on the SSRS Parent form.
Descriptive Statistics—Frequencies
Frequencies for students enrolled in full-time, online public schools were tallied for each of the items within the multiple choice questions on the Parent Information Questionnaire (PIQ). Specifically, frequencies were used to analyze the data from the PIQ items that asked parents to select from among reasons for enrolling their children in an online public school, to select from among their children’s activities outside the school day, and to rate various student outcomes as a result of full-time, online public schooling.
Pearson R
The Pearson R correlation coefficient assesses the linear association between two variables. It measures the strength of the relationship between two variables. Expressed on a scale from -1.0 to +1.0, the strongest correlations are at both extremes. For example, in this study, Pearson R correlations were run to analyze the relationships between frequency and type of children’s activities outside the school day and social skills ratings for students enrolled in full-time, online public schools.
Categorical Analysis of Common Themes
Categorical analysis of common themes is a means of classifying open-ended responses in terms of disparate categories. For example, parents might see that a benefit of full-time, online schooling is that children can work at a faster pace if they are gifted or can select a slower pace if they have a learning disability. Such different responses would have been counted in the larger category, “faster learning, students learning at their own pace, flexible schedule.”
Results
The results of the study are presented in order by research question. Data collection and analyses were conducted by the Center for Research in Educational Policy at The University of Memphis, under subcontract to IESD, and under IESD’s direction. Data were provided from two sources: the Social Skills Rating System (SSRS) and the Parent Information Questionnaire (PIQ).
Analysis for Research Question 1
Are parental ratings of the social skills of their children enrolled in full-time, online public schools different from a national sample of parental ratings of children of comparable ages/grades and genders in traditional public schools?
This question was first addressed by analyzing results for the total subject sample of students enrolled in full-time, online public schools in grades 2, 4, and 6, and then by analyzing results separately for each grade/ gender category (e.g., 2nd grade females).
Both for the total student sample and for each grade/gender category (2nd, 4th, and 6th grade females, and 2nd, 4th, and 6th grade males), raw score means were converted to z-scores for the Social Skills and Problem Behaviors subscales and Total Scale scores from the SSRS Parent form.2 Z-scores from the rating scale of parents
who enrolled their children in online public schools were compared to a national sample of ratings from parents of elementary level non-handicapped students enrolled in traditional public schools.3 Z-scores from parents of
online students for each specific grade/gender category (e.g., 2nd grade females) were compared to a national sample of ratings from parents of elementary level handicapped and non-handicapped students enrolled in traditional public schools by grade and gender, because non-handicapped-only norms were unavailable at this level of specificity.
Results for the Total Student Sample
Z-scores from the rating scale of parents who enrolled their 2nd, 4th, and 6th grade children in online public schools were compared to a national sample of ratings from 522 parents of elementary level non-handicapped students enrolled in traditional public schools.
Compared to the national sample, parents of full-time, online public school children:
• Rated their children significantly higher (more skilled) on each Social Skills subscale (Cooperation, Assertion, Responsibility, and Self-Control) and on the Total Social Skills Scale
• Rated their children significantly lower (fewer problems) on each Problem Behavior subscale (Externalizing, Internalizing, and Hyperactivity) and on the Total Problem Behaviors Scale
2 Throughout this study, in all cases where z-scores are calculated, comparisons are made to two critical values in order to determine
statistical significance (e.g., Table 3). If the z-score is less than critical value 1, then the online sample mean is significantly lower than the norm mean. If the z-score is greater than critical value 2, then the online sample mean is significantly higher than the norm mean. If neither is true, then there is no significant difference between the means.
3 The sample of full time, online public school students excluded students who were identified by the participating schools as emotionally
handicapped, behaviorally handicapped, severely mentally handicapped, and/or autistic. Students who were identified as mildly mentally handicapped were eligible for inclusion in the study.
Table 3.
Parent Ratings of Online Public School Students versus National Sample of Parents of
Non-handicapped Students
Significant = (p<.05)
Detailed breakdowns by grade level and gender are provided below.
Results by Grade Level for Female Students
Compared to national samples of ratings from parents of female students enrolled in traditional schools, parents of full-time, online public school children:
• Rated their female children in grades 2 and 4 significantly higher on each Social Skills subscale and on the Total Social Skills Scale
• Rated their female children in grade 6 significantly higher on each Social Skills subscale with the exception of Cooperation, which was not significantly different. They also rated these children significantly higher on the Total Social Skills Scale.
• Rated their female children in grades 2, 4, and 6 significantly lower on each Problem Behaviors subscale and on the Total Problem Behaviors Scale
Table 4.
Parent Ratings of 2nd Grade Females in Online Public Schools versus a National Sample of
Parents of 2nd Grade Females
Table 5.
Parent Ratings of 4th Grade Females in Online Public Schools versus a National Sample of
Parents of 4th Grade Females
Significant = (p<.05)
Table 6.
Parent Ratings of 6th Grade Females in Online Public Schools versus a National Sample of
Parents of 6th Grade Females
Significant = (p<.05)
Results by Grade Level for Male Students
Compared to national samples of ratings from parents of male students enrolled in traditional schools, parents of full-time, online public school children:
• Rated their male children in grades 2 and 4 significantly higher on each Social Skills subscale and on the Total Social Skills Scale
• Rated their male children in grade 6 significantly higher on each Social Skills subscale with the exception of Assertion, which was significantly lower for online students
• Rated their male children in grade 2 significantly lower on each Problem Behaviors subscale and on the Total Problem Behaviors Scale
• Rated their male children in grade 4 significantly lower on each Problem Behaviors subscale with the exception of Hyperactivity, which was not significantly different
• Rated the Total Problem Behaviors Scale significantly lower for grade 4 males
• Did not rate their male children in grade 6 significantly differently on any Problem Behaviors subscales or on the Total Problem Behaviors Scale
Table 7.
Parent Ratings of 2nd Grade Males in Online Public Schools versus a National Sample
of Parents of 2nd Grade Males
Significant = (p<.05)
Table 8.
Parent Ratings of 4th Grade Males in Online Public Schools versus a National Sample of
Parents of 4th Grade Males
Significant = (p<.05)
Table 9.
Parent Ratings of 6th Grade Males in Online Public Schools versus a National Sample of Parents
of 6th Grade Males
Significant = (p<.05)
Analysis for Research Question 2
Do parental ratings of their children’s social skills differ as a function of children’s time enrolled in full-time, online public schools?
Based on information from the schools, students in the study were classified as having been enrolled for one year or less in the full-time online public school, or for more than one year, as shown in Table 10.
Table 10.
Student Enrollment by Year in Online Public Schools
Students Enrolled One Year or Less 100 Students Enrolled More Than One Year 176 Information not Provided 3
Total 279
Raw score means were converted to z-scores for the Social Skills and Problem Behaviors subscales and the Total Scale scores from the SSRS Parent form. Z-scores from the rating scale of parents who enrolled their children in online public schools for one year or less and for more than one year were compared to a national sample of ratings from 522 parents of non-handicapped elementary students who were enrolled in traditional public schools.
Compared to the national sample, parents of full-time, online public school children:
• Rated their children significantly higher on all Social Skills subscales and on the Total Social Skills Scale, regardless of time enrolled in the program
• Rated their children significantly lower on each Problem Behaviors subscale and on the Total Problem Behaviors Scale, regardless of time enrolled in the program
Table 11.
Parent Ratings of Students Enrolled for 1 Year or less of Online Classes versus a National
Sample of Parents of Non-handicapped Students
Significant = (p<.05)
Table 12.
Parent Ratings of Students Enrolled for More than 1 Year of Online Classes versus a National
Sample of Parents of Non-handicapped Students
T-tests were performed to compare the parent ratings of students enrolled in online public schools for one year or less to parent ratings of students enrolled more than one year on the Social Skills and Problem Behaviors subscales and the Total Scale scores from the SSRS Parent form. Results from the comparison were as follows: • Students who had been enrolled for more than one year were rated significantly higher on the Social Skills
subscale Self Control than students enrolled for one year or less.
• There were no significant differences based on time enrolled for any of the other Social Skills subscales or on the Total Social Skills Scale.
• There were no significant differences based on time enrolled on any of the Problem Behaviors subscales or on the Total Problem Behaviors Scale.
Table 13.
Parent Ratings of Students Enrolled for 1 Year or Less in Online Classes versus Parent Ratings of
Students Enrolled for More than 1 Year in Online
Significant = (p<.05)
Analysis for Research Question 3
Are teacher ratings of the social skills of children enrolled in full-time, online public schools different from a national sample of teacher ratings of children of comparable ages/grades and genders in traditional public schools?
In conducting the analysis for this question, raw score means were converted to z-scores for the Social Skills and Problem Behaviors subscales and Total Scale scores from the SSRS Teacher form. Z-scores from the rating scale of teachers who had students enrolled in online public schools were compared to a national sample of ratings from 769 teachers of non-handicapped elementary students enrolled in traditional public schools.
Compared to the national sample, teachers of full-time, online public school students:
• Rated their students significantly higher on the Social Skills subscale Self-Control. No significant differences were found among other Social Skills subscales or on the Total Social Skills Scale score.
• Rated their students significantly lower on each Problem Behaviors subscale and on the Total Problem Behaviors Scale
Table 14.
Teacher Ratings of Online Public School Students versus a National Sample of Teachers of
Non-handicapped Students
Significant = (p<.05)
Detailed breakdowns by grade level and gender are not included, due to the small number of teacher ratings of full-time, online public school students for each grade level/gender category.
Analysis for Research Question 4
Do the self-ratings of social skills of children enrolled in full-time, online public schools differ from the self-ratings of a national sample of children of comparable ages/grades and genders in traditional public schools?
This question was first addressed by analyzing results for the total subject sample of students enrolled in full-time, online public schools in grades 4 and 6, and then by analyzing results separately for each grade/gender category (e.g., 4th grade females).
Both for the total student sample and for each grade/gender category (4th and 6th grade females, and 4th and 6th grade males), raw score means were converted to z-scores for the Social Skills subscales and Total Scale score from the SSRS Student Self-Rating Form. Z-scores from the self-rating scale of students in online public schools for the total student sample were compared to a national sample of self-ratings from elementary level non-handicapped students enrolled in traditional public schools. Z-scores from the self-ratings of online students for each specific grade/gender category (e.g., 4th grade females) were compared to a national sample of self-ratings from elementary level handicapped and non-handicapped students enrolled in traditional public schools by grade and gender, because non-handicapped-only norms were unavailable at this level of specificity.
Results for the Total Student Sample
Z-scores from the self-rating scale of 4th and 6th grade students enrolled in online public schools were compared to a national sample of ratings from 406 upper elementary level (grades 3-6) non-handicapped students enrolled in traditional public schools.
Compared to the national sample, students enrolled in full-time, online public schools:
• Rated themselves significantly higher on the Social Skills subscales Cooperation, Assertion, and Empathy, as well as on the Total Social Skills Scale
Table 15.
Student Self-Ratings of Online Public School Students versus a National Sample
Significant = (p<.05)
Results by Grade Level for Female Students
Compared to student ratings from national samples of 4th grade and 6th grade female students enrolled in traditional public schools, 4th grade and 6th grade female students enrolled in full-time, online public schools: • Rated themselves significantly higher on the Social Skills subscales Cooperation, Assertion, and Empathy, as
well as on the Total Social Skills Scale (grades 4 and 6)
• Rated themselves significantly lower on the Social Skills subscale Self-Control (grades 4 and 6)
Table 16.
Student Self-Ratings of 4th Grade Females in Online Public Schools versus a National Sample
of Self-Ratings of 4th Grade Females
Significant = (p<.05)
Table 17.
Student Self-Ratings of 6th Grade Females in Online Public Schools versus a National
Sample of Self-Ratings of 6th Grade Females
Significant = (p<.05)
Results by Grade Level for Male Students
Compared to student ratings from national samples of 4th grade and 6th grade male students enrolled in traditional public schools, 4th grade and 6th grade male students enrolled in full-time, online public schools: • Rated themselves significantly higher on the Social Skills subscales Cooperation and Empathy, as well as on the
Total Social Skills Scale (grades 4 and 6)
• Rated themselves significantly higher on the Social Skills subscale Assertion (grade 4 only) • Rated themselves significantly lower on the Social Skills subscale Self-Control (grades 4 and 6)
Table 18.
Student Self-Ratings of 4th Grade Males in Online Public Schools versus a National Sample of
Self-Ratings of 4th Grade Males
Significant = (p<.05)
Table 19.
Student Self-Ratings of 6th Grade Males in Online Public Schools versus a National Sample of
Self-Ratings of 6th Grade Males
Significant = (p<.05)
Analysis for Research Question 5
What are parents’ reasons for choosing full-time, online public schools for their children?
Findings related to this research question were calculated based on Question 3 from the Parent Information Questionnaire (PIQ). This question on the PIQ presented a list of 22 reasons why parents might have chosen an online public school for their child. Parents were directed to mark all of the reasons that applied. The responses were separated into Parent Concerns, Child Concerns, and School Concerns, as shown below in Table 20. In response to this question, the most frequently noted reasons (each identified by more than 60% of the parents) were all parent concerns:
• A home-based environment, but with the active support and structure of the public school system (e.g., books and materials, certified teachers)
• A learning environment consistent with our family values • More involvement in our child’s education
Of the child concerns, IESD notes that the top three reasons (each identified by 38%-43% of the parents) all related to differentiating instruction to meet specific student needs:
• Needs a more challenging/higher quality curriculum • Does better with a more self-directed approach to learning • Needs an individualized approach
Table 20.
Why did you choose an online public school for your child? (Mark all that apply.)
Percent who markedas a reason We wanted (Parent Concerns)
64.5 More involvement in our child’s educaton.
78.5 A home-based environment, but with the active support and structure of the public school system.
70.3 A learning environment consistent with our family values.
Our child (Child Concerns)
42.7 Does better with a more self-directed approach to learning. 37.6 Needs an individualized approach.
24.7 Is gifted/too advanced for the regular school program. 43.4 Needs a more challenging/higher quality curriculum.
5.4 Was receiving special education services at his/her previous school. 5.0 Has been diagnosed as learning disabled.
9.7 Has problems related to ADD or ADHD that make regular school difficult. 1.1 Has a physical disability.
3.2 Has a health condition that prevents attending school. 19.4 Was bored in his/her regular school.
12.2 Was bullied in his/her regular school.
5.7 Had difficulty making friends and felt left out in his/her regular school. 4.3 Was getting into trouble due to bad behavior in his/her regular school. 8.2 Travels or is unavailable during school hours due to outside activities. 2.5 Was switching schools frequently because our family moves a lot.
The regular school (School Concerns) ,
16.1 Wasn’t safe for our child, or travel to school wasn’t safe. 22.9 Was overcrowded.
22.9 Had a bad reputation academically.
9.0 Didn’t offer enough experience with multimedia and technology.
42.3 Other
Analysis for Research Question 6
What is the frequency of participation for students in full-time, online public schools in a variety of activities outside the school day that involve and do not involve peer interaction?
Findings related to this research question were calculated based on Question 4 from the PIQ, as shown below in Table 21. Note that in this table, the 18 listed activities are divided into the two top-level categories: activities involving peer interaction and activities not involving peer interaction, based on the following criteria:
Activities involving peer interaction:
• Statement contains the words “with other children” • Statement contains the words “involve other children”
• Statement contains wording that suggested children were the primary focus of the activity (e.g., “Children’s clubs and organizations”)
• Statement contains the words “classes” or “school,” where the supposition is that children are the primary par-ticipants
Activities not involving peer interaction:
• Statement contains the words “don’t involve other children”
• Statement has no specific mention of children and the activity traditionally involves adult leadership and/or adults
Specific activities involving peer interaction that were engaged in at least once a week by at least 50% of the students included the following:
• Children’s clubs and organizations (e.g., Boy/Girl Scouts, 4H, church groups) • Sports that involve other children (e.g., team sports, competitions)
• Classes or lessons with other children (e.g., dance, art, martial arts, group tutoring) • Playing with other children at someone’s home
• Religious/cultural classes or schools
Specific activities not involving peer interaction that were engaged in at least once a week by at least 50% of the students included the following:
• Recreational activities at home that don’t involve other children (e.g., reading, single-player video games, watching television)
• Individual exercise or athletic activities that don’t involve other children • Religious services
Table 21.
How often does your child participate in each of the following?
Percent Who Marked
More than About once 2-3 times Once a Never once a week once a week a month month or
less
Activities Involving Peer Interaction
Sports that involve other children. 38.0 21.7 8.3 14.5 17.4 Group performance activities. 5.1 16.8 8.4 35.9 33.7 Classes or lessons with other children. 24.2 30.0 8.8 16.1 20.9 Educational events with other children. 2.2 11.3 26.3 56.9 3.3 Children’s clubs and organizations. 20.7 39.3 12.0 10.2 17.8 Religious/cultural classes or schools. 16.0 34.9 6.5 9.5 33.1 Playing with other children at someone’s home. 31.2 22.5 25.0 19.2 2.2 School-organized social events. 0.0 5.8 8.7 73.6 11.9 Other group social events and “fun” activities. 4.3 10.5 41.7 42.4 1.1 Telephone conversations with other children. 19.1 14.4 22.7 29.2 14.4 Internet chatting, or exchanging electronic
messages with other children. 18.8 5.4 9.7 14.1 52.0
Activities Not Involving Peer Interaction
Individual exercise or athletic activities that don’t
involve other children. 57.3 22.6 6.6 5.5 8.0
Classes or lessons that don’t involve other children. 12.5 29.8 7.7 15.8 34.2 Educational events that don’t involve other children. 8.6 11.9 21.9 40.5 17.1
Religious services. 28.4 47.5 4.7 10.1 9.4
Recreational activities at home that don’t involve
other children. 86.7 8.3 4.0 1.1 0.0
Volunteer work with other people. 4.0 11.6 17.1 45.8 21.5 Part-time job or paid work outside the home. 2.5 6.5 5.4 13.4 72.2