© 2014, IJARCSMS All Rights Reserved
412 | P a g e
ISSN: 2321-7782 (Online) Volume 2, Issue 1, January 2014International Journal of Advance Research in
Computer Science and Management Studies
Research Paper
Available online at:
www.ijarcsms.com
Efficient Prediction of Close Value using Genetic
algorithm based horizontal partition decision tree in
Stock Market
Dharamveer Sisodia
1Department of Computer Science & Engineering SR Group of Institution, CSE campus
Jhansi, India
Beerendra Kumar
2Department of Computer Science & Engineering SR Group of Institution, CSE campus
Jhansi, India
Jitendra Kumar Gupta
3Department of Computer Science & Engineering SR Group of Institution, CSE campus
Jhansi, India
Abstract: The goal of fundamental analysis is to decide the value of a stock based on the previously mentioned factors and to act on the assumption that the actual stock price will eventually reflect the determined value. Stock price forecasting is an important task for investment/financial decision making challenge. It receives considerable attention from both researches and practitioners. Stock market analysis is important for the prediction of different value of the market. The existing work for the analysis of stock market prediction doesn’t provide efficient results and has more error rate [1]. Hence here in this paper we combine two techniques of classification and genetic algorithm to increase the efficiency of the stock prediction. The classification of stock market is used to provide classification among different values of the stock market and then genetic algorithm is used to provide a close among these values.
Keywords: component; formatting; style; styling; insert (Minimum 5 to 8 key words must be phrases) I.INTRODUCTION
The prediction of stock market movement has been an issue of interest for centuries. Despite years of study and the latest technology, it seems that no method has been discovered that consistently works. Fundamental analysis usually works best over longer periods of time, whereas technical analysis is more suitable for short term trading. Neural networks offer the ability to process large amounts of data quickly and retain information learned from that data to be used again in the future. Technical analysis provides a slightly more concrete method of evaluation at the cost of locating and implementing the algorithms yourself.
Forecasting stock price or financial markets has been one of the biggest challenges to the AI community. Various technical, fundamental, and statistical indicators have been proposed and used with varying results. However, none of these techniques or combination of techniques has been successful enough. The objective of forecasting research has been largely beyond the capability of traditional AI research which has mainly focused on developing intelligent systems that are supposed to emulate human intelligence [1].
The difficulty with technical analysis is that a complete pattern is required to make an accurate prediction on the stock movement. Ideally, such a prediction should be made before the pattern was completed to enable prediction. For this task implement a Time-Delay Artificial Neural Network, called Midas. Like Metis, Midas takes input data including open, close, high and low prices per day for a particular stock ticker over a period of time, along with the corresponding trading volume for
Volume 2, Issue 1, January 2014 pg. 412-418 each day. This data is sufficient for implementing technical analysis through Metis and is therefore used as the input data for Midas as well.
Once data is pre-processed by Metis, locating all relevant technical indicators, it is passed to Midas as training data. This data is useful for training because we use the technical indicators to highlight areas in the data where Midas should be able to make a prediction. The goal of this process is to train Midas such that it can make these predictions before the technical indicator patterns are completed. The predictions made by Midas represent a predicted direction of movement at a given time interval. As such, it is very easy to check Midas' accuracy by simply running it on older data so we can see whether its predictions were correct.
Stock market prediction is the act of trying to determine the future value of a company stock or other financial instrument traded on a financial exchange. The successful prediction of a stock's future price could yield significant profit. Some believe that stock price movements are governed by the random walk hypothesis and thus are unpredictable. Others disagree and those with this viewpoint possess a myriad of methods and technologies which purportedly allow them to gain future price information.
Genetic Algorithm
GAs is commonly used as optimizers that adjust parameters to minimize or maximize some feedback measure, which can then be used independently or in the construction of an ANN. In the financial markets, genetic algorithms are most commonly used to find the best combination values of parameters in a trading rule, and they can be built into ANN models designed to pick stocks and identify trades.
Decision Tree
A decision tree is a decision support tool that uses a tree-like graph or model of decisions and their possible consequences, including chance event outcomes, resource costs, and utility. It is one way to display an algorithm. Decision trees are commonly used in operations research, specifically in decision analysis, to help identify a strategy most likely to reach a goal. If in practice decisions have to be taken online with no recall under incomplete knowledge, a decision tree should be paralleled by a probability model as a best choice model or online selection model algorithm. Another use of decision trees is as a descriptive means for calculating conditional probabilities.
II.BACKGROUND
From the beginning of time it has been man’s common goal to make his life easier. The prevailing notion in society is that wealth brings comfort and luxury, so it is not surprising that there has been so much work done on ways to predict the markets [1]. In the recent decade so many researchers have been done on neural networks to predict the stock market changes. One of the first efforts was by Kimmoto and his colleagues in which they used neural networks to predict the index of Tokyo stock market [2]. Mizuno and his colleagues also used neural networks to predict the trade of stocks in Tokyo stock market.
III.RELATED WORK
Past approaches to this problem first applied an artificial neural network directly to historical stock data using linear time series modeling [3]. This produced results which over fitted the training data and therefore rendered them unusable in real trading. In addition to omitting any preprocessing, the neural networks used only contained two layers, an input and an output layer. These linear techniques are now known to be provably insufficient for any nonlinear phenomenon including stock price movement.
One such attempt is by Chenowith [4] they relied on a single technical indicator called the average direction index (ADX), which identifies and quantifies trends by averaging the fraction of today’s range above or below the previous day’s range. The ADX is obtained through a feature selection component and used as input into two separate neural networks (Up and Down)
Volume 2, Issue 1, January 2014 pg. 412-418 whose results were then polled and applied to a rule base to predict the final market movement. Without knowing the exact predictive accuracy, it is difficult to quantitatively compare the system, which inevitably includes rules for trading which may be the actual cause of the monetary gain achieved by the system rather than predictive accuracy.
Variants on the MLP theme are common, such as using a variety of different markets for training data [5] and using statistical analysis to assist in training [6].
Other approaches include using fuzzy neural networks, which is based on fuzzification, a technique that allows members of a set to have degrees of membership instead of binary membership as in classical set theory. The introduction of ambiguity allows data to be divided into several different technical indicators if necessary, hopefully producing more lenient and more accurate neural networks. However, results indicate that fuzzy neural networks have prediction accuracy virtually equivalent to classical neural networks [7].
Mahfoud and Mani [8] chose to use genetic algorithms to predict stock prices. Genetic algorithms are inspired by evolutionary biology and the concept of survival of the fittest. A large population of possible algorithmic representations for stock prediction is first created. Then, each member is executed and evaluated, keeping the algorithms which generate the bes t results and mixing their properties amongst other high scoring algorithms to obtain a new generation of algorithms in a Darwinian fashion. The process is repeated until the error has been reduced to an acceptable level.
IV.PROPOSED SCHEME
The proposed Efficient Prediction of Close Value using Genetic algorithm based horizontal partition decision tree The proposed methods is implemented using genetic Algorithm which includes the concept of decision tree. The scheme provides Stock market price index prediction is regarded as a challenging task of the finance. Genetic algorithms (GAs) are problem solving methods (or heuristics) that mimic the process of natural evolution. Unlike artificial neural networks (ANNs), designed to function like neurons in the brain, these algorithms utilize the concepts of natural selection to determine the best solution for problem.
Algorithm 1 : Genetic Algorithm for all members of population sum += fitness of this individual end for
for all members of population
probability = sum of probabilities + (fitness / sum) sum of probabilities += probability
end for
loop until new population is full do this twice
number = Random between 0 and 1 for all members of population
if number > probability but less than next probability then you have been selected
end for end
create offspring end loop
Algorithm 2: Horizontal Partitioned Based Decision Tree Define P1, P2… Pn Parties.(Horizontally partitioned).
Each Party contains R set of attributes A1, A2, …., AR.
C the class attributes contains c class values C1, C2… Cc.
For party Pi where i = 1 to n do
If R is Empty Then
Return a leaf node with class value
Else If all transaction in T(Pi) have the same class Then
Return a leaf node with the class value Else
Volume 2, Issue 1, January 2014 pg. 412-418 Calculate Expected Information classify the given sample for each party Pi individually.
Calculate Entropy for each attribute (A1, A2, …., AR) of each party Pi.
Calculate Information Gain for each attribute (A1, A2,…., AR) of each party Pi
End If. End For
Calculate Total Information Gain for each attribute of all parties (TotalInformationGain( )). ABestAttribute MaxInformationGain( )
Let V1, V2, …., Vm be the value of attributes. ABestAttribute partitioned P1, P2,…., Pn parties into m parties
P1(V1), P1(V2), …., P1(Vm)
P2(V1), P2(V2), …., P2(Vm)
. . . . Pn(V1), Pn(V2), …., Pn(Vm)
Return the Tree whose Root is labelled ABestAttribute and has m edges labelled V1, V2, …., Vm. Such that for every i the edge
Vi goes to the Tree
NPPID3(R – ABestAttribute, C, (P1(Vi), P2(Vi), …., Pn(Vi)))
End.
Algorithm 3: TotalInformationGain( ) - To compute the Total Information Gain for every attribute. For j = 1 to R do {Attribute A1, A2,…., AR }
Total_Info_Gain(Aj) = 0
For i = 1 to n do {Parties P1, P2,…., Pn }
Total_Info_Gain(Aj) = Total_Info_Gain(Aj) + Info_Gain(Aij)
End For End For End.
Algorithm 4: MaxInformationGain( ) – To compute the highest Information Gain for horizontally partitioned data MaxInfoGain = -1
For j = 1 to R do {Attribute A1, A2,…., AR }
Gain = TotalInformationGain(Aj)
If MaxInfoGain < Gain then MaxInfoGain = Gain ABestAttribute = Aj End If Return (ABestAttribute ) End For End. V.RESULT ANALYSIS
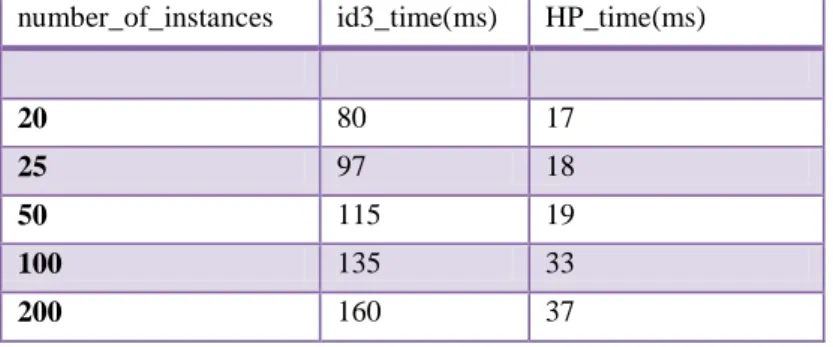
As shown in the below Table is the time complexity comparison between existing id3 based decision tree and Horizontal partition based decision tree and was found that the proposed algorithm has less complexity when experimented on different values of dataset.
number_of_instances id3_time(ms) HP_time(ms)
20 80 17 25 97 18 50 115 19 100 135 33 200 160 37
Table 1. Time Comparison between existing id3 and horizontal id3
As shown in the below Table is the mean absolute error rate of the proposed rate which is less as compared to the existing id3 decision tree.
Volume 2, Issue 1, January 2014 pg. 412-418 number_of_instances ID3_Mean absolute error HP_Mean absolute error 20 0.2860 0.1167 25 0.280 0.276 50 0.310 0.290 100 0.350 0.298 200 0.380 0.310
Table 2. Comparison of Mean Absolute Error
As shown in the below figure is the false positive rate of detection of populated IP address on the basis of the given dataset.
Figure 1. False Positive rate based on Stock dataset
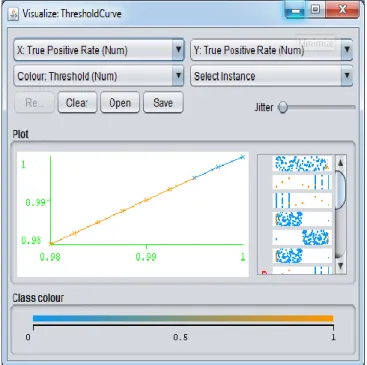
As shown in the below figure is the True positive rate of detection of populated IP address on the basis of the given dataset.
Figure 2. True positive rate based on dataset
Volume 2, Issue 1, January 2014 pg. 412-418 The genetic algorithm can be used as an application to predict the close values in the stock market data and the performance factor of this algorithm is much better than ANN.
Here proposed algorithm is based on the integration of genetic algorithm and the horizontal partition based decision tree and compare the performance factor of the proposed algorithm as compared to the existing decision tree and the proposed algorithm performs better for the stock market close value.
References
1. Mahdi Pakdaman Naeini, Hamidreza Taremian, Homa Baradaran Hashemi “Stock Market Value Prediction Using Neural Networks”, International
Conference on Computer Information Systems and Industrial Management Applications (CISIM),pp. 132-136, 2010.
2. T. Kimoto, K. Asakawa, M. Yoda, and M. Takeoka, "Stock market prediction system with modular neural network," Proceedings of the International
Joint Conference on Neural Networks, pp. 1-6, 1990.
3. Fischer Black and Myron Scholes “The Pricing of Options and Corporate Liabilities" The Journal of Political Economy, Vol. 81, No. 3, pp. 637-654,
May - Jun 1973.
4. Chenoweth, Tim., et al. “Embedding Technical Analysis into Neural Network Based Trading Systems”, Applied Artificial Intelligence, vol. 10, pp.
523-541, 1996.
5. Roman, J. and Jameel, A. “Back propagation and recurrent Neural Networks in Financial Analysis of Multiple Stock Market Returns”, Proceedings
of the 29th Annual Hawaii International Conference on System Sciences, vol. -2, pp. 454-460, 1996.
6. Wu, S. and Lu, R. P. “Combining artificial neural networks and statistics for stock market forecasting”, Proceedings of the 1993 ACM conference on
Computer, pp. 257 – 264, 1993.
7. Rast, Martin “Improving Fuzzy Neural Networks using input Parameter Training”, IEEE Fuzzy Information Processing Society - NAFIPS, pp. 55 –
58, 1998.
8. Sam Mahfoud and Ganesh Mani “Financial Forecasting using Genetic Algorithms” Applied Artificial Intelligence, vol. 10, pp. 543- 565, 1996.
AUTHOR(S)PROFILE
Dharamveer Sisodia, has received MCA (Master of Computer Application) degree from Technocrats Institute of Technology, Rajiv Gandhi Proudyogiki Vishwavidyalaya, Bhopal (MP), India in 2007. He is associate member of Computer Society of India (CSI). His subjects of Interest include Computer Graphics, DBMS, and Networking. He has present one research paper in National Conferences.
Beerendra Kumar, has received B.Tech. (Bachelor of Technology) degree in Computer Science and Information Technology from Institute of Engineering and Technology, Rohilkhand University, Bareilly (U.P), India in 2006. He has completed his M.Tech. (Master of Technology) in Computer Science from SCS, Devi Ahilya University, Indore, India in 2008.He is associate member of Computer Society of India(CSI).He has five years of teaching experience. His subjects of interest include Computer Networking, Theory of Computer Science, Data Mining, Operating Systems and Analysis & Design of Algorithms. He has published five research papers in national conferences and four research paper in international journal. His research areas are Computer Networks, Data Mining, Secure Multiparty Computations and Neural Networks.
Volume 2, Issue 1, January 2014 pg. 412-418
Jitendra Kumar Gupta, has received Bachelor of Technology (B.Tech) in Information Technology From Institute of Engineering & Technology (I.E.T.), Lucknow (State Govt. College of UP) in 2007. He has completed his Master of Technology (M.Tech) in Information Security from Maulana Azad National Institute of Technology (MANIT) Bhopal in 2009. He has Pursuing Doctor of Philosophy (Ph D) in Computer Science & Engineering. He is Associate member of Computer Society of India (CSI). He has five years of teaching experience. His subjects’ of interest include
Data Networks, cryptography, Engineering and testing structured systems and Process Engineering. He has published five research papers in International conferences. His research areas are Computer Networks, Secure Multiparty Computations and Neural Networks, Network Security.