In
December 2013
Are User Charges Underutilsed in Indian Cities?
An Analysis for Delhi
Simanti Bandyopadhyay
Debraj Bagchi
INTERNATIONAL CENTER FOR PUBLIC POLICY
International Center for Public Policy Andrew Young School of Policy Studies Georgia State University
Atlanta, Georgia 30303 United States of America Phone: (404) 651-1144 Fax: (404) 651-4449 Email: hseraphin@gsu.edu
Internet: http://aysps.gsu.edu/isp/index.html
Copyright 2006, the Andrew Young School of Policy Studies, Georgia State University. No part of the material protected by this copyright notice may be reproduced or utilized in any form or by any means without prior written permission from the copyright owner.
International Center for Public Policy
Working Paper 13-26
Are User Charges Underutilsed in Indian
Cities? An Analysis for Delhi
Simanti Bandyopadhyay
Debraj Bagchi
International Center for Public Policy
Andrew Young School of Policy Studies
The Andrew Young School of Policy Studies was established at Georgia State University with the objective of promoting excellence in the design, implementation, and evaluation of public policy. In addition to two academic departments (economics and public administration), the Andrew Young School houses seven leading research centers and policy programs, including the International Center for Public Policy.
The mission of the International Center for Public Policy is to provide academic and professional training, applied research, and technical assistance in support of sound public policy and sustainable economic growth in developing and transitional economies.
The International Center for Public Policy at the Andrew Young School of Policy Studies is recognized worldwide for its efforts in support of economic and public policy reforms through technical assistance and training around the world. This reputation has been built serving a diverse client base, including the World Bank, the U.S. Agency for International Development (USAID), the United Nations Development Programme (UNDP), finance ministries, government organizations, legislative bodies and private sector institutions.
The success of the International Center for Public Policy reflects the breadth and depth of the in-house technical expertise that the International Center for Public Policy can draw upon. The Andrew Young School's faculty are leading experts in economics and public policy and have authored books, published in major academic and technical journals, and have extensive experience in designing and implementing technical assistance and training programs. Andrew Young School faculty have been active in policy reform in over 40 countries around the world. Our technical assistance strategy is not to merely provide technical prescriptions for policy reform, but to engage in a collaborative effort with the host government and donor agency to identify and analyze the issues at hand, arrive at policy solutions and implement reforms.
The International Center for Public Policy specializes in four broad policy areas:
Fiscal policy, including tax reforms, public expenditure reviews, tax administration reform
Fiscal decentralization, including fiscal decentralization reforms, design of intergovernmental transfer systems, urban government finance
Budgeting and fiscal management, including local government budgeting, performance-based budgeting, capital budgeting, multi-year budgeting
Economic analysis and revenue forecasting, including micro-simulation, time series forecasting,
For more information about our technical assistance activities and training programs, please visit our website at http://aysps.gsu.edu/isp/index.html or contact us by email at hseraphin@gsu.edu.
The paper has benefitted from discussions with officials in the Budget and Finance Department MCD, specially Mr. Mayank Sharma, Additional Commissioner (Finance, Accounts and Planning). We thank Ms Jyoti Chauhan, Accounts Officer, Mr Sanjay Gupta, Deputy Collector of Accounts (Plan) and Ms Julia Michael, Assistant Accounts Officer, for their help and co-operation in clarifying the doubts related to the budgets. However, the usual disclaimer applies.
1
Cities? An Analysis for Delhi*
Simanti Bandyopadhyay
National Institute of Public Finance and Policy
Debraj Bagchi
Centre for Budget and Governance Accountability
Abstract The Commissioner of Municipal Corporation of Delhi (MCD) had recommended certain measures in December 2011 to improve the revenues of the corporation and thereby narrow the existing budget gap. These included introduction of congestion and conservancy charges and revision of rates for parking fees, one time parking charges, fees from mobile towers and property taxes, thus mainly focusing on the augmentation of the non-tax revenues. However, due to social resistance and lack of political will, none of these recommendations were implemented. In this paper we have attempted to quantify the potential revenue gains that may have resulted had the recommendations been accepted. Through a simple simulation based analysis, we find that with the implementation of the recommendations, increases in the own revenues could be between 10 per cent to 21 per cent while that in total revenue could be between 7 per cent to 15 per cent. We also find that with the reccommendations being implemented, own revenues would be able to cover about 77 per cent to 85 per cent of the revenue expenditure and total revenues would be able to account for about 74 per cent to 80 per cent of the total expenditure. Further, the share of non tax revenues in the total revenues would also rise which suggests that the corporation would be in a better position to exploit its potential for non tax revenues and move towards greater self reliance with lesser dependence on tax revenues. Finally, we find that the major share of gains would come from ‘one time parking charges’ followed by property taxes and other components.
Keywords: Urban Finance, User Charges, Property Tax, Revenue Potential, Expenditure Requirements, Service Delivery.
2 International Center for Public Policy Working Paper Series
1. Introduction
The Municipal Corporation of Delhi (MCD) contributes about 94.2 per cent of income of the state of Delhi and about 0.4 per cent of income of India. MCD spans across 8 out of 9 districts of Delhi and is divided into 12 zones. It covers 94 per cent of the total area of the urban agglomeration of Delhi while 97 per cent of Delhi’s population lives within the jurisdiction of MCD.
According to a study by Indian Institute of Human Settlements1, Delhi records the highest number of migrants in the recent past. The main reason behind the increase in the number of migrants has been the increase in job opportunities in the service sector, especially in the informal economy.
While eighteen functions mandated by the 74th Constitutional Amendment Act have been transferred to MCD, functional autonomy is not fully realized. However, MCD plays a crucial role in service delivery along with the other parastatal agencies like the Delhi Jal Board and different departments of the state and central government. Details of the services provided and the institutional arrangements are summarized in Table 1.
Table 1 Institutional Arrangement in Service Delivery in MCD
Functions Service Providers
Water Supply, Sewerage, Storm Water Drainage and Flood Control DJB
Sanitation, Solid Waste Management, Street Lighting, Development Plan Preparation,
Parks and Playfields, Planning and Designing for Poverty Alleviation Program, Primary Health, Building Plan Approval, Public Convenience
MCD
Fire Service DFS
Slum Development DUSIB
Poverty Alleviation Program, Secondary Health GNCTD
Tertiary Health GOI
Urban Transport DTC
Environment GOI and GNCTD
Education MCD, GNCTD and
GOI
Roads and Bridges PWD and MCD
Note: DJB- Delhi Jal Board, PWD-Public Works Department, DFS- Delhi Fire Service, DUSIB-Delhi Urban Shelter Improvement Board, GNCTD- Government of National Capital Territory of Delhi, GOI- Government of India, DTC-Delhi Transport Corporation
Source: Municipal Corporation of Delhi
1
The fiscal and financial autonomy of urban local bodies envisaged in the 74th Constitutional Amendment empowers MCD to levy a set of taxes and charges in its jurisdiction as a result of which MCD collects own revenues as tax and non-tax payments. While there are certain “obligatory taxes”, provision for some “discretionary taxes” are also there in the Municipal Act. MCD levies all the “obligatory taxes” but levies only two2 of its “discretionary taxes”. Transfers from the upper tiers of the government as “grants” and “assigned revenues” constitute a considerable share. Expenditures on service delivery and other administrative obligations are huge, resulting in perpetual unmet needs, both in current and capital components. The major components of revenues and expenditures are summarized in Box 13.
The budget speech of the Commissioner of MCD in December 2011 proposed revenue increases from six sources. While some of these relate to modifying the rates of the existing revenue components, there are also suggestions for certain new components to be introduced. Among the components for which hikes from the existing rates are proposed are “parking fees”, “one-time street charges”, “property taxes”, “fees from mobile towers”. Among the new components are the “conservancy charges” and the “congestion charges”. To state the MCD’s recommendations in short “parking fees” were proposed to be increased by three times; “one-time street charges” were proposed to rise by about three times; charges on mobile towers to be set at Rs.5 lakhs per tower and Rs.1 lakh per service provider in cases where services were shared and “property taxes” were to rise by 3-4 per cent with rebates being abolished. However, these recommendations could not be implemented due to political resistance.
2
Tax on sale and consumption of electricity and toll tax are the two heads which are imposed from the list of discretionary taxes. terminal tax was abolished in Delhi in 1993
3 “Other miscellaneous income” includes components like the fees from registration of birth and death,
fees from swimming pool etc.) .“Grant in aid for maintenance of school building” and “Grant in aid for maintenance of municipal assets” are the two components received in the last two financial years in our sample.
4 International Center for Public Policy Working Paper Series
BOX 1 REVENUE AND EXPENDITURE HEADS OBLIGATORY TAXES
Property Taxes Corporation Tax
Tax on vehicles and animals Milch tax and dog tax Theatre tax
Tax on advertisement Tax on building applications
DISCRETIONARY TAXES
Tax on consumption, sale or supply of electricity Toll tax Education cess Land Revenues Professions' Tax Betterment Tax Tax on boats
NON-TAX REVENUE HEADS
Law receipts and fines imposed by Municipal. Magistrate Education fees
Fines and cattle ponds Fees from hospitals
Fee from rickshaws including compounding fee Tehbazari
car parking
Fines of offences concerning buildings Food trade license
General trade license Factory license
Rents of markets and slaughter fee Fee from mobile phone towers Development charges Road restoration charges
Reimbursement of cost of administrative charges from different schemes Conversion Charges
Other misc. income
GRANTS
Grant in aid for education from govt.
Grant in aid for maintenance of school building Grant in aid for maintenance of Municipal. Assets
ASSIGNED REVENUES
Global share of assigned taxes on recommendations of Delhi Finance Commission from govt. One time parking charges collected by GNCTD at the time of registration of vehicles Municipal Reforms Fund
CURRENT EXPENDITURE HEADS
General Administration Licensing
Community Services Education
Public Health & Medical Relief Sanitation
Public works and street lighting Veterinary Services
Horticulture Land & Estate
In the light of the recommendations stated above, we intend to estimate the potential gains once these recommendations are implemented. The analysis is based on data collected through primary surveys from the budgets and other information (before trifurcation)4 from published annual reports followed by interviews and discussion with officials of MCD at different levels.
The paper is organized as follows. Section 2 gives a brief overview of the revenues and expenditures of MCD in recent five years. Section 3 attempts an evaluation of the performance of MCD in financial management. Section 4 elaborates on the role of user charges in urban public finance through a brief survey of the literature. Section 5 estimates the revenue potential based on the proposal for revisions of rates of the existing sources and introduction of new sources of revenues in MCD. Section 6 gives the concluding remarks.
2. Finances of MCD: An Overview
For the present analysis we consider the finances of MCD for a time period from 2007-08 to 2011-12 and analyse the trends, compositions and growth patterns of the revenue and expenditure components.
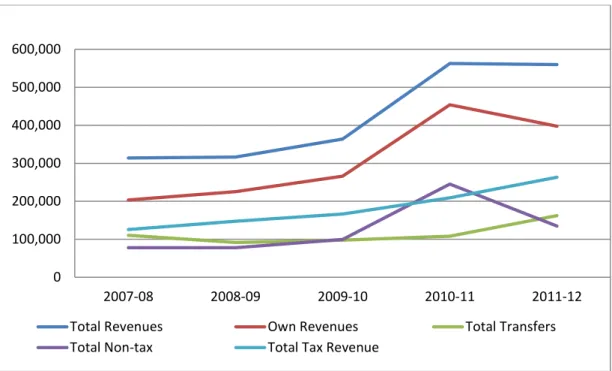
It is interesting to note that while tax revenues in the own revenue component rises steadily, there is a considerable fluctuation in the non-tax revenue collections over the last two years (2010-11 and 2011-12) which is reflected in the behavior of the own revenue component. Also, in spite of a more or less steadily increasing transfers, the total revenues capture these fluctuations as own revenues dominate (Figure 1).
4
In 2011, MCD was trifurcated and was divided into three corporations, viz North Delhi Municipal Corporation, South Delhi Municipal Corporation and East Delhi Municipal Corporation.
6 International Center for Public Policy Working Paper Series
Figure 1. Absolute Revenues in Current Prices (in Rs. lakhs)
Source: Municipal Corporation of Delhi
A close look at the MCD budgets from 2007-08 to 2011-12 suggest that all the components of tax revenues excepting tax on sale and consumption of electricity (which is dependent on the tariff structure of electricity) have shown a more or less increasing trend in five years, which is reflected in the behavior of the total tax revenues over these years. The three components of the tax revenues related to revenues from properties viz property tax, corporation tax5 and taxes on building applications have all risen in five years (Figure 2).
5 Duty on Transfer of Properties is collected as ‘corporation taxes’. The GNCTD collects it and passes on
the proceeds to the MCD after deducting a share from it.
0 100,000 200,000 300,000 400,000 500,000 600,000 2007-08 2008-09 2009-10 2010-11 2011-12 Total Revenues Own Revenues Total Transfers Total Non-tax Total Tax Revenue
Figure 2. Absolute Taxes in Current Prices(in Rs. lakhs )
Source: Municipal Corporation of Delhi
Corporation taxes have gone up more since 2009-10 after the hikes in circle rates6. Property taxes, although have increased initially have remained stagnant after 2010-11 while taxes on building applications have shown an evenly increasing trend. This can partly be attributed to the fact that in MCD, the proportion of properties adding to the base for property tax has been less. More and more properties have been demolished and reconstructed into apartments and newer dwelling units which resulted in relatively more additions in collections through corporation tax and taxes on building applications and relatively lesser additions in collections as property taxes.
6
The circle rate is the minimum rate for valuation for a plot, an independent house or a flat in a particular area. The circle rate varies across categories of colonies and is fixed by the state revenue ministry in Delhi. For example, as per the recent revisions of 2012, the circle rates for ‘A’ category colonies (that includes places like Defence Colony, Green Park, Panchsheel Enclave and HausKhas), the circle rate has been fixed at Rs.6,45,000 for every square meter. For ‘B’ category colonies the circle rate is
Rs.2,04,600 for every square meter, for ‘C’ category the circle rate is Rs.1,33,224 for every square meter, for ‘D’ category colonies the circle rate is Rs.1,06,384 for every square meter, for ‘E’ category colonies the circle rate is Rs.58,365 for every square meter, for ‘F’ category its Rs.47,140 for every square meter, for ‘G’ category colonies its Rs. 38,442 for every square meter and for ‘H’ category colonies its Rs.19,361 for every square meter. Circle rates are decided keeping in the mind the available infrastructure in a
particular locality and other factors (cost of construction, type of structure, multiplicative use factors). In Delhi, properties are registered at circle rates. If circle rates rise, stamp duty and registration fee, which is calculated as a percentage of registered price, are also expected to rise.
0 20,000 40,000 60,000 80,000 100,000 120,000 2007-08 2008-09 2009-10 2010-11 2011-12 Property Taxes Corporation Taxes Tax on building applications
8 International Center for Public Policy Working Paper Series
The trends of the non-tax revenues suggest that the heterogeneity in non-tax revenues head of ‘other miscellaneous income’ component results in a huge fluctuation in the two most recent years (2010-11 and 2011-12) which is reflected in the own revenues also, even if tax revenues dominate in the other years. However, the ‘conversion charges’ have shown a steep rise from 2008-09 to 2009-10 (and flattened thereafter) after the drive in 2007-08 when the shopkeepers were made to pay for doing business in the residential areas which were collected through conversion charges.
Until 2006, the share of the own revenues constituted only about 50 per cent of the total revenues. Between the period of 2007-08 and 2011-12, the shares of own revenues in the total revenues range between 60 to 66 per cent. Overall, the data from 2007-11 suggests that taxes constitute a major proportion of the total revenues with its share ranging from 40 to 47 per cent in the total revenues. On the other hand, the non-tax revenues constitute about 25 per cent of the total revenues while the shares of the transfers range between 19 to 35 per cent in the total revenues.
‘Property taxes’ and the ‘corporation taxes’ together constitute about 66 per cent of the tax revenues (with individual shares of close to 33 per cent each). The other major component of the tax revenues of the MCD is the ‘tax on consumption, sale and supply of electricity’ the share of which ranges from 15 to 24 per cent. The major components of the non-tax revenues are the ‘conversion charges’, ‘other miscellaneous income’ and components that includes ‘development charges’, ‘road restoration charges’ and ‘reimbursement of costs of administrative charges from different schemes’ (which constitute about 12 to 24 per cent of the non-tax revenues). These major components constitute more than 85 per cent of the non-taxes. The ‘one-time parking charges’ collected by the GNCTD has also been an important contributor of the non-tax revenues with the share ranging from 4 to 8 per cent. As far as the transfers are concerned, ‘grants’ and the ‘assigned revenues’ have had almost equal shares in the transfers.
Among the major expenditure areas of the MCD, expenditure on education has risen in quite a steep manner since 2007-08. This reflects MCD’s efforts to provide free education through its schools. Other major components of the expenditure categories
like ‘sanitation’ and ‘public health and medical relief’ have risen steadily over the period from 2007-08 to 2010-12 (Figure 3).
Figure 3. Major Components of Revenue Expenditure in Current Prices (in Rs. lakhs)
Source: Municipal Corporation of Delhi
MCD spends more than 50 per cent of its total current expenditure in the social sectors of ‘education’, ‘public health’ and ‘sanitation’ (with the largest share being spent on education). The other important heads are ‘public works and street lighting’ and ‘administrative expenses’.
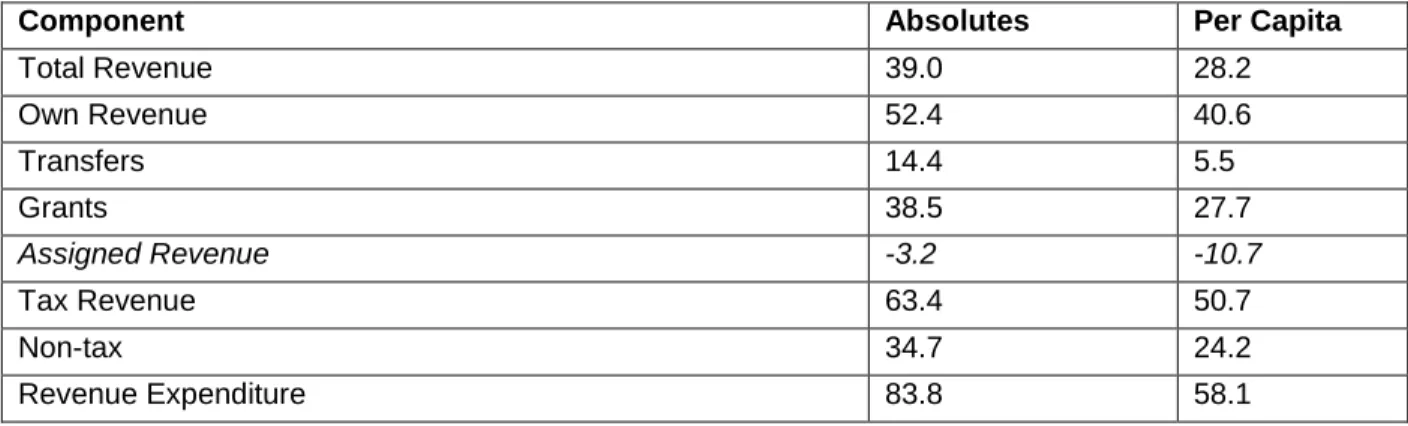
The five yearly growth rates for all the components of the total revenues are positive, with the absolute own revenues growing by 52.4 per cent and the absolute transfers growing by 14.4 per cent (Table 2). The tax revenues have grown by 63.4 per cent while non-tax revenues have only grown by 34.7 per cent. The ‘grants’ have risen by 38.5 per cent, but ‘assigned revenues’ have declined by 3.2 per cent. The reason for a negative growth of ‘assigned revenues’ is the reduction in the ‘global share of assigned taxes, on recommendations of the Delhi Finance Commission, by about Rs.
0 20,000 40,000 60,000 80,000 100,000 120,000 140,000 160,000 180,000 2007-08 2008-09 2009-10 2010-11 2011-12 General Administration Education Public Health & Medical Relief Sanitation Public works and street lighting
10 International Center for Public Policy Working Paper Series
28,712 lakhs (in 2009-10 prices). The growth in revenue expenditure is about 84 per cent during the same period. However, the per capita growth rates are lower than those for the absolutes for all these components.The difference between the growth rates for absolute revenue expenditure and for per capita revenue expenditure is the highest (almost 26 per cent).
Table 2. Five yearly Growth Rates of Components of Finance in MCD
Component Absolutes Per Capita
Total Revenue 39.0 28.2 Own Revenue 52.4 40.6 Transfers 14.4 5.5 Grants 38.5 27.7 Assigned Revenue -3.2 -10.7 Tax Revenue 63.4 50.7 Non-tax 34.7 24.2 Revenue Expenditure 83.8 58.1
Source: Authors’ Computations
Further, own revenues have made a higher contribution to the growth of total revenues than the transfers. Taxes have contributed steadily to the growth of the own revenues in the five years considered for the present analysis, while non-tax sources have made a significant contribution to the growth of the own revenues in the last couple of years. The growth of the taxes has mainly been driven by the property taxes while the conversion charges have contributed to most of the growth of the non tax revenues. Similarly, the key expenditure components (education, public health and medical relief and sanitation), have contributed to most of the growth in revenue expenditures.
3. Evaluation of Financial Performance of MCD
After taking a stock of what has happened in the recent few years in MCD in the context of revenue generation and expenditures, the next step would be to analyse the shortfalls and gaps comparing revenues and expenditures. We also derive some performance indicators to evaluate the financial performance of MCD. In the process we also estimate alternative tax and non-tax structures with revised rates and improved
coverage ratios and sometimes additional sources, to build up different scenarios for reducing the gaps. In the absence of detailed data on components of expenditures, our motivation to search for alternative scenarios to narrow the gaps is mainly driven by augmentation of revenues.
Table 3. Financial Performance of MCD: Some Indicators
Indicators 2007-08 2008-09 2009-10 2010-11 2011-12
Grants to Total Revenue (per cent) 15 15 13 11 15
Assigned Revenues to Total Revenues (per cent) 20 14 14 8 14
Own Revenue- Revenue Expenditure Gap
(Absolute, Rs Lakhs) 42,530 100,184 129,701 42,571 151,626
Own Revenue-Revenue Expenditure Gap (Rs, Per
Capita) 292 674 855 275 961
Revenue Expenditure Covered by Own Revenue (
per cent) 85 71 67 91 70
Own Revenue- Revenue Expenditure Gap as a
percentage of own revenue 18 42 49 10 43
Own Revenue- Revenue Expenditure Gap as a
percentage of Revenue expenditure 15 29 33 9 30
Revenues- Expenditures Gap( Rs Lakhs) 98,355 206,807 206,351 140,205 223,004
Revenues-Expenditures Gap (Rs, Per Capita) 675 1,392 1,361 906 1,413
Total Expenditure Covered by Total Revenue (per
cent) 79 62 64 79 69
Revenue- Expenditure Gap as a Percentage of
Total Revenues 27 61 57 27 45
Revenue- Expenditure Gap as a Percentage of
Total Expenditures 21 38 36 21 31
Source: Authors’ Computations
Table 3 above and Figures 4 and 5 below describe some indicators related to financial performance of MCD. The dependence on “grants” has been more or less stable with the percentage of “grants” to total revenues ranging between 11 to 15 per cent. As far as “assigned revenues” are concerned, the percentage varies between 8 to 20 per cent of total revenues.
12 International Center for Public Policy Working Paper Series
Figure 4. Revenue Expenditure Gaps : MCD (Rs Lakhs)
Source: Municipal Corporation of Delhi
Figure 5. Own Revenue and Revenue Expenditure Gap (Rs Lakhs)
Source: Municipal Corporation of Delhi
Own revenues fail to cover revenue expenditures and the gap almost tripled between 2007-08 and 2009-10, followed by a drastic fall in 2010-11 and again tripling within a year in 2011-12 amounting to Rs 151,626 lakhs. The trend is similar in per capita terms with the latest year recording a gap of Rs 961 per capita. 67 to 91 per cent of “revenue expenditure” are covered by “own revenues” during the past five years, with 70 per cent being covered in 2011-12. Expressed as a percentage of own revenues the shortfall in 2011-12 is 43 per cent which implies that own revenues have to increase by
0 100,000 200,000 300,000 400,000 500,000 600,000 700,000 800,000 2007-08 2008-09 2009-10 2010-11 2011-12
Total Revenues Total Expenditure
0 100,000 200,000 300,000 400,000 500,000 600,000 2007-08 2008-09 2009-10 2010-11 2011-12 Own Revenue Revenue expenditure
43 per cent more to cover the “revenue expenditures” fully. From an expenditure management perspective we can say that “revenue expenditures” have to be cut down by 30 per cent in order to close the gap.
The shortfall in “total expenditure” from “total revenues” more than doubled from Rs 98,355 lakhs to Rs 223,004 lakhs between 2007-08 and 2011-12, with a slight decrease in 2009-10 and a drastic decrease in 2010-11. 62 to 79 per cent of “total expenditures” are covered by the “total revenues” in the past five years with 69 per cent being covered in 2011-12. To close the gap, according to the latest year’s data, 45 per cent of total revenues need to be increased or 31 per cent of total expenditures to be curtailed.
Table 4 below describes some indicators related to municipal debt of MCD. While loan raised have been nil in some of the recent years, loan repayments as a percentage of own revenues and total revenues has been quite high. The average percentage of loan repayment to own revenues between 2007-08 and 2011-12 has been 16.3 per cent, while the percentage of loan repayment to total revenues is 11.7 per cent. However, this percentage has shown a downward trend in these years. Loan repayment has been quite a major burden for MCD. The repayment for loans usually happens from the global share of taxes that the GNCTD provides to MCD. Generally, the amount of the yearly repayment is deducted from the global share of taxes and the residual is passed to the MCD. With heavy repayment burden the amount of the global share of taxes that comes to the MCD has been shrinking resulting into limited resources for making capital expenditures. The average percentage of loan repayments to current expenditure and total expenditure is 12.4 per cent and 8.2 per cent. These percentages have, however, shown a downward trend.
14 International Center for Public Policy Working Paper Series
Table 4. Loans of MCD: Some Indicators
Indicators 2007-08 2008-09 2009-10 2010-11 2011-12
Loans to Own Revenues (per cent) 7.1 0 0 11 0
Loans to Total Revenue (per cent) 4.6 0 0 8.9 0
Loan Repayment Expenditure to Current
Expenditure(per cent) 17.6 14.2 11.4 10.7 9.7
Loan Repayment Expenditure to Total
Expenditure(per cent) 10.6 8.9 7.9 7.5 6.8
Loan Repayment Expenditure Own
Revenues(per cent) 20.8 20.1 16.9 11.7 13.8
Loan Repayment Expenditures to Total
Revenues(per cent) 13.5 14.3 12.4 9.5 9.8
Source: Municipal Corporation of Delhi
A few interesting points emerge. First, the trend of the shortfalls depends on the trend of the revenues as expenditures, both “revenue” and “capital”, has an overall increasing trend. Second, the option of closing the gap by reducing expenditure, either “current” or “capital”, might not be practically feasible. We find that many of the heads of revenues like “conversion charges”, “impact fee” etc., collections of which are supposed to be spent on “capital work” according to central government directives, are actually spent to finance salaries. So there are huge unmet needs both in “revenue” and “capital expenditure” components which would grow in the coming years.
The 74th constitutional amendment and other reform agenda on the urban local bodies had also stressed the need for more self-reliance of the urban local bodies through augmentation of the tax and non-tax revenues. On similar lines, the Third Delhi Finance Commission report had also stressed on the need to expand the non-tax base for MCD through the levy of the user charges and better utilization of the tax revenues. So there was some consensus that revisions of tax rates and introduction of new revenue components were required.As mentioned in Section 1, MCD did come up with suggestions of revenue augmentation through increases in certain revenue components and introduction of certain new components. However, none of these could materialize due to political and social resistance.
4. Role of User Charges in Urban Public Finance
User charges are one of the major sources of non-tax revenues for the urban local bodies. User charges are prices that are paid by the users for using various
services. The services for which user charges can be levied includes utilities (like water, sewerage etc.), places for recreation like parks, museums etc and other charges of such kind (like parking charges, fees for mobile towers etc.). User charges are more suitable for services which have properties of a “private good” and where the demand is more elastic in prices.
The main rationale behind levying user charges is that it can provide suppliers of services with information regarding the exact demand for services, the kind of services that are being demanded and correspondingly, the prices that they should charge for such services. Apart from bringing additional revenues, user charges are most helpful in restoring efficiency (Bird and Tsiopoulos1997: 25-86). Efficiency is guaranteed when the service delivery in question has an elastic demand and when it is possible to earmark the spending on those services through user charges. Further, as user charges are usually to be based on marginal costs, it ensures that there is no excess consumption of the services by the society. User charges are also useful to finance requirements for higher service delivery due to higher in migration in an area. An example of such an experience is the Umatilla County (in Oregon state) where there was a severe rise in population in the 1970s due to agricultural and industrial development in the nearby areas. The rise in population led to increase in the service delivery needs for the local government and this was met by having user charges, designed in a manner such that the burden was mainly on the new comers (Weber 1981: 2-11). A similar kind of success of user charges was also experienced in Osaka, where high population density led to concerns over sewerage treatment, especially since Osaka is located at a low elevation with respect to the sea level (Takesada1980: 985-991). Since most of the tax revenues were exhausted in fulfilling the social expenditure requirements, user charges were used to meet the expenses related to sewerage treatment and thereby controlling water pollution. An interesting feature of the Osaka user charge model was that it was progressive and there were frequent revisions of these charges. Higher user charges can also help in passing the increase in costs to the consumers and could also lead to a reduction in the unit cost. Borge and Ratts (2005; 98-119), in their analysis of the Norway sewer industry data from 1993-98, find that about 30 per cent to 40 per cent of the increase in costs is passed on to the consumers through higher user charges and
16 International Center for Public Policy Working Paper Series
that increase in user charge financing reduces unit costs by 10 per cent. Finally, there are also views that development of a city could also depend on the way in which it is financed and user charges could lead to a “low density” development, while property tax could lead to a “high density” development (Slack 2002: 1-25).
Designing the user charge is one of the major problems, especially in a developing country. User charges are usually perceived to be quite “regressive” and hence very often meet with resistance (Bird and Tsiopoulos 1997: 25-86). Given that they are unpopular, the administrators are also usually reluctant to have user charges as it annoys their clients (i.e the common people).User charges are often revised in long intervals and hence proper and thoughtful pricing is very important. Also, improper designing of user charges could lead to a misallocation of resources and lead to wrong incentives. Canada serves as a good example where user charges have been severely criticised as “revenue grabs” by a government running short of resources. User charges are based on the marginal cost pricing principle. However, estimating marginal cost could be difficult with limited details on costs. Also, generally accounting costs are reported, but opportunity costs and costs for externalities ideally should be included, estimating which are very difficult (Bird 2001: 71-82). Further, the marginal cost price rule may not be applicable in all the cases and other pricing rules may be required, depending on the nature of certain services (like average cost price rule or the two part tariff rule). Apart from proper pricing, there is also a need to convey and communicate to the people the rationale and the pricing strategies of the user charges. Lack of adequate communication to the people regarding the user charges was one of the factors behind the failure of such charges in Canada (Bird and Tsiopoulos 1997: 25-86).
User charges have been recommended as a possible source of revenues in many countries. Although, administrative costs for levying user charges may be high in a developing country (which may sometimes discourage such charge), user charges have a lot of potential to reduce deficits of local governments. Fox and Edmiston (2000: 1-29), in their work on urban public services in Africa, have argued that public enterprises in many African countries are in deficits as there are inefficiencies in levying of user charges, despite all their efforts in improving service delivery. They have
suggested that proper levying of user charges could be a solution and would help in increasing the efficiency of public services and higher revenues for the sub-national government.
Introduction of user charges, extension of such levies, better pricing of such charges, have also been extensively recommended for India in the literature on local government finances. The HPEC Report (2011) has recommended the levy of user charges as a major reform of the non-tax sources, while also focusing on providing greater autonomy to the urban local bodies for better levying and implementation of tax revenues. Rao and Bird (2010) have prescribed user charges for services having “private good” properties while taxes should finance services having “public good” properties. They have also suggested the levy of the development charges for “the growth-related capital costs for the area in which the development takes place”. In India, many urban local bodies have suffered with the abolition of octroi duties. Such ULBs, like the Greater Mumbai Municipal Corporation, could benefit from user charge levies to compensate for the revenue losses due to abolition of octroi (Rath, 2009: 86-93). Zhu et al (2007) have also suggested that user charges could lead to better solid waste management as on one hand such charges could lead to cost recovery and on the other hand it could also discourage generation of wastes. They have also cited the case of Kerala where Rs. 30 is collected from every household and Rs.50-75 is collected from commercial units on account of solid waste management, for the recovery of the operating costs. Further, pricing of water on the economic principles could also lead to revenue augmentation for the local bodies. TERI (2010) on pricing of water charges suggests that in most places in India pricing of water has no economic rationale behind them and is often driven by political motives (despite there being the system of volumetric metering in many places). This has resulted in lower costs recovery with full recovery of even the operating expenses being a rarity (with Chennai being an exception). The report also finds that under-pricing has also resulted in “poor services and reduced incentives to expand the spatial coverage of services”.
We see that user charges, if priced and implemented properly, have multiple benefits for the urban local bodies. Considering that revenue augmentation and thereby
18 International Center for Public Policy Working Paper Series
improving the financial health of urban local bodies remains the primary potential benefit from levying the user charges, it is interesting to quantify that potential and estimate the gains.
In the next segment of our analysis, we analyse and quantify the extent of gains in revenues that could have been achieved had the recommendations of the commissioner proposed in the budget speech of 2011 been implemented in MCD. We attempt some simple simulations where we build various scenarios and estimate the revenues that could be generated in those scenarios.
5. Estimation of Untapped Potential of Revenues in MCD
The recommendations proposed by the commissioner in the budget speech of 2011 are listed in Box 2. Our objective would be to estimate the loss of potential revenues that the urban local body of MCD incurs because of the political resistance faced in levying the additional tax and non-tax instruments proposed.
Box 2. Proposed Tax and Fee Structure in MCD
We attempt some simulations based on the proposed rate structure of the alternative revenue sources as well as the existing ones. We find that rates lower than those proposed by MCD for some sources of revenues can result in financial gains to a
Parking fees: MCD proposed a hike in rates by about three times which they expect should generate Rs.40 crore annually.
One-time Parking Charges: MCD proposed that rates may be raised by 2.5 times for vehicles priced below Rs.4 lakhs; by 3 times for vehicles with prices ranging between Rs.4-10 lakhs and by 5 times for vehicles priced above Rs.10 lakhs.
Fees from mobile towers: MCD proposed a fee of Rs. 5 lakhs per tower and Rs.1 lakh per service provider wherever there is a case of sharing of services.
Conservancy Charges: On this, the proposal states that conservancy charges should be levied at the rate of 10 per cent of the property taxes (before rebate).
Congestion Charges: On this, the MCD proposal states that levying of congestion charges would fetch the MCD Rs.50 crores annually.
Property Taxes: MCD proposed hikes ranging between 3-5 per cent in the existing rates of property taxes and abolishing of certain rebates. This whole process is expected to bring in Rs.150 crores to the MCD.
considerable extent which enables MCD to narrow down the gap between “total expenditures” and “total revenues”. The present analysis is based on limited data from the budgets of MCD, Delhi Statistical Handbook, Directorate of Economics and Statistics, Central Statistical Organisation and different secondary web based sources with extensive discussions with MCD officials and staff members. We intend to answer a few interesting questions. Can we come up with a set of tax and non-tax rates which would be less drastic than the structure proposed by MCD that would be more acceptable to the tax payers as well as the government? In the process we would build up scenarios through simulations which can prescribe lower rates yet fulfilling the objective of lowering the gap between “total revenues” and “total expenditures” of the urban local body. If there exists one, how would the composition of revenues be shuffled corresponding to that scenario? Can we estimate the component wise gains in “total revenues” resulting from this scenario, if implemented? In the entire process we assume that there is no change in any of the expenditure components.
Methodology
We start with rates and gains of revenues which are lower than those proposed in the budget speech mentioned above to build up a ‘conservative scenario’. We build up a ‘moderate scenario’ following the proposals in the budget speech. We also build up an ‘optimistic scenario’ adding the maximum property tax potential based on recent estimates of property tax potential by the MCD officials in the ‘moderate scenario’. This estimate is based on 80 per cent coverage of properties and maximum collections from un-authorised colonies under the jurisdiction of MCD. In the “optimistic scenario”, all the other components are same as the “moderate scenario” excepting “property tax”. The description of the scenarios and the estimated revenue potentials are discussd below. Parking fees: For the “moderate” and ‘optimistic’ scenarios, we have added Rs.40 crores to the existing revenues from the “parking fees” given in the revised estimates for 2011, in order to get the potential revenues. For the “conservative” approach we propose to have a hike of 1.5 times in the existing rate, which adds Rs.15 crores to existing “parking fee” collection. (less than half of Rs.40 crores which is taken in the “moderate” scenario).
20 International Center for Public Policy Working Paper Series
One-time Parking Charges: In the absence of readily available data on number of vehicles in each price range and an estimate of additional revenues generated by the proposed hike in rates, we assume a flat hike of the rates by 3.5 times for the “moderate” and “optimistic” scenarios. We propose a hike in rates by 2.5 for the “conservative” scenario. The gains in revenues in the “conservative” case are 60 per cent of that in the moderate/optimistic case.
Fees from mobile towers: Since we do not have any information regarding the number of the cases where services are shared, we have taken the number of illegal towers under MCD’s jurisdiction from a report of the Press Information Bureau, Government of India. For the “moderate” and “optimistic” scenarios we have multiplied the number of illegal towers present by the per tower charge of Rs.5 lakhs to estimate the revenue potential from this source. For the “conservative” case we have only considered half of the total number of illegal towers (assuming that collections can be possible from only half of the total number illegal towers operating in MCD) and multiplied the number by the per tower fee of Rs. 5 lakhs. However, there is a possibility of underestimation of revenue gains from this source as we are not considering the case of shared services.
Conservancy Charges: For the “moderate” and optimistic cases we have calculated “conservancy charges” to be 10 per cent of the “property taxes” while for the “conservative” case we have taken “conservancy charges” to be 5 per cent of the “property taxes”.
Congestion Charges: For the “moderate” and “optimistic” cases, we have taken “congestion charges” to be Rs.50 crores, and for the “conservative” case we have taken half of this amount (i.e. Rs.25 crores).
Property Taxes: For the “optimistic” case, we have added Rs 240 crores to the existing “property tax” collections. For the “moderate” case we have added Rs.150 crores to the existing property taxes and for the “conservative” case we have added Rs.75 crores.
Based on these proposals and assumptions we have calculated the revenue gains and changes in the compositions of the “own revenues” and thus “total revenues” for four scenarios including the “existing” case (where the calculations are based on the
latest revised estimates of 2011-12), and the three scenarios created for analysis (“conservative” “moderate” and optimistic).
We have also looked at the adequacy of the revenues to cover the expenditures. We find that if the MCD recommendations were implemented (i.e. in the moderate case) “own revenues” would rise by 19 per cent while the “total revenues” would rise by 13 per cent. In the “optimistic” case “own revenues” would rise by 21 per cent and “total revenues” would rise by 15 per cent (Figure 7). This would mean that “own revenues” would rise from Rs. 397,834 lakhs in the “conservative” case to Rs. 472,269 lakhs in the “moderate” case and Rs.482,169 lakhs in the “optimistic” case (Table 5). Further, the capacity of the “own revenues” to meet the “current expenditure”, which is just about 70 per cent in the “existing” case would go up to 77 per cent in the “conservative” case, 83 per cent in the “moderate” case and 85 per cent in the “optimistic” case.(Figure 6) On similar lines, the capacity of the “total revenues” to meet “total expenditures” rises from 69 per cent in the “existing” case to 74 per cent in the “conservative” case, 78 per cent in the “moderate” case and 80 per cent in the “optimistic” case..
The composition of the “total revenues” also changes once the simulation exercise is conducted. The share of the “non-tax” revenues goes up from 24 per cent in the “existing” case to 31 per cent in the “moderate” case while the shares of “transfers” and the taxes get reduced, implying that the burden is slowly being shifted to the non-tax components. In the “optimistic” scenario the share of the non-non-tax components falls slightly to 30 per cent as all the gains are in the “tax revenues” through the property taxes.
Table 5. Estimated Revenues in Different Scenarios (in Rs. Lakhs)
Existing Conservative Scenario Moderate Scenario Optimistic Scenario
Total Tax Revenue 263,254 270,754 278,254 287,254
Total Non-tax Revenue 134,580 166,097 194,015 194,915
Own Revenue 397,834 436,852 472,269 482,169
Total Revenue 560,120 599,138 634,555 644,455
22 International Center for Public Policy Working Paper Series
Figure 6. Revenue as a Share of Expenditure
Source: Municipal Corporation of Delhi, authors’ computations
Figure 7. Increase In Own and Total Revenues (aper cent)
Source: Municipal Corporation of Delhi, authors’ own computation
It would be interesting to know the distribution of total gains estimated in each scenario according to shares of the components of revenues. We find that the highest proportion of the gains is contributed by the prescribed revisions in the “one-time parking charges” in all the scenarios. Other components which contribute more than 10 per cent as shares in gains are “conservancy charges”, “fee from mobile towers” and “property taxes”. “Conservancy charges” can contribute to around 6 to 7 per cent of the
70 77 83 85 69 74 78 80 0 10 20 30 40 50 60 70 80 90
Existing conservative Moderate Optimistic
Own rev as a % of current exp. Total rev as a % of Total exp
9.8 18.7 21.2 7.0 13.3 15.1 0 5 10 15 20 25
Conservative Moderate Optimistic Own Revenues Total Revenues
total gains while “parking fees” can contribute around 4 to 5 per cent of the total gains in different scenarios (Figure 8).
Figure 8. Composition of Gains in Three Scenarios
Source: Municipal Corporation of Delhi, authors’computation 6. Conclusion
A detailed analysis of the finances of MCD suggests that the revenues are still dominated by the taxes. However,the importance of the non-tax sources has increased in recent years compared to what it was before. Considering that the corporation is one of the biggest in the world in terms of population, and Delhi being an important destination for in-migration, service delivery is an important issue and the need for service delivery is only expected to rise. This is likely to raise the expenditure requirements in the coming years.
The recommendations to augment the tax and non tax revenues came up at the right time but the inability of the government to sensitise people about the net future
3.8 5.4 4.7 42.3 36.9 32.6 6.4 6.7 5.9 11.2 12.8 12.3 17.0 18.0 15.9 19.2 20.2 28.5 0 10 20 30 40 50 60 70 80 90 100
Conservative Moderate Optimistic Property taxes Fee from mobile towers Conservancy charges Congestion charges One time parking charges Parking fee
24 International Center for Public Policy Working Paper Series
gains and lack of political will resulted in a failure to implement these measures. Upward revisions of tax and non tax components, which put greater burden on the common man, would always be unpopular. However, cases like the 24X7 water supply in Amravati (Ahluwalia 2012) suggests that there are always possibilities where initial protests take place with rate hikes. However, people eventually accept those hikes at a later stage when they start reaping benefits of better service delivery. In the present case of MCD, no such efforts were made which meant that the corporation lost out on a huge potential from its tax and non tax revenue components.
Our simulations show that even in the ‘conservative scenario’ where we have scaled down the recommended measures significantly from what had been proposed by the corporation, own revenues could cover almost 80 per cent of the revenue expenditure while total revenues could cover 75 per cent of the total expenditure. This is significantly higher from the ‘existing scenario’ (as per the revised budget estimates of 2011-12), where only 69 percent of the total expenditure was covered by the total revenues and 70 per cent of the revenue expenditure was covered by the own revenues. Hence even if the proposals were followed with moderation (as in the case of the conservative scenario), the revenue shortfall could have been reduced to a considerable extent. The loss of revenues that the corporation has incurred will definitely hurt the people of Delhi in future as the quality of service delivery will suffer due to the lack of resources. The paucity of resources could lead MCD into a ‘vicious circle’ where limited resources lead to poor quality of service delivery which discourages the people to pay higher taxes (and user charges), and that further degrades the quality of service delivery. Implementation of the proposal (even in a modified form) would have helped in breaking this circle.
References
Ahluwalia I.J (2012): A New Wave From Amravati, The Indian Express, March 7, 2012. Bird R.M (2001): “User Charges in Local Government Finance”; in R. Stren and M.E. Friere (eds), The Challenge of Urban Government, Washington, DC: World Bank, pp 71-82
Bird R.M and T Tsiopoulos (1997) “User Charges for Public Services: Potentials and Problems”; Canadian Tax Journal Vol. 45 No. 1; pp 25-86.
Borge E.L and Ratts (2005): “The Relationship between Costs and User Charges: The
Case of a Norwegian Utility Service”; Public Finance Analysis; Vol. 61, No. 1; pp 98-119.
Fox W and K Edmiston (2000): “User Charge Financing of Urban Public Services in Africa”; Andrew Young School of Policy Studies, Georgia State University; Working Paper 00-4; pp 1-29.
HPEC (2011): “Report on Indian Urban Infrastructure and Services, High Powered Expert Committee For Estimating the Investment Requirements For Urban Infrastructure Services”, March 2011.
IIHS (2011): Urban India 2011: Evidence
Municipal Corporation of Delhi, Non Plan Income and Expenditure Budget (2011-12) Municipal Corporation of Delhi, Non Plan Income and Expenditure Budget (2010-11) Municipal Corporation of Delhi, Non Plan Income and Expenditure Budget (2009-10) Municipal Corporation of Delhi, Non Plan Income and Expenditure Budget (2008-09) Rao M.G. and R.M. Bird (2010): “Urban Governance and Finance in India”; Working Paper No. 2010-68; National Institute of Public Finance and Policy; pp 3-41.
Rath A (2009): “Octroi - A Tax in a Time Warp: What Does Its Removal Imply for Greater Mumbai?” EPW Vol - XLIV No. 25; pp 86-93; June 20, 2009
26 International Center for Public Policy Working Paper Series
Report of Second Delhi Finance Commission (2002), National Capital Territory of Delhi Report of Third Delhi Finance Commission (2006), National Capital Territory of Delhi Slack E (2002) “Municipal Finance and the Pattern of Urban Growth”: The Urban
Papers; Commentary, C.D. Howe Institute; pp 1-25.
Takesada K (1980): “Sewer User Charges in Osaka; Journal of Water Pollution Control Federation” Journal of Water Pollution Control Federation; Vol. 52 No. 5; pp 985-991. TERI (2010): “Review of Current Practices in Determining User Charges and Incorporation of Economic Principles of Pricing of Urban Water Supply”; prepared for the Ministry of Urban Development, April 2010.
The Delhi Municipal Corporation Act (1957).
Weber B.A(1981): “User Charges, Property Taxes and Population Growth: The Distributional Implications of alternative Municipal Financing Strategies”; State and
Local Government Review, Vol. 13 No. 1; pp 2-11.
Zhu. D, Asnani P.U, Zurbrugg C, Anapolsky S, Mani S.K (2007): Improving Municipal Solid Waste Management in India: A Sourcebook for Policymakers and Practitioners; WBI Development Studies, November 2007
Links http://pib.nic.in/newsite/erelease.aspx?relid=70891 http://www.rohini-properties.com/mcd-circle-rates-2012-revised-in-delhi http://www.theteamwork.com/articles/2016-1502-what-circle-rate-real-estate-property-delhi.html http://efmlegally.blogspot.in/2011/12/delhi-hosts-highest-number-of.html http://articles.economictimes.indiatimes.com/2013-01-19/news/36432186_1_circle-rates-rics-south-asia-land-rates