1
Impact of Different Trajectory Option Set Participation
Levels within an Air Traffic Management Collaborative
Trajectory Option Program
Hyo-Sang Yoo1, Connie L. Brasil1, Nathan Buckley2, Gita S. Hodell2 San Jose State University /NASA Ames Research Center, Moffett Field, CA, 94035Scott N. Kalush3
Human Solutions Inc., Washington, DC, 20024 and
Paul U. Lee4, Nancy M. Smith5
NASA Ames Research Center, Moffett Field, CA, 94035
This paper presents the methodology and results of a Human-In-The-Loop (HITL) simulation study conducted in the Airspace Operations Laboratory at NASA Ames Research Center. This study is a part of NASA’s ongoing research into developing an Integrated Demand Management (IDM) concept, whose aim is to improve traffic flow management (TFM) by coordinating the FAA’s strategic Traffic Flow Management System (TFMS) with its more tactical Time-Based Flow Management (TBFM) system. The purpose of TFM is to regulate air traffic demand so that it is delivered efficiently through constrained airspace resources without exceeding their capacity limits. The IDM concept leverages a new TFMS capability called the Collaborative Trajectory Options Program (CTOP) to strategically pre-condition traffic demand flowing into a TBFM-managed arrival environment, where TBFM is responsible for managing traffic tactically by generating precise arrival schedules. Unlike other TFM tools, CTOP gives flight operators the option of submitting a set of user-preferred alternative trajectories for each flight. CTOP can then use these trajectory option sets (or TOSs) to find user-preferred alternative routes to reduce demand on an overloaded resource. CTOP’s effectiveness in redistributing demand is limited, however, by the availability of flights with alternative routes. The research presented in this paper focuses on evaluating the impact on TFM operations by varying the percentage of flights that submit a multiple-option TOS (‘TOS participation levels’). Results show the impact on overall system performance and on the rerouted flights themselves. The simulation used a Newark (EWR) airport arrival scenario, with en route weather affecting traffic inbound from the west. Participants were asked to control each of the three arrival flows (north, west, and south) to meet their individual capacity constraints while simultaneously ensuring efficient utilization of the capacity at the destination airport. A large, permeable convective weather cell located southeast of Chicago severely reduced the capacity of the west flow. The study evaluated the impact of five different TOS participation levels on CTOP’s ability to re-allocate traffic from the west and improve TFM performance in terms of delay assignment and traffic delivery rate to the airport. Overall, the results showed that increasing TOS submissions allowed the overall system delays to be reduced and fairly distributed among the three arrival flows, at the same time achieving the airport throughput rate. Moreover, it was found that aircraft who submitted a TOS saw a greater reduction in delay, even when they were assigned longer routes. This was particularly true when fewer aircraft submitted a TOS. The results confirm that the CTOP operations
1 Senior Research Associate, Human Systems Integration Division, SJSU/NASA ARC; [email protected] 2 Research Associate, Human Systems Integration Division, SJSU/NASA; ARC MS 262-4
3 Simulation Engineer, Human Systems Integration Division, NASA ARC; ARC MS 262-4 4 Research Engineer, Human Systems Integration Division, NASA ARC; ARC MS 262-4 5 Research Psychologist, Human Systems Integration Division, NASA ARC; ARC MS 262-4
2
with higher TOS participation levels helped utilize the overall National Airspace System (NAS) resources as well as benefited the users who participated.
Nomenclature
AAR = Airport Acceptance RateAC = Adjusted Cost
AFP = Airspace Flow Program
ATCSCC = Air Traffic Control System Command Center CTOP = Collaborative Trajectory Option Program EDCT = Estimated Departure Clearance Time ETA = Estimated Time of Arrival
EWR = Newark Liberty International Airport FAA = Fedral Aviation Administration FCA = Flow Constrained Area FH = Freeze Horizon (TBFM) GDP = Ground Delay Program HITL = Human-in-the-loop IAT = Initial Arrival Time
IDM = Integrated Demand Management
MACS = Multi-Aircraft Control System (NASA ATC simulation platform) MFX = Meter Fix (TBFM)
MIT = Miles-in-Trail
NAS = National Airspace System nCTOP = NASA CTOP emulation
NOAA = National Oceanic Atmospheric Administration PGUI = Plainview Graphical User Interface (TBFM) RAP = Rapid Refresh
RBS = Ration-by-Schedule RTA = Required Time of Arrival RTC = Relative Trajectory Cost SME = Subject Matter Expert STA = Scheduled Time of Arrival TBFM = Time-Based Flow Management TFM = Traffic Flow Management TFMS = Traffic Flow Management System TMI = Traffic Management Initiative TOS = Trajectory Options Set
XM; XMP = Extended Metering; Extended Metering Point (TBFM)
I.
Introduction
ASA Ames researchers are developing a near- to mid-term concept called Integrated Demand Management (IDM)1-3. The overarching goal of IDM is to ensure efficient access to capacity-limited NAS resources by coordinating the Federal Aviation Administration’s (FAA’s) strategic Traffic Flow Management System (TFMS) and its tactical Time-Based Flow Management (TBFM) system1,2. IDM uses a new automation-supported Traffic Management Initiative (TMI), the Collaborative Trajectory Option Program (CTOP), to better manage the traffic demand into TBFM. With CTOP preconditioning, TBFM airborne and departure delays can be reduced while maintaining throughput at the destination airport.
CTOP resolves capacity/demand imbalances by controlling departure times and/or rerouting flights to avoid overloading capacity-limited airspace resources. It provides a mechanism for flight operators to submit a set of cost-weighted route options called a Trajectory Option Set (TOS) instead of a single route for a flight between two airports4. CTOP can access these route options when managing demand/capacity imbalances to provide a solution that incorporates user preferences, and past studies indicate that this can also result in better utilization of NAS resources5. However, the effectiveness of CTOP may depend on how many operators choose to develop and submit multiple-route TOSs for their flights. The purpose of the research presented here is to investigate how varying levels of TOS
N
3
participation could lead to different operational outcomes from the perspective of both the overall system and the flight operators.
The Human-In-The-Loop (HITL) study was conducted in August 2017 at the Airspace Operations Laboratory at NASA Ames with a Subject Matter Expert (SME) who has extensive experience in air traffic management. The following section gives an overview of the IDM concept development, CTOP operations, a description of the set up for the HITL study, the results, and suggestions for future research.
II.
Background
A. Overview of Prior IDM ResearchNASA began developing the near- to mid-term concept called Integrated Demand Management (IDM) in 2015, using a problem involving arrival traffic to Newark Liberty International (EWR) Airport as a test case1,2. EWR was selected because it routinely experiences some of the highest arrival delays in the NAS6. In current day operations, traffic demand at EWR is commonly managed using pre-determined Miles-In-Trail (MIT) spacing to feed long-haul traffic into TBFM, which creates arrival schedules to manage demand into the TRACON. However, this technique does not necessarily produce either an efficient flow, or equity for short-haul flights (e.g. from Dulles or Boston) that may find themselves experiencing last-minute ground delay when the arrival flow is saturated1,2.
The initial phase of IDM research explored CTOP departure scheduling to improve system performance by using Expected Departure Clearance Times (EDCTs) to control the entry times of EWR arrivals into the TBFM-managed region of airspace during clear weather operations1,2. One early question was how accurate the entry times needed to be, and Required Time of Arrival (RTA) clearances were tested as a means to improve conformance2,3.
Figure 1 presents the schematic representations of the initial IDM concept.
Figure 1. Initial IDM Concept Overview1.
In the initial IDM concept, the ring-shaped Flow Constrained Area (FCA) was located approximately 40 nm from EWR airport near the TBFM arrival Meter Fixes (MFXs) (see Figure 1). CTOP strategically managed the arrival traffic demand to meet a capacity target at the FCA, which was set equal to the projected capacity of the airport. An operational version of TBFM (release 4.2.3) was modified to support the concept evaluation by adding an Extended Metering (XM) region. In current day operations, TBFM is set to manage traffic using an arrival schedule whose freeze horizon is nearly 400 nm from the MFXs on the New York Center-TRACON boundary. In the IDM concept, such a long TBFM metering range was partitioned into two shorter segments: the MFX arrival scheduler covered
4
about a 140 nm radius from each MFX, and the XM en route scheduler managed traffic within an outer TBFM region that was 200-250 nm in extent. Although the CTOP generated traffic demand schedules to the FCA located at the TBFM MFXs, there was no direct linkage between the CTOP and TBFM in scheduling aircraft, which ensured the robustness in operations of the two systems by allowing more flexibility. This allowed the CTOP to remain as a tool to strategically precondition the traffic demand, then to have the TBFM with the final authority to manage the final schedule of the aircraft more tactically1,2.
When the CTOP is implemented, the aircraft that are included in the program are identified. Available slots for each FCA are first assigned to the aircraft that have “exempt” status: flights that are already airborne, are part of another TMI, or manually controlled by traffic managers, or within 30 minutes from departure. Next, the CTOP allocation algorithm runs and assigns available slots to the “non-exempt” flights in the order of the Initial Arrival Times (IATs), which are the earliest arrival time at any of a CTOP’s FCAs among any submitted TOS options. In the initial IDM concept development, there was only one constraint at the final destination airport, which was specified by the ring-shaped FCA. The CTOP has the capability to incorporate the preferences of flight operators with respect to assigning ground delays and reroutes. This capability is enabled by allowing flight operators to submit TOSs. The flight operators may provide their preference in the form of the Relative Trajectory Cost (RTC) for each TOS option they submit. During the slot assignment process, each flight’s preference for TOS options is accounted for by placing the flight on the TOS option with the least Adjusted Cost, which is the sum of RTC and potential ground delay that could be assigned by taking each associated TOS option2. In the initial IDM concept development, there were no additional TOS options available to submit by airlines to reroute from that FCA and, hence, only the departure ground delay assignment capability was explored.
A series of HITL experiments were conducted in 2016 at the Airspace Operations Lab at NASA Ames Research Center to evaluate the initial IDM concept development. The results of the experiments showed that the CTOP was able to strategically control the departure schedules for incoming traffic demand into EWR based on the Ration-By-Schedule (RBS) Algorithm scheme1,2. This enabled equitable treatment across all flights regardless of departure origins, which led to: 1) delivering more manageable traffic flows into TBFM regions, resulting in less excessive airborne delays assigned by TBFM metering capability, and 2) reserving slots in the overhead streams for departures taking-off within TBFM regions. This eliminated the commonly incurring last-minute excessive ground delays (known as “double-penalty”) assigned to those departures by TBFM departure schedulers and improved the departure schedule predictability. Such outcomes were attained while maintaining high throughput at the airport in the simulated environment where realistic wind forecast errors and departure errors were present. The RTA capability was also examined within the initial IDM concept development as a control mechanism to deliver aircraft to TBFM entry points with more precision, where the targeted TBFM entry times were propagated from the CTOP generated departure schedules based on the available slots at the ring-shaped FCA. The results showed that the RTA capability mitigated the uncertainty in traffic demand delivery into the TBFM regions. However, no clear benefits in terms of reducing delays and improving throughput were observed in the tested simulation environment2.
B. Overview of Current IDM Research
The next phase of the IDM concept development added multiple FCAs and TOSs, to enable the study of fix balancing, ground delay and rerouting. This study focused on evaluating how varying TOS participation levels may produce different outcomes in TFM operations. A new EWR inbound traffic scenario was built that added convective weather affecting the west gate arrivals, and TOS route options that used different arrival gates. Figure 2 presents the schematic overview of the tested condition in the second phase of the concept development and evaluation.
5
In this second phase, three FCAs were placed at the EWR runway threshold to manage the traffic demand to the north, south, and west arrival gates individually while ensuring that the sum of the demand across all three gates met the target throughput at the airport. Each flight had up to three route options (one per FCA). Simulated convective but permeable weather was added to restrict the en route airspace capacity for traffic arriving via the west gate. This created a problem where CTOP could use TOS reroutes to offload the affected gate, improving system performance by maintaining throughput, and reducing or redistributing delay. Airport capacity was also constrained to be lower than the total initial scheduled demand to the airport so we could explore the CTOP’s capability of handling a multiple demand/capacity mismatch (i.e., both airspace and airport) within a single program. Without CTOP, multiple independent TMIs (e.g. Ground Delay Program and Airspace Flow Programs) may be needed, however only one can be active for a given flight.
The IDM concept with multiple FCAs and TOS during convective weather scenarios builds on the TBFM adaptation for XM and MFX metering used in the initial clear weather IDM concept. Similar to the initial IDM, CTOP is still used to pre-condition the traffic into TBFM but in this version, IDM assigns capacity for both upstream meter fixes and downstream airport constraints with the help of a new decision support tool called "Fix Balancing Algorithm" (FBA). The details of the FBA and the evaluation of the tool will be reported in Ref.7. The current paper will describe the HITL experiment and the results focused on CTOP performance in the IDM concept with varying levels of TOS participation.
III.
Concept Evaluation: The Human-In-The-Loop Study
A HITL experiment was conducted in August 2017 to evaluate the impact of varying TOS participation levels on TFM operations. This section describes the experiment’s design and its results. The study addressed the following two research questions:
1. How do the different TOS participation levels by airlines affect the overall TFM operations? 2. What outcomes could there be for the airlines who participated in the program by submitting TOSs? The effectiveness of the CTOP operations in the field may depend on the number of airlines that are willing submit multiple-option TOSs for their flights. This would require that flight operators modify their flight planning automation and procedures. The research questions above assume that there will be early and late adopters for the CTOP operations with respect to the TOS submissions, resulting in different TOS participation levels. Hence, the impact of the different TOS participation levels was investigated from the flight operator’s perspective as well as that of the overall system.
The CTOP is designed to incorporate flight operator preferences during the process of managing traffic. Operator priorities are represented by assigning a relative trajectory cost (RTC) value to each TOS option. TOS participation levels were varied by modifying the number of flights that submitted alternative TOS options in addition to their original flight plan. In order to demonstrate the impact of the various levels of TOS participation, the TOS participants were randomly selected to vary the levels, rather than taking the airline-based participant selection approach.
In the HITL study, there were five different TOS participation levels (0%, 25%, 50%, 75%, and 100%). The airport throughput, ground delays and flight time changes associated with the CTOP were the metrics used to measure its impact on the operations.
A. Methodology
A.1. Trajectory Options and Associated RTC Value Generation
The multiple route options for aircraft were initially identified by clustering three months of flown flight plan routes (June to August 2015), using the hierarchical clustering technique, with the dissimilarity between different routes being measured by computing Euclidean distance8. Prior to the application of the hierarchical clustering technique, extreme outliers were visually detected and removed. The appropriate number of clusters was chosen by comparing average silhouette scores9. The identified routes using the clustering techniques were, then, reviewed by three SMEs— retired air traffic managers from Cleveland Center, Washington Center, and Air Traffic Control System Command Center (ATCSCC)—to determine whether the routes were operationally and procedurally acceptable. Out of 195 aircraft, 143 in the scenario were identified as candidates for having multiple route options regardless of potential eligibility due to possible exemption at the time of CTOP implementation. Due to the nature of the flows into EWR, mostly west flow flights have the alternative routes for all three gates mapped to the FCAs. RTC values can be computed differently based on the airlines’ own business model and their evaluation functions to express their preference on the trajectory options. However, in this study, in order to determine how RTC affects the outcomes, the RTC values were computed and applied using the simple equation below:
6
𝑅𝑇𝐶 = 1.5 × (𝑓𝑙𝑖𝑔ℎ𝑡 𝑡𝑖𝑚𝑒 𝑜𝑓 𝑡ℎ𝑒 𝑐𝑢𝑟𝑟𝑒𝑛𝑡 𝑡𝑟𝑎𝑗𝑒𝑐𝑡𝑜𝑟𝑦 𝑜𝑝𝑡𝑖𝑜𝑛 𝑎𝑠 𝑖𝑛𝑑𝑖𝑐𝑎𝑡𝑒𝑑 𝑎𝑠 𝑡ℎ𝑒 𝑚𝑜𝑠𝑡 𝑝𝑟𝑒𝑓𝑒𝑟𝑒𝑑 𝑜𝑝𝑡𝑖𝑜𝑛 − 𝑓𝑙𝑖𝑔ℎ𝑡 𝑡𝑖𝑚𝑒 𝑜𝑓 𝑡ℎ𝑒 𝑎𝑙𝑡𝑒𝑟𝑛𝑎𝑡𝑖𝑣𝑒 𝑡𝑟𝑎𝑗𝑒𝑐𝑡𝑜𝑟𝑦 𝑜𝑝𝑡𝑖𝑜𝑛𝑠)
As mentioned earlier, the CTOP-slot-assign algorithm allocates the trajectory option with the least Adjusted Cost, which is the sum of RTC and potential ground delay that could be assigned by taking the option. The multiplication of 1.5 times the flight time difference is to reflect that the airborne delay is 1.5 times more expensive than ground delay, based on the cost ratio reported by airlines10.
A.2 EWR Traffic Scenario
EWR arrival traffic, including traffic coming from the North Atlantic was used for the test scenario, using historical Center TRACON Automation System (CTAS) data from NASA data warehouse11. Several modifications to the traffic were made to create a greater mismatch between the demand and the capacity. The scenario was designed to have the traffic demand build up as the first inflight aircraft entered the TBFM freeze horizon boundaries and that aircraft landed after about 90 minutes into the simulation start. The representative EWR arrival traffic characteristics were maintained by allowing a varying mix of international and domestic traffic, as well as perserving the proportion of EWR inbound flights departing from airports that are both near and far.
The scenario had the original unmanaged scheduled demand averaging about 48.8 aircraft per hour (195 aircraft scheduled to land at a single runway EWR 22L for about four hours). The scenario was comprised of 42 airborne aircraft, 86 long-hauls departure departing outside TBFM regions, and 67 short-haul departures taking-off within the TBFM region—this approximately matches the proportion of the short-haul departures in the current day operation. The heaviest flow (76 aircraft out of 195) arrived from the west through Cleveland Center (ZOB). The south flow had the second heaviest traffic demand (73 aircraft out of 195) through Washington Center (ZDC). The north had the least traffic demand (46 aircraft out of 195) through Boston Center (ZBW) and included international arrivals that crossed the North Atlantic.
A.2 Experiment Design
The experiment was a 5 × 3 design. The two independent variables were five different participation levels of TOS submission (0%, 25%, 50%, 75%, and 100%), and three different methods for setting capacities for FCAs (15-minute manual, 60-minute manual and FCA-Balance Algorithm). Each condition was run once. Hence, the experiment consisted of 15 total runs, in which each run lasted about 15 minutes. There was a 15 minute training session for each on the different methods for setting capacity and the five TOS participation levels. The training session was conducted with a separate EWR practice scenario. The 0% TOS participation condition assumed no flight operators submitted alternative routes. Hence, there were only the initially submitted flight plans, which became the single trajectory option when the program initiated. Only the aircraft that are identified to have more than one route option and holding “non-exempt” status by the time of the program initiation were identified as the “TOS candidates.” The 25% TOS participation level assumed that the 25% of the TOS candidates in the traffic scenario were randomly selected to participate in TOS submission and pre-loaded with the multiple TOS options. For 50% and 75% TOS participation level, 50% and 75% of theTOS candidates in the traffic scenario were randomly selected to participate in TOS submission and pre-loaded with the multiple TOS options. The 100% TOS participation level presumed that all TOS candidates submitted more than one alternative route option.
Handling multiple FCAs within a single CTOP creates some challenges for users, such that an efficient method of allocating resources to multiple FCAs simultaneously is required. In this study, there were three different methods identified for setting the capacity for the FCAs, which include 15-minute manual setting method, 60-minute manual setting method, and the FCA-Balanced Algorithm (FBA) capability method. Two manual methods (15-min manual setting method and 60-min manual setting method) are tied to how the user interacts with the CTOP Graphical User Interface (GUI) today, and also how the user monitors, evaluates, and assigns available capacity to the initially uncontrolled scheduled demand that could be presented in either 15-minute or 60-minute bins. The FBA capability is a decision support tool developed at NASA as an enhancement to the CTOP capability. The FBA evaluates the originally scheduled demand for each FCA and distributes total available capacity among all FCAs in proportion to their scheduled demand. It evaluates the demand of the FCA per 15-minute bin and dynamically assigns capacity. It also accounts for the projected change in traffic demand due to delay assignment to the earlier traffic that may affect the proportion of later scheduled traffic. The results of assessing the systematic performance of using different capacity setting methods, including the FBA automation tool, and their effect on cognitive aspects of multiple users and their task performance will be reported at the Digital Avionics Systems Conference (DASC) in Fall 2018 (Ref. 7). In this paper, the different methods had minimal impact on system performance in the CTOP operations but had a significant
7
human factor impact on the users. Hence, this paper will not focus on the impact of using the different capacity setting methods.
A.4. Participant
One retired air traffic manager from the ATCSCC with extensive traffic management background and understanding of the CTOP operations participated as a representative user for this study.
A.5. Apparatus
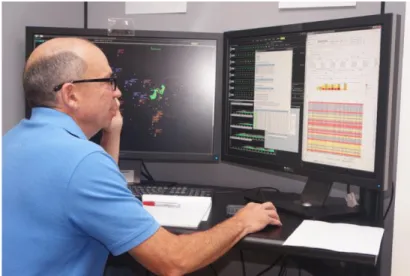
The simulation was run on the Multi-Aircraft Control System (MACS) software, which provides a high fidelity air traffic control simulation environment1,2. The TFMS planner stations were provided with a customized MACS Traffic Situation Display (TSD) emulation to allow planners to monitor and manage traffic, in conjunction with NASA’s in-house emulation of CTOP, called ‘nCTOP’ (see Figure 3). The nCTOP follows the CTOP’s primary function of assigning delays and/or reroutes around multiple FCAs, resolving the projected demand and capacity mismatch problem(s). The nCTOP also has some additional features, compared to the actual fielded version of the CTOP, such as a performance modeling capability that provides more detailed information to the user to better represent the outcomes of the CTOP program7.
Figure 3. CTOP Planner Station with MACS TSD emulation (left) and nCTOP (right).
On the TSD scope, the subset of the weather cell graphics (from14-July-2015 21Z) blocking the west flow was inserted to provide the participant with the visual information on the significant weather impacted airspace. The MACS software also allows entering the wind effect into the simulation, which affects the trajectory computation. Figure 4 shows the wind condition at about 30,000 feet that was inserted and simulated. At that altitude, the wind speed ranged from 0.2 to 117.5 knots, where the average and SD are 32.3 and 18.9 knots, respectively.
The arrows in Figure 4 indicate the speed (m/s) and the direction of the wind.
8 A.6. Operational Procedure
The primary task of the participant was to monitor the originally scheduled demand per FCA and allocate available capacity to each FCA. The participant was positioned at the CTOP planner station (see Figure 3) and informed that their task was to assess the overall systematic performance in the command center’s traffic planning position to resolve any mismatch between demand and capacity. The participant was provided with a situation where the severe but permeable weather cell over ZOB airspace was introduced to create the constraint on the available airspace for the west flow traffic demand. The participant was informed that the maximum permeability of the west gate is 12 aircraft per hour. The maximum available capacities for the north and the south gate were 24 and 28 aircraft per hour, respectively. In addition, the participant was instructed to utilize the maximum available capacity at the airport while meeting the capacity constraint at each gate, specified by FCAs. The target throughput at the airport was given at a 44 aircraft per hour rate, which was specified as the maximum available capacity at the airport.
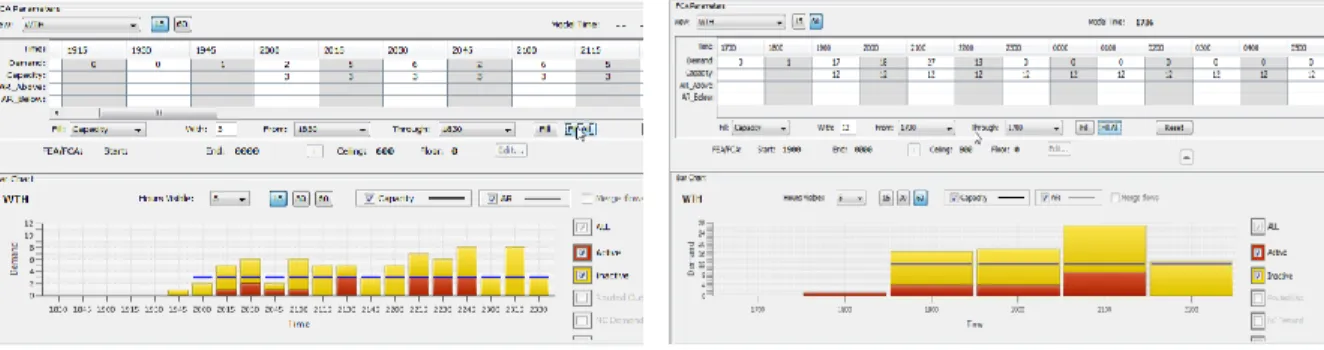
The nCTOP GUI displays the traffic demand projected to flow through the FCA in a bar chart form, where the bin range can be selected to be either a 15-minute or 60-minute bin range view (see Figure 5).
Figure 5. nCTOP’s Bar Chart: 15-minute bin range view (left) & 60-minute bin range view (right). The participant was instructed to monitor the initial scheduled demand for each FCA and was asked to set the start time of the program to be 90 minutes from the start of the simulation run time. The end time of the program was not to be specified as the traffic demand dissipates toward the end. Next, the participant was asked to evaluate the initial scheduled demand for each FCA and assign the appropriate capacity per bin (either 15-minute or 60-minute bin range view depending on which capacity method condition the participant was in) for each FCA. In the FBA method condition, the process of assigning capacity per bin was assisted by FBA automation capability. Once the capacity for each FCA is set, the participant was asked to run the CTOP allocation algorithm using nCTOP’s demand monitoring, departure scheduling and rerouting capability. The participant then reviewed the forecasted outcome using the nCTOP’s modeling capability. If the projected outcomes are determined to be acceptable, the participant was instructed to further proceed to assign the new departure times and route plans to the aircraft that are part of the program. If not, the participant was allowed to make changes to their resource allocation plan and make necessary adjustments to the capacity per bin, and re-run the CTOP allocation algorithm until the program results were satifacory. For each run, the participant was not informed about what percentage of the aircraft participated in TOS submission. B. Results
The results will be presented in two parts. The first will present the effect of different TOS participation levels on overall TFM systems performance, and the second will explore the impact of different TOS participation levels on the group of flights that submitted alternative trajectory reroute options. As mentioned earlier, the comparison of three different methods for setting capacity yielded many interesting results, which will be elaborated in Ref. 7. Again, this paper will only focus on discussing the impact of varying TOS participation levels.
B.1. Impact of TOS participation on the overall TFM operations
The main hypothesis of the study was that CTOP may be more effective in managing NAS resources when more flight operators submit TOSs, indicated by a reduction in program-assigned delay and improved utilization of available capacity at the destination airport.
B.1.1. CTOP Produced Delays in the Overall Operations
Table 1 shows the changes in ground delay assigned to the non-exempt pre-departures in the five TOS participation level conditions. As the airspace and airport capacity remained the same in all five conditions, the delays assigned by
9
the CTOP in each condition indicate how well the demand was distributed across these resources. The table contains the data collected across three different methods for setting capacities for each participation level.
Table 1. Summary statistics of the ground delay (minutes) assigned to the non-exempt flights
TOS participation levels Avg. SD Median Max. N 0% TOS 43.0 53.9 9.0 153.1 375 25% TOS 29.5 37.9 10.4 107.1 378 50% TOS 22.6 20.1 17.4 78.0 375 75% TOS 21.4 10.9 23.5 47.3 379 100%TOS 22.3 10.3 24.6 45.7 379
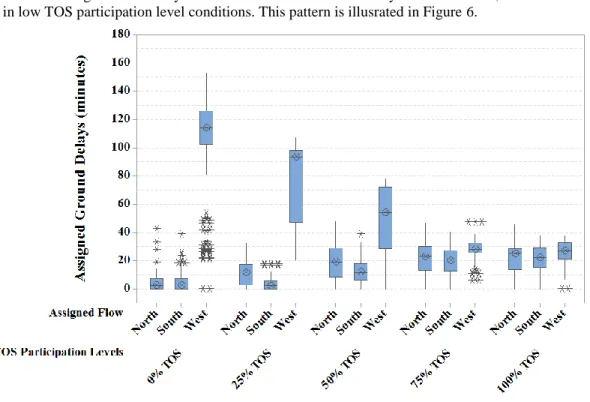
The summary statistics in table 1 confirmed the hypothesis that TOS participation results in an overall reduction in delay (from an average of 43.0 minutes at 0% TOS, to 22.6 minutes at 50% TOS). Higher participation levels also show a reduction in maximum delay as the demand on the constrained flow is further reduced. The data were found to be non-parametric. Hence, the Kruskal-Wallis test was conducted to examine the effect of the different TOS participation level and a statistically significant difference was found (H = 44.9, p < 0.05). It was observed that the ground delays assigned during the 50%, 75%, and 100% TOS participation level conditions were similar and the results showed that there was no significant difference between the 75% and 100% TOS participation level conditions in terms of assigned ground delays (H = 1.94, p = 0.16). In Table 1, it was also seen that the mean and median values diverge, particularly in the low TOS participation level conditions, indicating a skewness in the ground delay distributions. The divergence is mainly due to the difference in the delays between north, south and west flows, especially in low TOS participation level conditions. This pattern is illusrated in Figure 6.
Figure 6. Box-plots of effect of TOS participation levels on assigned ground delays (minutes) for the non-exempt flights per newly assigned flow.
Figure 6 above shows how ground delays were redistributed across the different flows (north, south, and west) with higher TOS participation levels. Figure 6 shows that the west flow (i.e. the weather impacted airspace) in the lower TOS participation level conditions received higher ground delays than the aircraft in the other flows, explaining the observed divergences between the mean and median in Table 1. The outliers are presented as the “*” symbol, which are the observations that are more than 1.5 times the interquartile range (Q3 – Q1) from either the upper/lower edge of the box. The west gate flow’s outliers in the 0% TOS participation level conditions were mostly the aircraft that arrived early in the program, when slots were still available. Hence, they received relatively less ground delay than the majority of the traffic.
Table 2 below summarizes the ground delays assigned to the non-exempt flights by flow. As the ground delays assigned to the west flow were observed to decrease with increased TOS participation level (H = 262.0, p < 0.05), a
10
corresponding increase in ground delays assigned to the south (H = 358.0, p < 0.05) and the north flow (H = 136.2, p < 0.05) was also observed, with ground delays across all three flows converging as traffic was off-loaded to the north and south gates. As shown in Figure 6 and Table 2, the ground delays were fairly evenly distributed across the three flows in the high TOS participation levels (i.e. 75% and 100%) while the delay distributions were uneven for the lower TOS participation levels (0%, 25%, and 50%).
Table 2. Summary statistics of the ground delays (minutes) assigned to the non-exempt flights per newly assigned flow.
Flows TOS participation levels Avg. SD Median Max. N North 0% TOS 4.9 7.4 2.5 42.8 84 25% TOS 11.0 8.4 11.4 32.8 109 50% TOS 19.2 13.0 19.3 47.8 113 75% TOS 20.7 11.6 23.1 46.6 118 100% TOS 21.6 11.0 25.3 45.7 118 South 0% TOS 4.7 6.3 2.7 38.9 144 25% TOS 3.8 4.3 2.3 17.7 152 50% TOS 12.6 8.1 11.9 38.9 179 75% TOS 19.3 10.0 20.3 40.3 185 100% TOS 21.3 10.1 22.3 37.9 186 West 0% TOS 102.3 39.4 114.1 153.1 147 25% TOS 80.1 28.4 93.5 107.1 117 50% TOS 48.9 23.0 54.2 78.0 83 75% TOS 27.7 9.3 28.2 47.3 76 100% TOS 26.0 8.9 27.0 38.1 75
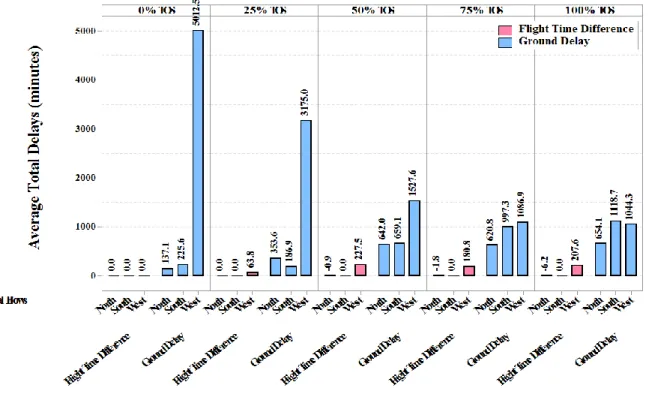
The overall reduction in ground delay assignment was accompanied by an increase in flight times, since the CTOP allocation algorithm assigns best available TOS option for flights that have submitted multiple trajectory options, which can involve a longer route. Figure 7 presents the average total (i.e. the sum of all the flight time difference induced) flight time per originally scheduled flow that were observed in the different TOS participation level conditions. The flight time difference was computed by subtracting the newly assigned route’s flight time from the originally submitted flight plan’s flight time. Figure 7 also shows the average total ground delays per originally scheduled flow that were observed in the different TOS participation level conditions.
Figure 7. The average total flight time difference (minutes) and the average total ground delay (minutes) assigned to the non-exempt flights.
11
For the 0% TOS participation level condition, there were no reroute options submitted by flight operators, hence, no flight time differences. For 25%, 50%, 75%, and 100% TOS participation levels, the average total flight time difference increased as more weather-impacted west flow aircraft were rerouted to the other flows. On the other hand, the average total ground delay decreased as more weather-impacted west flow aircrafdt were rerouted.
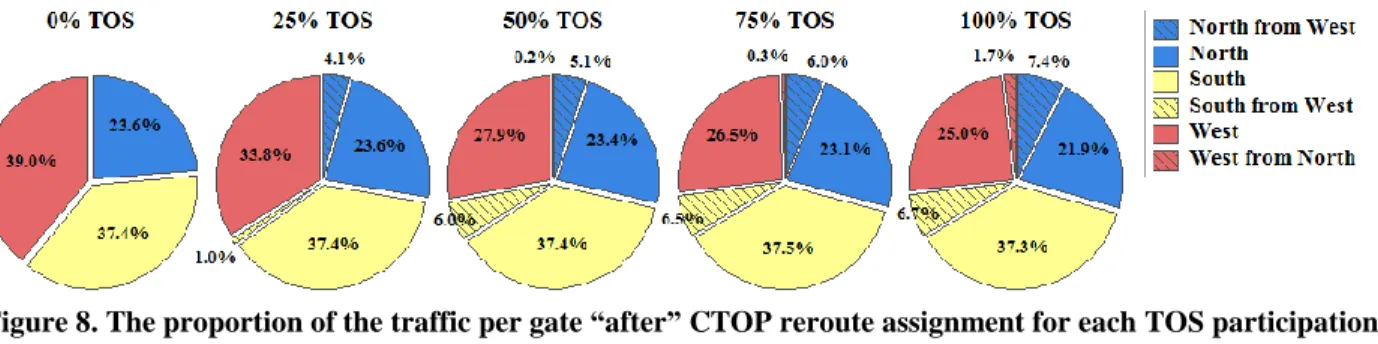
Figure 7 also shows some flight time differences with negative values, since the preferred route submitted as the initial flight plan was not always the fastest route. Hence, there were cases when, for example, an aircraft originally scheduled for the north gate might be rerouted to the west gate as slots became available. Such behavior can be seen in Figure 8, which shows how the distribution of assigned traffic demand per flow changed with TOS participation level changes.
Figure 8. The proportion of the traffic per gate “after” CTOP reroute assignment for each TOS participation levels (0%, 25%, 50%, 75% and 100% TOS).
As more aircraft submitted TOSs, the traffic demand assigned to the west flow met its capacity of 12 aircraft per hour, which was approximately 27% of the target arrival rate of 44 aircraft per hour at the airport. This was particularly noticeable at 50% TOS participation levels and above, suggesting that at 50% participation, enough west flow aircraft submitted reroute options that CTOP could effectively relocate capacity-exceeded demand to the north or south flows. However, considering that the delay distribution does not even out until the 75% TOS participation levels, the desired participation level could be somewhere between 50% and 75% for this scenario, depending on which metric is more critical.
B.1.2. Arrival Throughput
In order to evaluate whether the available airport capacity was fully utilized, the estimated throughput based on CTOP-assigned demand distribution was compared across the different TOS participation levels. The simulation scenario was designed to have the traffic demand ramp up at the beginning of the run, and drop off towards the end. Hence, the data was segmented into three separate intervals, as shown in Figure 9.
Figure 9. Arrival throughput
12
Figure 9 shows the airport arrival throughput for the different TOS participation levels. The elapsed time (hours) is measured from the earliest aircraft scheduled arrival time, then the cumulative throughput data was partitioned into intervals to separate the ramp-up and drop off segments of the problem. As the figure shows, it took longer to land all of the traffic in the lower TOS participation level conditions. This was because fewer aircraft on the west gate had alternative reroute options, and could not be rerouted to the other gates.
The linearity assumptions were met for the interval from 1 hour to 3.5 hours of the elapsed time, where the steady throughput rates were observed. The linear lines were fitted for the selected segment of the data (indicated by the blue color in Figure 9). The slopes (estimated hourly throughput) of the selected segments were found to be 42.1, 43.3, 44.2, 44.8, and 44.3 per hour for 0%, 25%, 50%, 75%, and 100% TOS participation level conditions respectively. In the tested scenario, there was sufficient demand initially scheduled for the north and south flows that the throughput was relatively high even at low TOS participation levels.
However, the slopes of the segmented data were still found to be significantly different (p < 0.05), the lowest throughput observed in the 0% TOS participation conditions, indicating that higher TOS participation help utilize the available capacity at the airport, which had been established at 44 aircraft per hour maximum.
B.2. Impact of different TOS participation levels from the flight operator’s perspective
Another hypothesis of the study was that CTOP-rerouted flights would not only improve system performance, but benefit directly through a reduction in their CTOP-assigned delay. This is a direct consequence of TOS algorithm’s selection process, which assigns each flight its lowest cost trajectory option.
B.2.1. Assigned Delays to the TOS submitted aircraft
Although feasible trajectory options may be available for many flights in a given problem (i.e., they are “TOS candidates”), not all will submit TOSs. The tested scenario included a total of 195 aircraft. Approximately 70 of these were exempt from the CTOP because they were already airborne or close to departure when the CTOP was initiated. This number varied slightly between runs since aircraft became exempt as they approached their departure time. The non-exempt traffic included 84-89 “TOS-candidates” and 37-39 “non-candidates” who had no geographically feasible trajectory options. Approximately 51.3% of the TOS-candidate aircraft were west flow and 48.7% of non-candidate aircraft were north or south flow. To create the desired participation level for each run, an appropriate number of TOS-candidates were randomly selected as the aircraft that would submit TOSs. In order to demonstrate how increased participation by TOS-candidate aircraft can both improve overall operations and benefit those particular flights, ground delays assigned to the TOS-candidate sub-group were analyzed for all participation levels, and also compared to the non-candidate aircraft.
Table 3. Ground delays (minutes) assigned to the TOS submitted vs. TOS “not” submitted.
TOS Participation
Levels
TOS-candidates
TOS non-cadidates TOS submitted TOS “not” submitted
Avg. SD Median Max. N Avg. SD Median Max. N Avg. SD Median Max. N 0% TOS - - - - 0 59.3 57.5 31.0 153.1 260 6.2 8.0 3.6 42.8 115 25% TOS 6.1 7.4 3.8 32.8 64 49.7 43.1 39.1 107.1 197 8.2 6.6 8.0 21.4 117 50% TOS 15.1 15.7 11.9 75.0 133 34.9 24.3 27.7 78.0 127 17.8 11.3 17.8 45.7 115 75% TOS 20.9 10.1 23.5 46.6 206 27.1 10.7 27.8 47.3 56 19.5 11.4 21.3 43.9 117 100% TOS 22.8 10.1 25.1 40.5 263 - - - - 0 21.4 10.7 24.4 45.7 117
Table 3 above summarizes the statistics of the ground delay assigned to the TOS submitted group and the TOS “not” submitted group, regarding the impact of the TOS participation levels. A Mann-Whitney U-test was conducted to determine if there were differences in ground delay assigment between TOS submitted and TOS “not” submitted group (for 25%, 50%, and 75% TOS level conditions). Overall, the comparison between TOS submitted (Median = 14.9) and TOS “not” submitted group (Median = 30.7) confirmed that the TOS submitted aircraft received significantly less ground delay than the TOS “not” submitted aircraft (p < 0.05).
However, the results presented in Table 3 indicated that the TOS submitted aircraft received less ground delays when a small number of aircraft submitted TOSs. For instance, when only 25% of the TOS candidates submitted alternative routes, the TOS submitted aircraft received the least ground delays. On the other hand, the ground delay assigned to the TOS “not” submitted aircraft were reduced as more aircraft submitted TOSs. The majority of both the TOS submitted and TOS “not” submitted aircraft were the west gate scheduled aircraft. Hence, as more aircraft were rerouted out of the west gate with more TOS-candidates submitting TOSs, the induced delays due to the
13
capacity/demand mismatch was alleviated and helped the TOS “not” submitted aircraft to receive less ground delay as well.
Table 3 also contains ground delays assigned to the non-candidate group for all participation levels. The results showed that more aircraft submitting TOSs affected the delay received by the non-candidate aircraft. Such outcomes were expected because the majority of the TOS-candidates were from the west flow, while most of the non-candidates originated from the north or south. Hence, as more aircraft were submitting TOSs, and moving to the north or south, the ground delays assigned to the non-candidate aircraft were observed to be increasing and the impact of the TOS participation levels on the ground delays assigned to the non-candidates group were found to be significant (H = 165.8, p < 0.05).
B.2.2. Delays Saving Achieved by the Reroute Assignment
Even if the TOS-candidate aircraft submitted TOSs, not necessarily all the aircraft would be assigned with TOS reroute. Table 4 below presents the ground delay assigned to the TOS reroute asigned aircraft and the TOS reroute “not” assigned aircraft in respect to the different TOS participation levels. It shows that TOS reroute assigned group (Median = 12.2) received significantly less ground delay than the TOS reroute “not” assigned (Median = 25.0) (p < 0.05). However, such reduction in ground delay by receiving the reroute was based on the preference indicated by the RTC that considers cost of flight time changes in relation to reduction in ground delays. The coresponding average flight time increase for the TOS reroute assigned aircraft can be seen in Table 5.
Table 4. Ground delays (minutes) assigned to the TOS reroute assigned vs. TOS reroute “not” assigned.
TOS Participation Levels
TOS submitted
TOS reroute assigned TOS reroute "not" assigned Avg. SD Median Max. N Avg. SD Median Max. N 0% TOS - - - - 0 - - - - 0 25% TOS 5.1 6.2 3.3 21.0 30 7.0 8.3 3.8 32.8 34 50% TOS 8.4 7.9 6.1 26.2 66 21.7 18.5 15.5 75.0 67 75% TOS 15.9 10.5 15.9 38.7 75 23.9 8.7 25.6 46.6 131 100% TOS 17.1 11.1 18.6 35.3 92 25.8 8.1 26.8 40.5 171
Table 5 shows how much the CTOP-assigned ground delay was reduced (ground delay savings) for the TOS rerouted aircraft compared to what would have been assigned if each stayed on its original route. It also shows the summary statistics of the associated flight time increase that were associated with the reroutes. There were, on average, 0, 10, 22, 25, and 30.7 aircraft that received TOS reroute assignments during 0 %, 25 %, 50 %, 75%, and 100% TOS submission conditions, respectively.
Table 5. Ground Delay Savings and Flight Time Increase for Rerouted Aircraft, in minutes.
TOS Participation Levels
Ground Delay Saving Flight Time Increase Avg. SD Median Max. Avg. SD Median Max. N 0% TOS - - - 0 25% TOS 79.4 22.6 88.9 101.5 6.4 6.3 5.4 19.1 30 50% TOS 46.2 19.5 48.1 78.1 10.3 8.5 8.3 30.6 66 75% TOS 21.9 14.7 17.5 62.1 7.2 8.3 6.5 30.6 75 100% TOS 19 13.9 15 64 6.6 8.4 6.4 30.6 92
The impact of TOS participation levels on the ground delays saving was found to be significant (H = 126.1, p < 0.05). Individual ground delay savings decreased as more aircraft submitted TOSs and were rerouted, which would be expected as those “savings” are distributed across an increasing number of flights. Although the flight time difference across the different TOS participation levels was found to be significantly higher (H = 11.0, p < 0.05), the difference was not correlated to the different participation levels (ρ = - 0.1, p = 1.5).
14 B. Discussion
The study demonstrated that the CTOP operations can be more effective in allocating demand to capacity-constrained resources when more aircraft submit multiple option TOSs. Results showed increasing reduction and redistribution of ground delay when more flights were available to reroute to the north or south gates, and away from west gate, whose capacity was reduced to 12 flights per hour due to weather. When few or no aircraft were available to reroute, the observed throughput at the airport fell below its capacity of 44 flights per hour. When TOS participation reached 50% however, there were a sufficient number of aircraft with the reroute options that the target throughput was achieved. As TOS participation continued to increase, the ground delay across the three flows evened out for 75% and 100% TOS participation levels. Demand reallocation resulted in some additional flight time for the aircraft that were rerouted but at a considerable savings in the ground delay. However, it was found that unlike the airport throughput or ground delay distribution, flight time difference was not affected by TOS participation levels.
The findings from the study also confirmed that submitting alternative routes helped each individual aircraft to receive the reduced delays according to their preferences. The observed reduction in ground delay for each rerouted flight was greatest when only a few flights submitted reroute options, suggesting significant incentive for the early adopters for the TOS participation. The ground delay savings for the individual aircraft was gradually reduced as more aircraft were rerouted because the overall system performance improved as more aircraft submitted multiple route options; this left less total delay to be saved by receiving reroutes. Furthermore, the results of the direct comparison between the TOS submitted aircraft and the TOS “not” submitted aircraft confirmed that the TOS submitted received significantly less ground delay than the TOS “not” submitted aircraft, although the difference between the two groups is most pronounced in the low TOS participation levels, in which most flights that submit a TOS end up getting their alternate routes and the associated ground delay savings.
IV.
Conclusions
After evaluating the second phase of the IDM concept development, it was concluded that more participation in CTOP by submitting TOSs can improve the overall TFM performance by allocating traffic demand to more available resources. In this study, even the small number of aircraft that were rerouted to reallocate the capacity, improved the overall system performance. However, it was concluded that a sufficient number of aircraft with reroute options were required in order to achieve an efficient and effective reallocation of the traffic demand. The reallocation reduced the overall delays in the system as well as the extreme delays experienced by flights on the impacted flow, and helped achieve the desired throughput at the final destination.
It was also observed that the amount of delay saved by each aircraft with a TOS submission varied depending on how many other aircraft were submitting TOSs. However, regardless of the level of TOS participation, it was found that the aircraft that participated in submitting TOSs benefitted by receiving less delay according to their specified RTC value. In addition, they benefitted from the improvement in the overall system performance by having other aircraft submitting TOSs.
The study presented in this paper was conducted with one representative CTOP user. A subsequent study7 explored the human factors aspect of the different user interactions with the CTOP GUI, and evaluated the impact of different user strategies on overall TFM performance. This paper includes suggestions for potential CTOP enhancement to improve both the CTOP user experience and system performance.
In the second phase of the IDM concept, the multiple FCAs were co-located only at the airport to control the airport capacity constraints with the flow restrictions at multiple gates simultaneously. Future IDM concept development will further explore CTOP operations with additional FCAs located en route upstream of the airport. Furthermore, exploration of operations with multiple TMIs, including AFPs and possibly another CTOP, could be conducted to investigate how the CTOP interacts with other TMIs to resolve TFM problems with inter-dependent concurrent constraints. Moreover, due to the strategic nature of the planning time horizon of the CTOP, it faces the challenge of planning based on uncertain predictions. There is a function within the CTOP, called ‘automatic revision’ that is designed to address such challenges; it adaptively revises the plan with continuous updates on traffic demand. However, such a dynamic method of adaptively revising plans should be implemented carefully as it could affect the system’s operational stability. Hence, the potential issues associated with use of the ‘automatic revision’ function need to be examined.
15
Acknowledgments
The authors would like to thank all the subject matter experts who shared their invaluable inputs to the concept development. The authors would like to thank Dr. Antony Evans for his help with anlalzying historical flight plan data, and also the lab personnel at the Airspace Operations Lab at NASA Ames Research Center.
References
1Smith, N. M., Brasil, C., Lee, P. U., Buckley. N., Gabriel, C., Mohlenbrink, C. P., Omar, F., Parke, B., Speridakos, C., and
Yoo. H., "Integrated demand management: Coordinating strategic and tactical flow scheduling operations." 16th AIAA Aviation Technology, Integration, and Operations Conference, 2016, pp. 4221.
2Yoo, H., Connie Brasil, Nancy M. Smith, Paul U. Lee, Christoph Mohlenbrink, Nathan Buckley, Al Globus, and Gita Hodell.
"Integrated Demand Management (IDM)-Minimizing Unanticipated Excessive Departure Delay while Ensuring Fairness from a Traffic Management Initiative." In 17th AIAA Aviation Technology, Integration, and Operations Conference, 2017, pp. 4100.
3Yoo, H., Mohlenbrink, C. Connie Brasil, Nathan Buckley, Al Globus, Nancy M. Smith, and Paul U. Lee. "Required time of
arrival as a control mechanism to mitigate uncertainty in arrival traffic demand management." In 35thIEEE/AIAA Digital Avionics Systems Conference (DASC), 2016, pp. 1-9.
4Klopfenstein, Mark, Namita Arora, and Pierrick Burgain. "Concept for User-Preferred Traffic Flow Management Merging
Two Flight Prioritization Concepts." In 12th AIAA Aviation Technology, Integration, and Operations (ATIO) Conference and 14th AIAA/ISSMO Multidisciplinary Analysis and Optimization Conference, 2012, pp. 5543.
5Kim, A., Hansen, M., "A framework for the assessment of collaborative en route resource allocation strategies."
Transportation Research Part C: Emerging Technologies, Vol. 33, 2013, pp. 324-339.
6Evans, A. D., and Lee, P.U., "Analyzing Double Delays at Newark Liberty International Airport." In 16th AIAA Aviation
Technology, Integration, and Operations Conference, 2016, pp. 3456.
7Hodell, G. Yoo, H., Brasil, C., Buckley, N., Kalush, S., Lee, P.U., Smith, N.M., Evaluation of Multiple Flow Constrained
Area Capacity Setting Methods for Collaborative Trajectory Options Program. In 37th IEEE/AIAA Digital Avionics Systems Conference (DASC), 2018.
8Conde Rocha Murca, M., DeLaura, R., Hansman, R.J., Jordan, R., Reynolds, T. and Balakrishnan, H., Trajectory clustering
and classification for characterization of air traffic flows. In 16th AIAA Aviation Technology, Integration, and Operations Conference, 2016, pp. 3760.
9Bombelli, A., Segarra Torne, A., Trumbauer, E. and Mease, K.D. “Automated route clustering for air traffic modeling”. In
AIAA Modeling and Simulation Technologies Conference. 2017, pp. 1318.
10Jones, James C., and Richard DeLaura. "Predicting Airport Capacity in the Presence of Winds." In 17th AIAA Aviation
Technology, Integration, and Operations Conference, 2017, pp. 3595.
11Eshow, Michelle M., Max Lui, and Shubha Ranjan. "Architecture and capabilities of a data warehouse for ATM research."
In 33rd IEEE/AIAA Digital Avionics Systems Conference (DASC), 2014, pp. 1E3-1.
12Prevot, T., Lee, P.U., Callantine, T., Mercer, J., Homola, J., Smith, N.M., Palmer, E., "Human-in-the-loop evaluation of
NextGen concepts in the Airspace Operations Laboratory.” AIAA Modeling and Simulation Technologies Conference, 2010, pp.7609.