Original Research Paper
A case study on multi-lane roundabouts under
congestion: Comparing software capacity and
delay estimates with field data
Xuanwu Chen
a,*, Ming S. Lee
baDepartment of Civil and Environmental Engineering, Florida International University, Miami, FL 33174, USA b
Issaquah, WA 98029, USA
a r t i c l e i n f o
Article history:Available online 19 March 2016
Keywords: Multi-lane roundabout Roundabout performance Capacity Delay Queue length Traffic simulation
a b s t r a c t
Existing studies on modern roundabouts performance are mostly based on data from singe lane roundabouts that are not heavily congested. For planners and designers interested in building multilane roundabouts for intersections with potential growth in future traffic, there has been a lack of existing studies with field data that provide reference values in terms of capacity and delay measurements. With the intent of providing such reference values, a case study was conducted by using the East Dowling Road Roundabouts in Anchorage, Alaska, which are currently operating with extensive queues during the evening peak hours. This research used multiple video camcorders to capture vehicle turning movements at the roundabouts as well as the progression of vehicle queues at the roundabout entrance approaches. With these video records, the number of vehicles in the queues can be accurately counted in any single minute during the peak hours. This study shows that unbalanced entrance flow patterns (i.e., one entrance has significant higher flow than others) can intensify the queue and delay for the overall roundabouts. Then various software packages including RODEL, SIDRA and VISSIM were used to estimate several performance measurements, such as capacity, queue length, and delay, compared with the collected field data. With the comparison, it is found that all the three software packages overestimate multi-lane roundabout ca-pacity before calibration. With default parameters, SIDRA and VISSIM tend to underes-timate delays and queue lengths for the multi-lane roundabouts under congestion, while RODEL results in higher delay and queue length estimations at most of the entrance approaches.
©2016 Periodical Offices of Chang'an University. Production and hosting by Elsevier B.V. on behalf of Owner. This is an open access article under the CC BY-NC-ND license (http:// creativecommons.org/licenses/by-nc-nd/4.0/).
*Corresponding author. Tel.:þ1 305 348 1393.
E-mail addresses:[email protected](X. Chen),[email protected](M. S. Lee). Peer review under responsibility of Periodical Offices of Chang'an University.
Available online at
www.sciencedirect.com
ScienceDirect
journa l hom epage: www.elsevier.com /locate/jtte
http://dx.doi.org/10.1016/j.jtte.2016.03.005
2095-7564/©2016 Periodical Offices of Chang'an University. Production and hosting by Elsevier B.V. on behalf of Owner. This is an open access article under the CC BY-NC-ND license (http://creativecommons.org/licenses/by-nc-nd/4.0/).
1.
Introduction
The number of modern roundabouts in the U.S. has signifi-cantly increased in the last decade (Robinson et al., 2000). Success stories from early applications of roundabouts in Europe and Australia led many communities to embrace roundabouts as a preferred alternative for intersection control (Jacquemart, 1998). It can be anticipated that the number of roundabouts will continue to increase in the era of energy consciousness. Compared with signalized intersections, roundabouts require no energy to operate except for lightings in the dark (Roundabout Benefits, 2010). As interests in roundabout applications continue to increase, researchers have raised questions about the effectiveness of existing analytical tools for roundabout planning and design in the U.S. Currently, practitioners rely on studies and software packages from other countries (e.g., United Kingdom and Australia) when designing and analyzing roundabouts. Since roundabout performance is believed to be sensitive to local conditions, such as geometric designs, driving rules (i.e., left-hand drive, right-hand drive, etc.), and driver behaviors, questions about the appropriateness of the applications of international studies and practices in the U.S. have come to the surface.
The National Cooperative Highway Research Program (NCHRP) addressed this issue in 2007 in its Report 572, which describes a comprehensive study of roundabout operational and safety performance in the U.S. The report discussed the appropriateness of the foreign studies under the U.S. condi-tions (Rodegerdts et al., 2007). However, the conclusions were limited since there were not sufficient data from roundabouts operating at capacity. Few roundabouts in the U.S., particularly multi-lane roundabouts, were identified as operating at capacity when the study was conducted. Recently, two multi-lane roundabouts named Dowling roundabouts were found operating at capacity for a period of time during the PM peak hours. They provide an opportunity to fill the gap in NCHRP Report 572 on analysis of roundabouts operating at capacity.
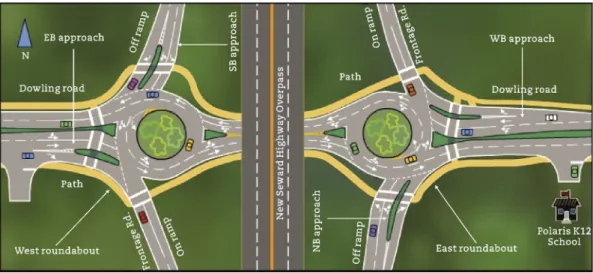
Dowling roundabouts, the first multi-lane roundabouts in Alaska, were completed in 2004 at the ramp terminals of the East Dowling Road and New Seward Highway interchange in the city of Anchorage. Those roundabouts consist of two
“teardrop”roundabouts of two inside circulating lanes in a
“dumbbell”arrangement (Fig. 1), connected to each other by a roadway segment of approximately 200 feet under the New Seward Highway. There are four entrances to Dowling roundabouts: 1) Eastbound (EB) entrance at the west roundabout; 2) Westbound (WB) entrance at the east roundabout; 3) Southbound (SB) entrance at the west roundabout; and 4) Northbound (NB) entrance at the east roundabout. As can be seen inFig. 1, the lane is the left-turn only lane at the NB entrance approach of the east roundabout and the SB entrance of the west roundabout. At the WB approach of the east roundabout and the EB approach of the west roundabout, entering lanes can be utilized through movements.
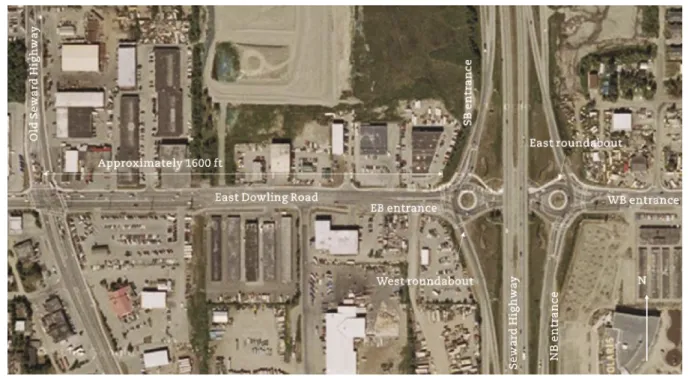
Currently, during most of the day, the Dowling round-abouts are operating smoothly without noticeable delay at the entrance approaches. However, for approximately 15e20 min during the evening peak hours (i.e., from 5 p.m. to 6 p.m.), the roundabouts are operating with queues of more than 5 vehi-cles at three of the four entrance approaches (i.e., EB, SB, and NB) during the entire capacity-saturated period. At the EB entrance approach, the queue can reach for over 1600 feet (Fig. 2). The spill back blocking the upstream signalized intersection between the Old Seward Highway and East Dowling Road are clearly observed (Fig. 3).
The Dowling roundabouts, completed after the data collection for the NCHRP research, offer much needed op-portunity to traffic engineers to study the performance char-acteristics of congested multi-lane roundabouts in the U.S., and to see how the performance measurements estimated by software applications compare with the results in the field under congestion. The purpose of this paper is to describe such a research effort.
Video cameras were used to record the roundabout turning movements and queue progression at the entrances during the entire PM peak hours. With the collected data, typical
roundabout performance measures such as turning move-ments, approach capacity, average queue length, and delay were extracted from the video records. The data with three popular software packages, RODEL, SIDRA, and VISSIM were analyzed. The field-measured delay and queue length were compared with the estimations from the three software packages and other available roundabout design guides.
2.
Review of existing studies
Roundabout performance analyses usually consider two as-pects: 1) entrance capacity, 2) operational performance mea-sures (Robinson et al., 2000). Entrance capacity, which is expressed as the maximum flow rate from an entrance
approach, concerns the number of vehicles that can be accommodated at a roundabout. Entrance capacity is strongly associated with circulating flow rate, which is the number of vehicles traveling inside the roundabout during the analysis period. On the other hand, operational performance measures, such as delay and queue length, gauge the effectiveness of roundabout service for users.
In literature, methods for capacity estimation can be divided into two groups: regression model (Crown, 1987; Flannery et al., 2005; Hosseen and Barker, 1988; Kimber, 1980) and gap-acceptance model (Akc¸elik, 2003, 2004, 2007; Chung et al., 1993; Polus et al., 2003; Transportation Research Board, 2000; Wu, 2006). The regression model develops regression relationships between circulating flow rate and the capacity at each entrance approach, using capacity as the dependent variable and circulating flow rate as the independent variable. Parameters of the regression models are estimated with traffic flow data collected from actual roundabouts. The software package RODEL, developed by RODEL Software Ltd and Staf-fordshire County Council in the U.K., represents a typical regression model for roundabout capacity estimation (Rodel Software Ltd and Staffordshire County Council, 2002; Eisen-man et al., 2004).
Gap-acceptance model estimates capacity at the entrance approach based on gap-acceptance theory, in which a gap is the headway between two consecutive vehicles circulating in roundabout. In the gap-acceptance theory, a driver who wants to enter the roundabout from an approach needs a gap that is large enough for him/her to enter the roundabout safely. In this context, critical headway and follow-up headway are two major parameters determining the capacity in gap-accep-tance model. More specifically, critical headway is the mini-mum gap accepted by the drivers entering the roundabout from an entrance. Therefore, any gap larger than the critical headway will be accepted, and any gap smaller than the
Fig. 2eAerial view of Dowling roundabouts (Google maps®).
Fig. 3ePicture showing the queue from the eastbound entrance approach blocking the upstream intersection on old Seward Highway and East Dowling Road.
critical headway will be rejected by the drivers at that entrance. In terms of follow-up headway, it is the headway between two consecutive vehicles that enter the roundabout using the same gap under a queued condition. SIDRA, the most often used gap-acceptance model developed by the Akcelik&Associate in Australia, estimates the approach ca-pacity at a roundabout by calculating how many gaps larger than the critical headway appear in the circulating flows and how many entering vehicles are able to enter the roundabout in those gaps according to the follow-up headway (Akc¸elik, 2003; Akcelik&Associates Pty Ltd, 2007).
In addition to regression models and gap-acceptance models, microscopic simulation can also be used to evaluate roundabout performance (Bared and Edara, 2005; Oketch et al., 2004; Trueblood and Dale, 2003; Vaiana et al., 2007). Micro-scopic traffic simulation model simulates and tracks every entity of reality individually, such as, vehicles, trains, pedes-trians, etc. For vehicular traffic, microscopic simulation imi-tates vehicle performance based on car following and lane changing logic. For example, VISSIM, a microscopic simula-tion model developed by PTV Planung Transport Verkehr AG from Germany, uses the Wiedemann's 1974 driver behavior model (Karlsruhe, 2008) to simulate interrupted flows, such as stop-sign control, roundabout, and signalized intersections. This driver behavior model postulates that a driver accelerates and decelerates according to the speed of the vehicle traveling in front of his/hers. When and how the drivers will accelerate or decelerate are based on their individual perception threshold to speed and spacing. The values of the individual speed and spacing thresholds are distributed stochastically in VISSIM.
The NCHRP Report 527 compared roundabout perfor-mance measures estimated by RODEL and SIDRA with field data collected from multiple roundabouts in the United
States. It concluded that both models overestimated field-measured capacities and underestimated field-field-measured delays (Rodegerdts et al., 2007). However, the NCHRP study only included data from single-lane roundabouts. Another known limitation of this effort is that the data were collected from roundabouts that did not have extensive queues at the entrance approaches like at the Dowling roundabouts. In addition, the actual queue progression at the entrances could not be captured by the omni-directional camera that was mounted in the center of the roundabouts and used for data collection in the NCHRP study. Instead, approximations of queue lengths and delays were used in the analysis.
Moreover,Bared and Edara (2005)simulated roundabouts with VISSIM and concluded that the results from VISSIM were comparable with the U.S. field data. The simulation results in their studies had been compared with RODEL and SIDRA outcomes, and the simulated roundabout capacities were found noticeably lower than the estimated capacities in RODEL and SIDRA.
3.
Field measurements
3.1. Video recording
Because the movement of traffic on Alaska roadways can be very different under winter and summer operating conditions, Dowling roundabouts operations were videotaped for three consecutive weekday evenings under representative winter and summer conditions. Winter data collection was con-ducted on three consecutive weekdays in 2008: Wednesday, Dec. 17; Thursday, Dec. 18; Friday, Dec. 19. Summer data collection was conducted on Tuesday (May 12), Wednesday
(May 13), and Thursday (May 14) in 2009. After reviewing the videos, the evening peak hours at the Dowling roundabouts operations were identified from 4:45 p.m. to 5:45 p.m. in winter and from 5:00 p.m. to 6:00 p.m. in summer. Queues were clearly observed during those evening peak hours.
Because of the extensive length of the EB entrance queue, it is not possible to use an omni-directional camera to capture both the roundabout turning movements as well as queue progression. A video data collection scheme was developed by using regular digital camcorders to capture not only the
Fig. 5eSnapshot of video images recorded by camcorders in summer. (a) Image 1. (b) Image 2. (c) Image 3. (d) Image 4. (e) Image 5. (f) Image 6. (g) Image 7. (h) Image 8. (i) Image 9. (j) Image 10.
turning movements but also the back of queue. The data collection scheme was improved in the summer according to our winter observation. The camcorder locations for both winter and summer data collection are shown inFig. 4.
In winter data collection, only six camcorders were instrumented. Two camcorders (camcorders A and B) were mounted at vantage points of approximately 15e20 feet above traffic level (that is on the high ground by the Seward High-way) to record the circulating and entering vehicles at both roundabouts. Other camcorders (camcorders Q, R, S, and T) were mounted at individual queued approaches to record the back of queue. It is noted that the WB entrance approach of the east roundabout never had queue of more than 5 vehicles during any minute of the evening peak hours.
During the winter data collection process, several prob-lems were identified. Firstly, during a short period of time, the back of the EB queue was not able to be captured clearly using camcorder T at approximately 920 feet from the stop line of the EB entrance approach. The queue occasionally passed the location of the camcorder T in winter. As a result, our data collection team had to spin the camcorder from facing the east to facing the west with an attempt to capture the back of queue. Nonetheless, the back of queue in winter was deter-mined approximately according to the reference points, such as utility pole, commercial billboard, and so on, while it passed the location of the camcorder T. Secondly, the first camcorder S to record the queue was mounted at 676 feet far from the stop line of the EB entrance. The quality of the video was not satisfactory due to the deficient lighting condition at the site. Thirdly, same problem was found on capturing the queue progression between camcorders T and S. Lastly, camcorders Q and R were also needed to be turned occa-sionally to record the back of queue at NB and SB entrances.
After reviewing the winter videos and data, we decided to use more camcorders to capture the detailed queue progres-sion. The data collection in summer utilized a total number of 17 camcorders. Similar to winter data collection, camcorders A and B mounted on high ground recorded all circulating and entering vehicles at both roundabouts. For each queued approach, a camcorder was mounted at 100e200 feet intervals in order to fully capture queue progression for its entire length. For the EB approach with the longest queue, a total of eight camcorders were used to cover a 1600-foot span.
Fig. 5is a snapshot of the video images recorded by the camcorders in summer. The figure shows that circulating and entering vehicles can be clearly observed from those video images (i.e.,Fig. 5(a) and (b)). The other video images in the snapshot were recorded by camcorders I, J, K, L, M, N, O, and P (Fig. 5(c)e(j)), capturing the back of queue on the EB approach of the west roundabout. A number of traffic cones were placed on the curb at specific locations to indicate the reference points in the video image. The delays and the queue lengths were extracted accurately from those video images that showed the continuous movements of the vehicles in the queues.
3.2. Traffic flow data
Traffic flow data including turning movements, entering flow rates, circulating flow rates, and approach capacities were
extracted from the videos. Especially, approach capacity in this study is defined as the number of vehicles has entered the roundabout when there were persistent queues of more than 5 vehicles at each lane of the approach during the entire analysis time period. Because the purpose of the analysis is to study traffic characteristics, delay, and queue formation at congested roundabouts, traffic flow data used for this analysis are based on the days when queue duration and maximum queue length are the longest in each season. That is, we analyzed the data collected on Dec. 18th, 2008, on which the maximum queue length was the longest of all three winter data collection days. Similarly, the data from May 13th, 2009 was utilized for the summer data analysis.
The results of turning movement measurement are pre-sented inTable 1, which shows that the EB entrance approach of the west roundabout has the highest volume of all three entrance approaches at this roundabout. The high volume at the EB approach of the west roundabout partially explains why the EB queue is the longest of all three queued approaches. Although the volume of the EB entrance approach at the east roundabout is high as well, the conflicting volumes (i.e., volumes of the other entrance approaches) at that roundabout are not as high as those at the west roundabout with respect to its EB entrance approach. It also explains that why the longest queue happens at the EB entrance approach of the west roundabout rather than at the EB entrance approach of the east roundabout. In addition, it is also found that the total movements at both the roundabouts in summer are higher than those in winter. The higher total numbers of movements in summer explain why we observe longer queues at the EB approach of the west roundabout in summer than in winter. Field-measured capacity and circulating flow numbers will be presented with the discussion of software capacity estimation comparison in latter section of this paper.
Table 1eTurning movements at Dowling roundabouts (unit: vehicle per hour).
Season Entering approach
Right-turn Through Left-turn Total
Winter (Dec. 18, 2008) West roundabout WB 0 495 180 675 SB 110 143 640 893 EB 189 922 0 1111 Total 2679 East roundabout EB 0 1305 257 1562 NB 212 119 194 525 WB 199 481 0 680 Total 2767 Summer (May 13, 2009) West roundabout WB 0 581 217 798 SB 116 146 733 995 EB 214 966 0 1180 Total 2973 East roundabout EB 0 1370 3029 1699 NB 194 108 236 538 WB 195 562 0 757 Total 2994
3.3. Delay and queue data
Field-measured queue and delay data include queue length in vehicles and delay in seconds. Delay is the difference between the actual travel time that a vehicle traverses a certain distance and the travel time over the same distance under a free flow condition. To measure the field delay, a vehicle on each lane of a queued approach was randomly sampled for each minute during the evening peak hours. The actual travel time of this sampled vehicle from a point behind the back of the queue to its entering the roundabout (i.e., rear bumper leaving the yield line) was measured. The assumption of traveling at the speed limit was used to calculate the free flow travel time over the same distance. With the delay in seconds measured for all randomly sampled vehicles, the average delay and maximum delay over the 60-min period were calculated. On the other hand, the field-observed queue lengths were measured by counting the number of vehicles in the queue at the time when the sampled vehicle arrived at the back of queue. Average queue length and maximum queue length for all randomly sampled vehicles over the 60-min period were extracted.
Tables 2 and 3summarize the field-measured delays and queue lengths in winter and summer, respectively. The average delay per queued vehicle was derived by dividing the total delay in seconds with total number of queued vehicles. The approach-based measurements inTable 2were created for comparison with RODEL and VISSIM outputs, which were approached-based (the comparison is presented in a later section). The approach-based average delay is the average of the left-lane value and right-lane value. The approach-based maximum delay is the maximum between the left-lane value and right-lane value. Similarly, the average queue of an approach is the sum of the average queue length of the left and right lanes. The maximum queue length of an approach is the sum or the maximum length of the left and right lanes.
By comparing the average delays and average queue lengths of left-lanes with right lanes inTables 2 and 3, at-test was conducted with the null hypothesis indicating that there is no difference between the left-lane and right-lane in terms
of average delays and average queue lengths. With the 95% confidence level, it can be seen that there is no reason to reject the null hypothesis at the NB entrance approach of the east roundabout and the SB entrance approach of the west roundabout, as thep-values are larger than 0.05. In the same words, there is no statistically significant difference between average delays and average queue lengths on the left-lane and those on the right-lane at the NB entrance approach of the east roundabout and the SB entrance approach of the west roundabout. However, at the EB entrance approach of the west roundabout, left-lane average delays are significantly greater than the right-lane average delays in both winter and sum-mer. This is probably because a right-lane vehicle can enter the roundabout on the outside circulating lane, but a left-lane vehicle usually need to cut across the outside circulating lanes to get onto the inside lane of the roundabout. During the same period of time, it is more likely for a right-lane vehicle to find a gap to enter than a lane vehicle. Thus, a vehicle in the left-lane queue is more likely to endure a longer delay than that in the right-lane queue.
The winter average delays and average queue lengths were compared with the summer values at the three entrance ap-proaches, respectively. The results are summarized inTable 4. The average delays and average queue lengths are significantly greater in summer than in winter at the entrance approaches of the west roundabout. On the contrary, they were observed more severe in winter than in summer at the NB entrance of the east roundabout. The higher average delays in winter at the NB entrance were caused by an abnormal situation. In winter, we observed 4 min in which no queued vehicle was able to enter the roundabout from the NB entrance. In summer, only 5 individual minutes had queues of at least 5 vehicles. Based on the field observation, the difference in the number of capacity-saturated minutes between winter and summer was likely due to the lighting and driving conditions in winter. In winter, there is no daylight at 5 p.m. and the pavement condition is less favorable than summer. These winter driving conditions (i.e., short sight distance and long
Table 2eField-measured delays and queue lengths in winter.
Roundabout Approach Measurement Lane-based measurement
t-statistic p-value Approach-based measurement Left Right
East NB Avg delay (s) 135 127 0.49 0.620 131 Max delay (s) 344 266 e e 344 Avg queue (veh) 6 6 0.23 0.820 12 Max queue (veh) 14 13 e e 27 Average delay per queued vehicle (s/veh) 23.90 21.89 e e 22.88 West SB Avg delay (s) 17 18 0.46 0.650 17.5
Max delay (s) 88 83 e e 88 Avg queue (veh) 2 3 0.67 0.510 5 Max queue (veh) 10 11 e e 21 Average delay per queued vehicle (s/veh) 7.32 6.96 e e 7.13 West EB Avg delay (s) 51 35 2.73 0.007 43
Max delay (s) 171 113 e e 171 Avg queue (veh) 8 7 1.17 0.250 15 Max queue (veh) 22 22 e e 44 Average delay per queued vehicle (s/veh) 6.54 5.29 e e 5.97
headway between vehicles) appeared to have made drivers'
average acceptable gap larger than that in summer. Thus, the NB queues dissipated slower in winter than in summer.
4.
Analysis with RODEL, SIDRA, and VISSIM
In this study, three foreign software packages were used: RODEL release 1.9.9 from the U.K., SIDRA version 3.2.2 from Australia, and VISSIM version 5.10 from Germany. For a user to produce capacity and delay estimates that replicate the field operating conditions, these three software packages offer very different calibration capabilities. RODEL does not provide calibration parameters. But users can conduct some degree of calibration through the adjustment of the intercept term of the resultant regression equation. SIDRA version 3.2.2 has two calibration parameters for roundabout performance analysis: environmental factor and entry/circulating flow adjustment. VISSIM has numerous variables for calibration, which can be divided into two groups: driver's behaviors and priority rules. Driver's behavior parameters include car following behavior, lane change behaviors, and so on. Priority rules include min-imum gap time, minmin-imum headway, and so on.
Because one of the purposes of this study is to investigate how accurately the software packages can predict roundabout capacity and delay at the project planning stage. The uncali-brated results from the three software models were compared
with the field data. All the calibration parameters in SIDRA and VISSIM were set as default in this study.
4.1. Capacity estimates
The entry capacity predictions of the three software packages (i.e., RODEL, SIDRA and VISSIM) were compared with the field observations. Predicted/measured entry capacities and circu-lating flows are presented inFig. 6. Each data point of field measurements in the figure was extracted from a capacity-saturated minute in which the queues at the approach were persistently more than 5 vehicles during the entire minute. The number of field data points at each approach depended on the number of capacity-saturated minutes.
RODEL predicted capacities were in the form of linear regression equations and could be directly represented in the figure. Unlike RODEL, SIDRA did not produce regression equations for graphing the relationship between approach capacities and circulating flows. In order to produce capacity estimates at different circulating flow rates, different flow scales were applied to the turning movements of each roundabout. A flow scale was essentially an arbitrary ratio used to proportionally adjust the turning movements for the purpose of forecasting future traffic growth and/or sensitivity analysis. The ranges of flow scales applied to generate the SIDRA capacity estimates were based on the range of field-measured capacities. By applying an appropriate range of flow scales to all turning movements, entering and circulating flow
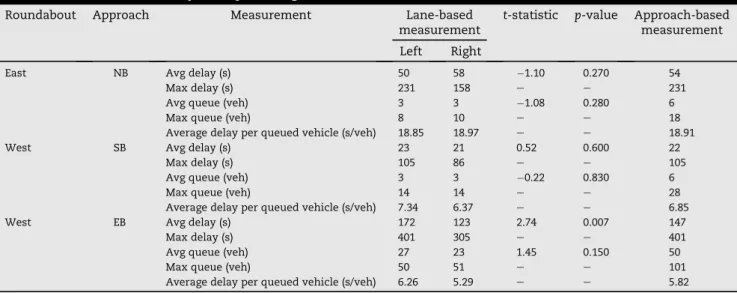
Table 3eField-measured delays and queue lengths in summer.
Roundabout Approach Measurement Lane-based measurement
t-statistic p-value Approach-based measurement Left Right
East NB Avg delay (s) 50 58 1.10 0.270 54 Max delay (s) 231 158 e e 231 Avg queue (veh) 3 3 1.08 0.280 6 Max queue (veh) 8 10 e e 18 Average delay per queued vehicle (s/veh) 18.85 18.97 e e 18.91 West SB Avg delay (s) 23 21 0.52 0.600 22
Max delay (s) 105 86 e e 105 Avg queue (veh) 3 3 0.22 0.830 6 Max queue (veh) 14 14 e e 28 Average delay per queued vehicle (s/veh) 7.34 6.37 e e 6.85 West EB Avg delay (s) 172 123 2.74 0.007 147
Max delay (s) 401 305 e e 401 Avg queue (veh) 27 23 1.45 0.150 50 Max queue (veh) 50 51 e e 101 Average delay per queued vehicle (s/veh) 6.26 5.29 e e 5.82
Table 4eField-measured average delays and average queue lengths at approach in winter and summer.
Roundabout Approach Measurement Winter Summer t-statistic p-value
East NB Avg delay (s) 131.0 54.0 8.58 <0.001 Avg queue (veh) 12 6 7.52 <0.001 West SB Avg delay (s) 17.5 22.0 1.90 0.058
Avg queue (veh) 5 6 1.92 0.056 West EB Avg delay (s) 43.0 147.0 10.79 <0.001
rates of each approach were changed correspondingly. In this way, the capacity estimates at different circulating flow rates were obtained (Fig. 6).
VISSIM model was developed only for the summer study. Due to the extreme weather conditions in Alaska during winter time, it is found that the uncalibrated VISSIM model did not simulate the winter driving behavior appropriately. The VISSIM predicted capacities for an approach were the entering flows per queued minute during which the consec-utive queue on each lane of the approach included no less than 5 vehicles. Because VISSIM queue estimates were approach-based, a queued minute was defined as the minute was which average queue of the approach included no less than 10 vehicles (i.e., 5 vehicles per lane). However, in the uncalibrated model, queued minutes were only identified at the EB approach of the west roundabout. At the NB approach of the east roundabout and the SB approach of the west roundabout, VISSIM predicted average queue for each approach never included more than 4 vehicles during the
analysis period. That may lead to a potential conclusion that VISSIM had less queue length estimation compared with the field data. The VISSIM data points inFig. 6for the NB approach of the east roundabout and the SB approach of the west roundabout were the entering flow rates per minute when there was a persistent queue presented at the approach. However, the assumption of 10 vehicles in the average queues for the entire queued minute can no longer be held for those two approaches. That means the actual capacity estimated by VISSIM may be higher if the assumption holds.
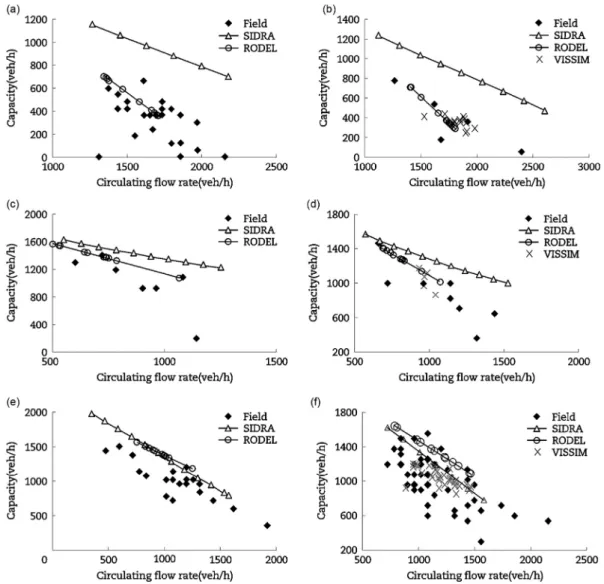
As can be seen fromFig. 6, RODEL model lines seemed to have higher capacity values than the field-measured capacities for the given circulating flow rate range, indicating that RODEL slightly overestimated capacity at studied approaches. However, the slope of RODEL linear regression equations approximately paralleled the decreasing pattern of the field measurements, indicating that RODEL reasonably predicted the rate of capacity reduction for each unit of circulating flow increased.
Fig. 6eApproach capacity estimates comparison among RODEL, SIDRA and VISSIM. (a) NB approach of the east roundabout in winter. (b) NB approach of the east roundabout in summer. (c) SB approach of the west roundabout in winter. (d) SB approach of the west roundabout in summer. (e) EB approach of the west roundabout in winter. (f) EB approach of the west roundabout in summer.
It also can be found from Fig. 6 that SIDRA clearly overestimated the field-measured capacities for the three queued approaches in both winter and summer. SIDRA predicted capacities for the EB entrance approach of the west roundabout were closer to the field data than those for the other two entrance approaches in both seasons. It might indicate that SIDRA performed more reasonable with high demands.
Fig. 6also shows that VISSIM predicted capacities located within the center of the field data clusters, indicating that VISSIM had good capacity estimates for the three entrances in summer. However, since the assumption of 10 vehicles in the average queues for the entire queued minute cannot be held at the NB and the SB entrance approach, the actual VISSIM estimated capacities at those two approaches may be higher than those shown in the figure. It was also noted that the number of VISSIM data points were less than the number of field data points at the EB entrance, as the queued minutes predicted in VISSIM were less than the field observations. The fact was that there were 43 queued minutes observed in the field at the EB entrance approach during the summer evening peak hours, but only 32 queued minutes were identified from the VISSIM output. Thus, it appears that VISSIM underestimate queue lengths of all the three entrance approaches, which will be discussed in the next section.
By comparing the predictions of the three software pack-ages, RODEL's capacity estimates were closer to the field values than SIDRA's at the NB and the SB entrance approach in both winter and summer. For the EB entrance, SIDRA seemed to have slightly better capacity estimations than RODEL. It might indicate that SIDRA worked more reasonable under high-demand conditions. For all the three entrance approach, both RODEL and SIDRA overestimated capacities, but the slope of the RODEL capacity curve appeared to match the field data better than that of SIDRA curve for the NB and the SB entrance approach.
This finding is consistent with NCHRP Report 572, which also concluded capacity overestimation by both RODEL and SIDRA and better slope prediction by RODEL. For the EB approach of the west roundabout, SIDRA capacity estimates appeared to be closer to the field data than RODEL predictions. This result is different from that in NCHRP Report 572. A po-tential reason to explain the difference is that version 3.2.2 of SIDRA software used in this study is newer than version 2.0 used by NCHRP Report 572. According to SIDRA 3.2.2 manual, the capacity model used in version 2.0 was revised in the
newer version. In addition, NCHRP Report 572 did not apply peak hour factors and the percentage of heavy vehicles to the SIDRA model.
VISSIM appeared to have reasonable capacity estimates comparing with the field data. This finding is consistent with the results fromBared and Edara (2005), who also found that the VISSIM predicted capacities were noticeably lower than RODEL's and SIDRA's predictions. However, the thresholds of queued minutes using to extract capacities in VISSIM were significantly lowered at the NB and the SB entrance approach. Thus, the VISSIM“capacities”shown in the figure should be lower than the real VISSIM predictions. Besides, the queued minutes at the EB entrance in VISSIM are less than the field data.
RODEL is known as the regression-based roundabout analysis tool. Its capacity estimate is based on the real-world data that were collected in the United Kingdom. The dissim-ilarity of the driver behaviors in the two countries may lead to different capacity estimates in transportation facilities, such as multi-lane roundabouts. In addition, it's a known fact that roundabouts are more popular in the U.K. and thus users there may be more familiar with driving through roundabouts compared with the roundabout users in the U.S. This is another potential reason that explains why the default RODEL application is found to overestimate the capacity in this study. On the other hand, as discussed earlier, SIDRA estimate ca-pacity with the gap-acceptance model which is complicated and associated with multiple formulas. Therefore, SIDRA is more sensitive to the driver behaviors in nature. Although it is arguable, driver behaviors can be different under congestions compared with those under uncongested conditions, or even at different congestion levels. This is likely the explanation for the variations of SIDRA performances on capacity estimations at different approaches. Lastly, as a micro-simulation soft-ware package, VISSIM has a large number of parameters can be adjusted, for example, minimum gap time, minimum headway, stop line location, acceleration rate, deceleration rate, etc. It is also a known problem that the estimates of performance measures often vary from the field observation when a micro-simulation model is not calibrated.
4.2. Delay and queue length estimates
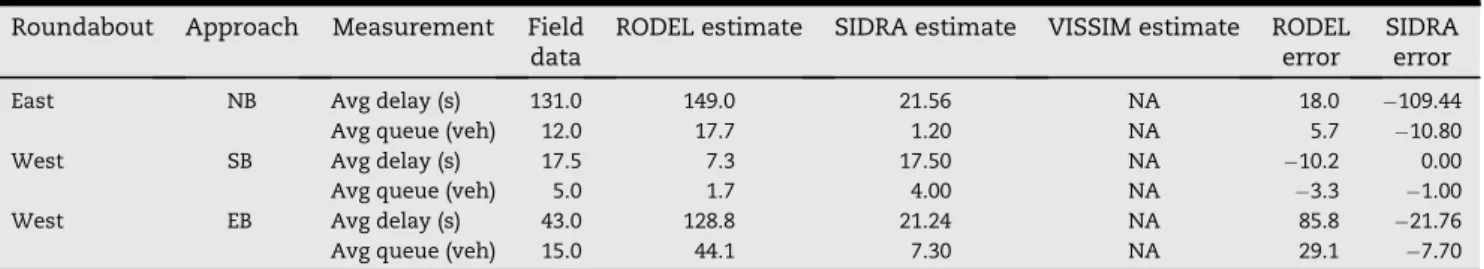
The predicted delays and queue lengths in winter and sum-mer by RODEL, SIDRA and VISSIM are shown inTables 5 and 6. Note that RODEL version used in this study has not yet developed the ability to model the delay and queue length
Table 5eSoftware estimated delay and queue length in winter.
Roundabout Approach Measurement Field data
RODEL estimate SIDRA estimate VISSIM estimate RODEL error
SIDRA error
East NB Avg delay (s) 131.0 149.0 21.56 NA 18.0 109.44 Avg queue (veh) 12.0 17.7 1.20 NA 5.7 10.80 West SB Avg delay (s) 17.5 7.3 17.50 NA 10.2 0.00 Avg queue (veh) 5.0 1.7 4.00 NA 3.3 1.00 West EB Avg delay (s) 43.0 128.8 21.24 NA 85.8 21.76 Avg queue (veh) 15.0 44.1 7.30 NA 29.1 7.70 Note: Error¼software estimatefield data.
when there is a right-turn channel at an entrance approach. Although there is an indirect way to calculate the delay and queue length in RODEL when a right-turn channel presents, we did not apply the method since we want to test the default model. The RODEL estimates shown in this study are thus the results from the models without right-turn traffic. As mentioned earlier, the VISSIM estimates are the results from the simulations of summer operations.
The values inTables 5 and 6show that RODEL generally overestimated the average delays and average queue lengths for most approaches. Those RODEL estimates did not include the delays and queues caused by the right-turn traffic on the right-turn channels if they existed. Thus, in the case that there were delays and queues caused by the right-turn movements, RODEL's overestimation may be greater than the values shown in the tables for all approaches if the right-turn traffic and right-turn channels were modeled.
It is also worth pointing out that RODEL has a larger margin of error for the EB entrance approach at the west roundabout in comparison with the other two entrance approaches in both winter and summer. It indicates that the RODEL esti-mated delays and queue lengths pile up quickly when the volume over capacity (v/c) ratio reaches a certain point (e.g., 0.85). The delays and queue lengths estimates in RODEL are derived from survey data. RODEL calculates the queue lengths by subtracting demands with capacities. However, queue lengths become random and unstable when thev/cratio is high. Additionally, RODEL derives delays based on the flows and the mean queues. Therefore, with limited field data, it is difficult to judge the RODEL performance on delay and queue length estimates.
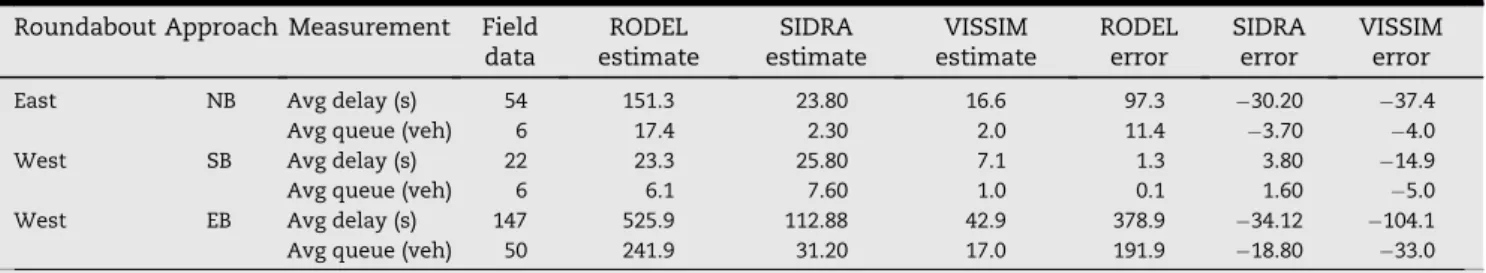
In contrast to RODEL predictions, SIDRA and VISSIM underestimated delays and queue lengths for most ap-proaches, for the reason that those two software packages both overestimated capacities. Variations of VISSIM delay and queue length estimates were higher than those of SIDRA es-timates by comparing the summer predictions. Similarly, more field data are needed to make solid conclusions on the software packages'delay and queue estimates. Nonetheless, the observed differences for the three models used to estimate delays and queue lengths in this study should be valid.
5.
Conclusions
In this study, video recordings of the Dowling roundabouts operation during the evening peak hours in both winter and summer were successfully collected. Compared with the study
conducted for NCHRP Report 572, more cameras were used at each individual capacity-saturated approach. Especially, the arrivals at the back of queue in summer were clearly captured. Uncalibrated models based on the data extracted from the videos were built with RODEL, SIDRA and VISSIM, respectively. Based on the data extracted from the video records, it is found that the extended queue at the EB entrance approach of the west roundabout was a result of the unbalanced flow pattern at the roundabouts, in which the EB entering flow rate was substantially higher than the other three entrance ap-proaches. The unbalanced flow pattern also created a high circulating flow in front of the NB entrance approach of the east roundabout, which explains why this approach had low capacity and high delay and queue values.
After analyzing the results of the three software packages, some conclusions can be reached for the congested flow data collected from the Dowling roundabouts.
When through movements are allowed on both entering lanes, for example, at the EB approach of the west round-about, the vehicles on the inner lane seem to be more difficult to find a gap to enter the roundabout compared with those on the outer lane. Therefore, a vehicle in the left-lane queue is more likely to endure a longer delay than that in the right-lane queue when both right-lanes allow through movements.
RODEL, SIDRA, and VISSIM slightly overestimate the entry capacities.
The version of RODEL applied in this study has not yet developed the ability to directly model the effects of right-turn channels. However, RODEL is found to reasonably predict the rate of capacity reduction as circulating flow increases.
SIDRA seems to have closer capacity estimation on the field data under high-demand condition in comparison with itself under low-demand condition.
VISSIM estimates of performance measures are more sto-chastic with comparison to the other two models since it is a micro-simulation model and thus it is stochastic in nature.
RODEL overestimates the average delays and average queue lengths for most entrance approaches in this study.
RODEL's delay and queue length estimation surges up as the degree of saturation becomes higher than a certain level. That is, higher degrees of saturation seem to result in larger delay variations in RODEL.
SIDRA and VISSIM underestimate delays and queue lengths for most approaches. The margin of error seems random.
Table 6eSoftware estimated delay and queue length in summer.
Roundabout Approach Measurement Field data RODEL estimate SIDRA estimate VISSIM estimate RODEL error SIDRA error VISSIM error
East NB Avg delay (s) 54 151.3 23.80 16.6 97.3 30.20 37.4 Avg queue (veh) 6 17.4 2.30 2.0 11.4 3.70 4.0 West SB Avg delay (s) 22 23.3 25.80 7.1 1.3 3.80 14.9 Avg queue (veh) 6 6.1 7.60 1.0 0.1 1.60 5.0 West EB Avg delay (s) 147 525.9 112.88 42.9 378.9 34.12 104.1 Avg queue (veh) 50 241.9 31.20 17.0 191.9 18.80 33.0 Note: Error¼software estimatefield data.
If data are available for model calibration, SIDRA and VIS-SIM are more adaptable since they both provide calibration parameters. VISSIM can model many roundabouts as well as other types of intersections simultaneously, while RODEL and SIDRA can only be used for one individual roundabout at a time with the version applied in this study. Moreover, VISSIM is capable to model not only the interactions between different roundabouts, but also the interactions of different approaches at a roundabout.
The current study can be improved and expanded in the future as follows. Firstly, due to time limitation, only two days'
flow data at Dowling roundabouts were analyzed. In the future, flow data from more weekdays in both winter and summer can be extracted and analyzed to examine the con-clusions in this study.
Secondly, field-measured gap data including critical headways and follow-up headways have not been extracted. Field gap data will help better assess SIDRA and VISSIM model's appropriateness. With the field-measured gap data, the differences between SIDRA predicted gap parameters and the corresponding field values can be analyzed. The analysis can lead to the explanations of the variations between SIDRA estimates (i.e., capacities, delays, and queue lengths) and the corresponding field data. For VISSIM model, how appropriate the default priority rules are can be examined by comparing the default minimum gap times with field-measured critical headways.
Thirdly, analysis of driver behavior at Dowling round-abouts can be conducted in the future. The driver behavior can include entering speed and lane selections, entering lane selection distance to roundabout, circulating speed and lane position, and so on. That kind of analysis requires the data of individual vehicle behaviors in the whole process from the vehicle traveling at the entrance to its leaving the round-about. Since the video recordings in this study fully captured all vehicular movements of Dowling roundabouts (not only the vehicles moving in the circle, but also the ones traveling at the approach), the required data can be extracted from those video recordings to support the driver behavior analysis.
Lastly, the three software packages can be calibrated to the field data in the future. Analysis can be conducted with the calibrated models to see how well they are capable to estimate performance measures at congested roundabouts in the U.S. Compared with this study different conclusions may be drawn.
Acknowledgments
This work was sponsored by Alaska University Transportation Center (AUTC, No. RR08.08) and Alaska Department of Transportation (AK DOT).
r e f e r e n c e s
Akcelik&Associates Pty Ltd, 2007. SIDRA Intersection User Guide. Akcelik&Associates Pty Ltd, Greythorn.
Akc¸elik, R., 2003. A roundabout case study comparing capacity estimates from alternative analytical models. In: 2nd Urban Street Symposium, Anaheim, 2003.
Akc¸elik, R., 2004. Roundabouts with unbalanced flow patterns. In: ITE 2004 Annual Meeting, Lake Buena Vista, 2004.
Akc¸elik, R., 2007. A review of gap-acceptance capacity models. In: 29th Conference of Australian Institutes of Transport Research (CAITR), Adelaide, 2007.
Bared, J.G., Edara, P.K., 2005. Simulated capacity of roundabouts and impact of roundabout within a progressed signalized road. In: TRB National Roundabout Conference, Vail, 2005.
Chung, E., Young, W., Akcelik, R., 1993. Comparison of roundabout capacity and delay estimates from analytical and simulation models. In: The 16th Australian Road Research Board Conference, Perth, 1993.
Crown, R.B., 1987. Rodel-an alternative approach to roundabout design. Highways&Transportation 34 (10), 12e19.
Dowling Roundabout Diagram, 2010. Available at: http://www. alaskaroundabouts.com/dowling.htm(Date accessed: 28. 01. 2010).
Eisenman, S., Josselyn, J., List, G., et al., 2004. Operational and Safety Performance of Modern Roundabouts and Other Intersection Types. SPR Project C-01e47. New York State Department of Transportation, Albany.
Flannery, A., Jeffrey, P.K., Natarajan, G., et al., 2005. Queuing delay models for single-lane roundabouts. Civil Engineering and Environmental Systems 22 (3), 133e150.
Hosseen, C., Barker, D., 1988. The control of through speed at roundabouts. In: The 14th Australian Road Research Board (ARRB) Conference, Vermont South, 1988.
Jacquemart, G., 1998. Modern Roundabout Practice in the United States. National Acodemy Press, Washington DC.
Karlsruhe, 2008. VISSIM 5.10 User Manual. PTV Group, Karlsruhe.
Kimber, R.M., 1980. The Traffic Capacity of Roundabouts. TRRL LR 942. Transport and Road Research Laboratory, Berkshire.
Oketch, T., Delsey, M., Robertson, D., 2004. Evaluation of performance of modern roundabouts using paramics microsimulation model. In: TAC 2004 Annual Conference, Quebec City, 2004.
Polus, A., Lazar, S.S., Liveh, M., 2003. Critical gap as a function of waiting time in determining roundabout capacity. Journal of Transportation Engineering 129 (5), 504e509.
Robinson, B.W., Rodegerdts, L., Scarbrough, W., et al., 2000. Roundabouts: an Informational Guide. FHWA-RD-00e067. Federal Highway Administration, Mclean.
Rodel Software Ltd and Staffordshire County Council, 2002. Rodel User's Manual. Staffordshire County Council, Staffirdshire.
Rodegerdts, L., Blogg, M., Wemple, E., et al., 2007. Roundabouts in the United States. NCHRP Report 572. Transportation Research Board, Washington DC.
Roundabout Benefits, 2010. http://www.wsdot.wa.gov/safety/ roundabouts/benefits.htm(Date accessed: 28. 01. 2010).
Transportation Research Board, 2000. Highway Capacity Manual. Transportation Research Board, Washington DC.
Trueblood, M., Dale, J., 2003. Simulating roundabouts with VISSIM. In: 2nd Urban Street Symposium: Uptown, Downtown, or Small Town: Designing Urban Streets that Work, Anaheim, 2003.
Vaiana, R., Gallelli, V., Capiluppi, G.F., 2007. Roundabout intersections: analysis for scenarios by micro-simulation. In: 4th International SIIV Congress-Advances in Transport Infrastructures and Stakeholder Expectations, Palermo, 2007.
Wu, N., 2006. Capacity enhancement and limitation at roundabouts with double-lane or flared entries. In: The 5th International Symposium on Highway Capacity and Quality of Service, Yokohama, 2006.