Morales Chan, M., Barchino Plata, R., Medina, J.A.,
Alario-Hoyos, C., Hernández Rizzardini, R. y Roca, M. de la (2018).
Analysis of Behavioral Intention to Use Cloud-Based Tools in
a MOOC: A Technology Acceptance Model Approach.
Journal of Universal Computer Science
, 24(8), pp. 1072-1089
.
DOI:
https://doi.org/10.3217/jucs-024-08-1072
Analysis of Behavioral Intention to Use Cloud-Based
Tools in a MOOC: A Technology Acceptance Model
Approach
Miguel Morales Chan
(Galileo University, Guatemala City, Guatemala [email protected])
Roberto Barchino Plata
(University of Alcalá, Madrid, Spain [email protected])
Jose Amelio Medina
(University of Alcalá, Madrid, Spain [email protected])
Carlos Alario-Hoyos
(Universidad Carlos III de Madrid, Spain [email protected])
Rocael Hernández Rizzardini
(Galileo University, Guatemala City, Guatemala [email protected])
Mónica de la Roca
(Galileo University, Guatemala City, Guatemala [email protected])
Abstract: MOOC students’ adoption of cloud-based tools has the potential to enrich the learning process and enhance the management of knowledge. The aims of this study are to evaluate the behavioral intention to use cloud-based tools in MOOC context, and to explore the factors that influence this intention, based on extended technology of acceptance model (TAM). This paper reports the findings of a case study conducted on the edX platform. Survey data collected from 133 end-users were analyzed by using structured equation modeling (SEM) to validate the causal relationship among the various constructs of the research model proposed. The findings suggested that the perceived ease of use and the perceived usefulness influence the attitude toward the cloud-based tools used in a MOOC.
Keywords: Cloud-based tools, MOOC, Codeboard, technology acceptance model and structural equation modeling
1
Introduction
Massive open online courses (MOOCs) are transforming teaching-learning processes in higher education institutions worldwide [Perez, et al., 16]. In recent years, MOOCs have been spreading and receiving a great deal of attention among the academic community, mainly because this type of methodology provide learners with an unprecedented level of autonomy in the learning process and offer free access to high quality content [Hernández, et al., 14a]. According to a report by Class Central, during 2016, more than 6,850 MOOCs were developed at 700 universities, registering more than 58 million students. Computer science and programming courses represented 17.4% of the courses announced and were the second most demanded courses behind business courses (19.3%) [Shah, 16].
Coding and programming are subjects on the rise; more industries are demanding these types of skills in their employees’ profiles. In addition, rapid technological development, the popularity of MOOCs, and collaboration between technology companies such as Google1, AT&T2 and GitHub3, and MOOC providers such as Udacity,4 which have dedicated themselves to creating specialized academic
programs tailored to a particular career skill set (e.g., nanodegree programs), has brought with it new approaches to learning programming [Spyropoulou, et al., 15]. However, we cannot lose sight of the fact that learning programming is considered a difficult goal to achieve, and programming courses have high dropout rates [Law, et al., 10].
The typical format used for the development of a MOOC is the xMOOC approach, which is remarkably similar to the traditional classroom format, offering video lectures, supporting learning materials (such as reading materials from textbooks or websites, lecture slides and lecture notes, etc.), assignments along with deadlines, discussion forums, and quizzes to validate the knowledge [Morales, et al., 15]. However, to teach programming languages, this type of learning resources may not be a sufficient in some cases. In this sense, the incorporation of cloud-based tools (CBTs), also known as Web 2.0 tools, could enrich the learning process, offering new opportunities in the educational domain.
Today, the universities are increasingly using a wide range of CBTs to support teaching, learning, and assessment process [PDST Technology in Education, 15]. These tools have the potential to be used in a wide range of learning activities. In the case of programming courses, students are able, for example, to interact with one another, analyze and inspect the program code, and produce bug reports. CBTs allow for the exchange of ideas, comments, links to resources, and the reuse of study content in learning environments that can be are managed by the professors and students themselves [Geser, 12]. Most of these tools are freely accessible and provide a diverse and evolving range of possibilities to support and enhance the learning experience. According to Chang, [Chang, et al., 07] the CBTs can interoperate with other systems as virtual learning environment (VLE) or learning management system
1 www.google.com
2 www.att.com 3 www.github.com 4 www.udacity.com
(LMS), offering the possibility to orchestrate services that were previously seen as standalone CBTs, making it easier to use them in education.
Taking into account the above context, the aims of this study is to evaluate the behavioral intention to use CTBs in a MOOC related to computer science and programming, and to explore the factors that influence this intention, based on the technology acceptance model (TAM) [Davis, 89]. TAM explains and predicts user acceptance and the future use of a technology or system [Walker, et al., 12]. This theory was selected because it is widely recognized in research on technology usage in many different contexts [Venkatesh, et al., 00].
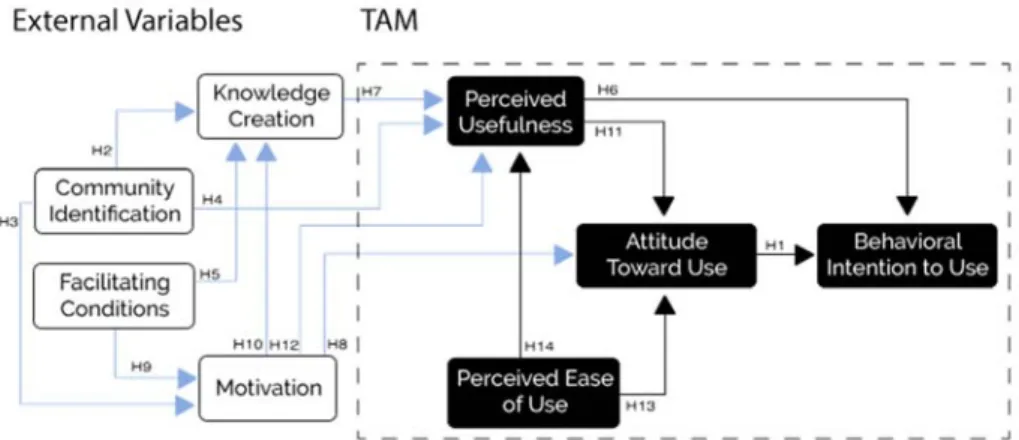
This study proposes an extension of the original TAM by including a special focus on the validation of the relationships involved, perceived usefulness, ease of use, attitude toward use, and behavioral intention to use. In addition, four external variables related to social aspects were defined - community identification, motivation, facilitating conditions and knowledge creation to use - and their validity was examined. In this sense, we used a structural equation modeling (SEM) to test the causal relationship between the different constructs. The following research questions guided our study:
(RQ1) Can learners’ attitude toward CBTs used in MOOCs be influenced by Perceived ease of use and Perceived usefulness?
(RQ2) Do external variables community identification, motivation and knowledge creation influence the Perception of the usefulness of CBTs? To investigate the above, the study is based on the use of a CBT as Codeboard, this Web-based IDE (Integrated Development Environment), it was used to enrich the learning activities of our MOOC, “Java Fundamentals for Android Development” [Morales, et al., 17].
The rest of the paper is structured as follows. [Section 2] describes the theoretical framework for this study. [Section 3] presents the research model and hypotheses proposed. [Section 4] presents the case study used. In [Section 5] the results of the collected data and the proposed model, which were analyzed using SEM, are reported. Finally, this work concludes with the discussion and conclusions sections [Section 6, 7].
2
Study Background
Technology acceptance model (TAM) is derived from the general theory of reasoned action (TRA) [Fishbein, et al., 75]. According to Davis [Davis, 89], TAM suggests that when new users are introduced with a new technology, its usage or adoption can be predicted by three significant factors: Perceived usefulness (PU) of the technology to the user, the Perceived ease of use (PEU), and the Attitudes towards usage (ATU) of the system [Davis, 89]. PU is defined as “the degree to which an individual thinks a system would increase his job performance and productivity”. PEU refers to “the sense of lack of effort an individual requires in order to adopt a given technology” [Venkatesh, et al., 00]
.
TAM models how users come to accept and use a particular technology. Individuals who perceive technology as being easy to use and useful to their workplace will accept it more easily than those who do not [Walker, et al., 12].
In addition, TAM postulates that PU and PEU are affected by external variables. Thus, PU and PEU mediate the effect of external variables on a user’s attitude and behavioral intention, and therefore the actual system use [Alharbi, et al., 14] (See Figure 1).
Figure 1: Original Technology Acceptance Model (TAM)
3
Research model and hypotheses
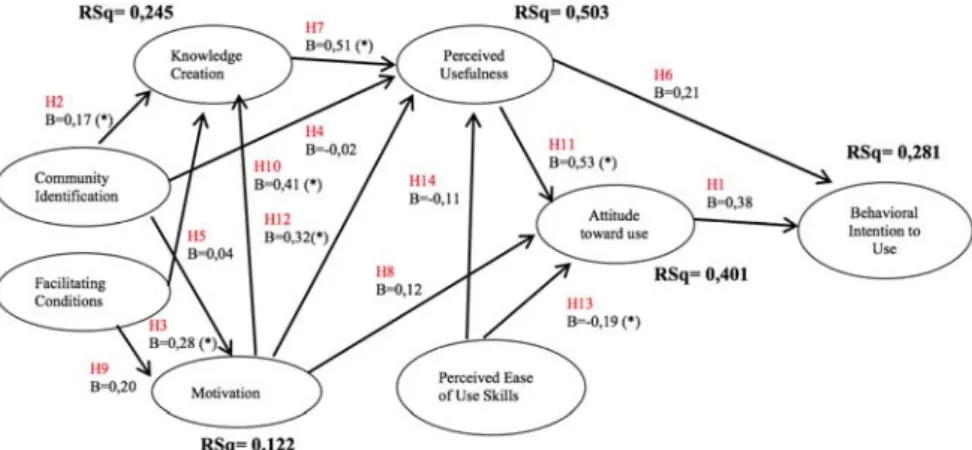
In accordance with the research objective, the research model proposed is an extension of the conventional TAM. Our model consists of the TAM core constructs defined as - PU, PEU, ATU, and BIU - and four external variables defined as knowledge creation (KC), community identification (CI), facilitation of conditions (FC) and motivation (MO). [see Figure 2].
Thus, the hypotheses of this work are presented in and described below: According to [Davis, 89] and [Taylor, et al., 95]; attitude toward use has a positive and significant influence on behavioural intention. Therefore, this study proposes the following hypothesis:
(H1) Attitude toward using (ATU) CBTs in MOOCs positively influences behavioral intention to use them (BIU).
Community identification is the individual’s sense of group belonging as a community member, and the commitment by the individual to a sense of values, beliefs, and conventions shared with other community members [Kay, et al., 08]. Using CBTs during the learning process of a programming language usually allowed for the building collaboration between peers, given users the ability to create groups and share features and related resources.
The present study defines community identity as the individual’s level of commitment to the group of peers using CBTs as learning resource.
(H2) Community identification (CI) positively influences Knowledge creation (KC).
(H3) Community identification (CI) positively influences Motivation (MO).
(H4) Community identification (CI) positively influences Perceived usefulness (PU).
Facilitating conditions are defined as the degree to which an individual believes that an organizational and technical infrastructure exists to support the use of the system [Deci, et al., 91]. For example, the tutorials are provided to explain how use a given tool, and the help menu or other services are crucial to the adoption of the CBTs. The previous definition allows use to infer that this type of resources facilitates and supports learning activities related to the use of CBTs.
(H5) Facilitating condition (FC) positively influences Knowledge creation (KC).
(H9) Facilitating condition (FC) positively influences Motivation (MO). According to Mitchell [Mitchell, et al., 00], Knowledge creation as a process refers to the initiatives and activities undertaken to generate new ideas or objects. Styhre [Styhre, et al., 02] describes knowledge creation as "the utilization of complex and discontinuous events and phenomena to deal with collectively defined problems." On the other hand, as an output, Mitchell [Mitchell, et al., 00], defined the knowledge creation process as "the representation of an idea”, and argued that it “can be differentiated from its impact on the organizational system, or outcome." This means that new knowledge is diffused, adopted, and embedded in the form of new products, services, and systems. Therefore, this could have a positive effect on Perceived usefulness (PU).
(H7) Knowledge creation (KC) positively influences Perceived usefulness (PU).
Motivation is an important factor in the adoption of CBTs. According to [Deci, et al., 91], an important aspect of student engagement in the learning process, without the necessity of rewards or constraints, is the instinct motivation. Extrinsic motivation, on the other hand, provides students with engagement in the learning process as a means to an end, such as grades, recognition, or feedback. Motivation depends on many personal factors (personality, education, etc.), family, and the social context in which the learning process is conducted (teaching methods, teachers, etc.). Motivation is essential for learning, and progress is inherent in the possibility of giving meaning and significance to knowledge. Without motivation, the student is unable to do a proper job, not only in terms of learning a concept but also in terms of establishing strategies that allow for solving problems similar to those learned.
(H8) Motivation (MO) positively influences Attitude toward use (ATU).
(H10) Motivation (MO) positively influences Knowledge creation (KC).
(H12) Motivation (MO) positively influences Perceived usefulness (PU). Finally, considering the model proposed by Davis [Davis, 89], the next hypotheses seek to revalidate such relationships in the context of CBTs in a MOOC.
(H13) Perceived ease of use (PEU) positively influences attitude toward use (ATU).
(H14) Perceived ease of use (PEU) positively influences perceived usefulness (PU) of the system.
(H11) Perceived usefulness (PU) positively influences Attitude toward use (ATU).
(H6) Perceived usefulness (PU) positively influences Behavioral intention to use (BIU).
4
MOOC learning environment settings: Case Study
This research is developed according to the MOOC “Java Fundamentals for Android Development” which is part of the Professional Android Developer MicroMasters Program into edX, was implemented during January 2017 with 34,967 learners from 193 countries registered in the course. This program was created to developers familiar with object-oriented programming languages and interested in building Android applications. This MOOC is not only about Java; it is about how you use Java on the development of Android applications, and about the basic knowledge learners need to begin programming with Android [Morales, et al., 17].
The structure and sequencing of the MOOC supports the learning objectives of each topic that is covered in the course syllabus. This MOOC has 5 lessons, and each lesson combines several video lectures, learning activities for practice and get immediate feedback of his progress related to content, a questionnaire at the end of the lesson, and academic support through different means, such as tutoring sessions, forums, and email.
These learning resources all together provide the scaffolding the learner needs to understand and expand his knowledge of java programming language. The alignment
of these main lesson components on edX platform ensures an internally consistent structure to help learners accomplish the learning goals. In general, the course content builds towards greater complexity, starting with basic topics and moving towards complex ones.
To enrich the learning process of java programming language, we proposed the use of a CBT such as Codeboard. It consists of a source code editor, a compiler, built in automation tools, and a debugger. In addition, Codeboard supports the IMS LTI standard, facilitating the interoperability with the edX platform [Morales, et al., 17]. Below are the types of activities created using Codeboard.
a) Activities that enable students to practice, to integrate concepts, and to learn new ones: In each lesson, there are activities that involve the use of Codeboard to solve java exercises with the aim to improve learners programming skills and understanding. Codeboard facilitate the delivery of the assigned exercises and is easy to use [Morales, et al., 17]. A learner can understand how a programming exercise works. Simple changes can be implemented and deployed immediately without affecting the original program, or other learners. The learner can compile and run the new code with the changes and verify if the code is having the expected behavior. With this type of activities, it is possible to practice the concepts in an interactive way.
b) Special activities to share and learn from peers: Throughout the MOOC
content, there are special activities that were designed to lead students in the process of collaborating with one another. The approach use in this type of activities involves examining the role students may play in their learning process, their attitudes, engagement and the responsibility they have on shaping their own learning experience. To share and learn from each other is one of the great advantages of Codeboard. Students were asked to share their solutions with their peers by posting the link at a special forum. This way, anyone could review a solution and learn from it; even better, students could give each other advices of better programming practices.
c) More efficient and effective feedback: It is important to realize that in something as complex and ever changing as programming, there are always many ways to do something correctly. One of the main problems that a tutor has to face is how to review and grade an assignment; students’ submissions are just lines of code. With Codeboard the submission process of an exercise to be reviewed by a tutor or a peer becomes easier and efficient. The student only needs to share a link, and the tutor or peer just needs to compile and run the program to test that it works. Finding errors in case the program does not work correctly is also simple, and the tutor gives a better feedback to the student´s work.
5
Methodology
5.1 Participants and data collection
The full sample obtained comprised 133 questionnaires, from which those with incomplete or unclear responses were omitted, thus yielding a final sample of 131 questionnaires. 20% were pre-university students, 50% had a bachelor's degree and 30% had a postgraduate degree and 83.33% of the sample was male.
To test our hypotheses, data were collected from a web-based questionnaire, which consisted of two sections. The first section it’s about student´s Demographic data (DD), such as age, gender, or educational level.
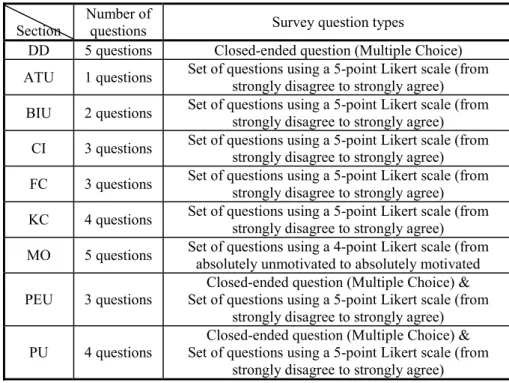
The second section is the main component of the questionnaire and consists of 30 questions to investigate the 8 factors introduced in research model and hypotheses section. [Table 1] shows questionnaire structure and question types.
Section Number of questions Survey question types
DD 5 questions Closed-ended question (Multiple Choice) ATU 1 questions Set of questions using a 5-point Likert scale (from strongly disagree to strongly agree)
BIU 2 questions Set of questions using a 5-point Likert scale (from strongly disagree to strongly agree) CI 3 questions Set of questions using a 5-point Likert scale (from strongly disagree to strongly agree) FC 3 questions Set of questions using a 5-point Likert scale (from strongly disagree to strongly agree) KC 4 questions Set of questions using a 5-point Likert scale (from strongly disagree to strongly agree) MO 5 questions Set of questions using a 4-point Likert scale (from absolutely unmotivated to absolutely motivated PEU 3 questions
Closed-ended question (Multiple Choice) & Set of questions using a 5-point Likert scale (from
strongly disagree to strongly agree) PU 4 questions
Closed-ended question (Multiple Choice) & Set of questions using a 5-point Likert scale (from
strongly disagree to strongly agree)
Table 1: Questionnaire structure and question types
5.2 Data Analysis
This study employed a regression analysis of latent variables, based on the optimization technique of partial least squares (PLS) to elaborate the model. This study draws on SmartPLS 3.2.6. PLS is a multivariate technique for testing structural models and estimates the model parameters that minimize the residual variance of the dependent variables of the whole model [Hair, et al., 13]. It does not require any parametric conditions and is recommended for small samples [Hulland, 99] .
5.3 Justification of numbers of cases
Roldán [Roldán, et al., 12] indicated that the sample size issue has been one of the main characteristics of PLS. The segmentation process used by the PLS algorithm allows the dividing of complex models into subsets. It permits to calculate sample size, in terms of largest number of structural paths directed at a particular dependent latent variable.
Although there are different, much less restrictive criteria, Reinartz [Reinartz, et al., 09] advise increasing the sample size to 100 cases in order to reach acceptable levels. Although this criterion has been a highly used, Roldán [Roldán, et al., 2016] advise not to use the old heuristic rule of 10 cases per predictor which was suggested by Barclay [Barclay, et al., 95], so they suggest for a more precise valuation, to specify the size effect for each regression existing, while consulting the power tables developed by Cohen [Cohen, 92]. On the other hand, Hair [Hair et al., 14] suggest using programs such as G*Power 3.0 (Institut für experimentelle psychologie, 2007) for specific power analysis according to model specifications. [Borenstein, et al., 01] [Faul, et al., 07]
To determine the sample size, it is necessary to specify the effect size (ES), the value of the alpha significance level (α) and the power (1-β). In general terms, an alpha level of 0.05 and a power of 80% are accepted. It is necessary to specify the size of the expected effect and from these three data calculate the sample size. In this case, the multiple regression study was conducted with four predictors, an average effect size (ES) of 0.15, an alpha of 0.05, and a power of 0.95 (according [Cohen, 92]). Applying the analysis, it is observed that the result is N=129 subjects.
Hence, the sample available for our analysis (131 valid cases) surpasses any requirement demanded, to carry out the analysis of the measurement models and the structural model.
6
Results
6.1
Analysis of validity and reliability
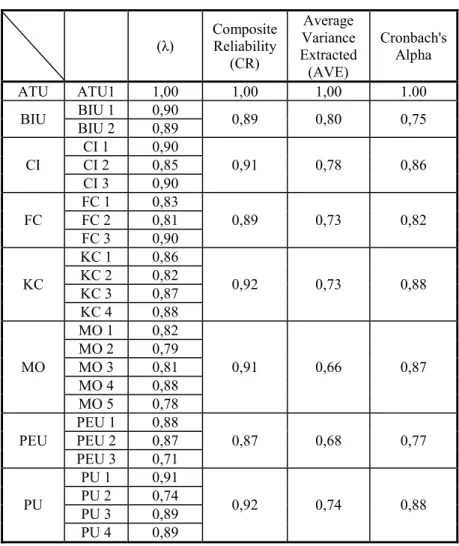
The reliability analysis ensures the validity and consistency of the items used for each variable. Chin [Chin, 98] recommends the convergent validity of all construct measurement items should meet the following three conditions: (a) the factor loading (λ) > 0.5; (b) the composite reliability (CR) > 0.6; and (c) average variance extracted (AVE) > 0.5. [Table 2] shows results for reliability and validity of all constructs.
For this study, the factor loadings (λ) of all items was higher than 0.5. All the values of CR exceed 0.87 [Werts, et al., 1974], [Chin, 98] and the analysis of variance, all the values for the AVE were above 0.50, and range between 0.66 – 0.80, [Fornell, et al., 81], exceeding the minimum acceptable values for validity.
Thus, all the items exhibited convergent validity (Chin, 98). In addition, the Cronbach’s (α) of all items were higher than 0.75, indicating a high confidence level [Nunnally, et al., 94].
Table 2: Factor loading (λ), construct reliability (CR), average variance extracted AVE and Cronbach’s alpha coefficients.
Additionally, [Fornell, et al., 81] suggest that the square root of AVE in each latent variable can be used to establish discriminant validity so for confirm discriminant validity among the constructs, the square root of the AVE must be superior to the correlation between the constructs. [Table 3] presents the square roots of the AVE on the diagonal and the correlations among the constructs. This value is larger than other correlation values among the latent variables, so that the values indicate adequate discriminant validity of the measurements.
(λ) Composite Reliability (CR) Average Variance Extracted (AVE) Cronbach's Alpha ATU ATU1 1,00 1,00 1,00 1.00
BIU BIU 1 BIU 2 0,90 0,89 0,89 0,80 0,75 CI CI 1 0,90 0,91 0,78 0,86 CI 2 0,85 CI 3 0,90 FC FC 1 0,83 0,89 0,73 0,82 FC 2 0,81 FC 3 0,90 KC KC 1 0,86 0,92 0,73 0,88 KC 2 0,82 KC 3 0,87 KC 4 0,88 MO MO 1 0,82 0,91 0,66 0,87 MO 2 0,79 MO 3 0,81 MO 4 0,88 MO 5 0,78 PEU PEU 1 0,88 0,87 0,68 0,77 PEU 2 0,87 PEU 3 0,71 PU PU 1 0,91 0,92 0,74 0,88 PU 2 0,74 PU 3 0,89 PU 4 0,89
Table 3: Discriminant validity matrix [Fornell, et al., 81]
On the other hand, as we can show in [Table 4] the discriminant validity
measures using the heterotrait-multitrait (HTMT) method [Henseler, et al., 14] which indicated the mean of the heterotrait-heteromethod correlations relative to the geometric mean of the average monotrait-heteromethod correlation of both variables.
We used a conservative criterion of 0.85, which is associated with sensitivity levels of 95% or better. With construct correlations of 0.70, the specificity rates for HTMT 0.85 are near to 100%. We found that the HTMT ratio for group-focused and individual focused transformational leadership, at 0.83, was below the 0.85 cutoff, and substantially below the 0.95 cutoff recommended for conceptually close constructs [Henseler, et al., 14]. This provides good support for our claims of discriminant validity between our measures of group - and individual level transformational leadership measures [Henseler, et al., 14]
ATU BIU CI FC KC MO PEU PU ATU BIU 0,58 CI 0,12 0,53 FC 0,16 0,07 0,07 KC 0,61 0,69 0,33 0,13 MO 0,41 0,46 0,32 0,21 0,53 PEU 0,22 0,16 0,24 0,15 0,15 0,16 PU 0,61 0,51 0,22 0,38 0,72 0,62 0,13
Table 4: Discriminant validity matrix (Heterotrait-Monotrait Ratio Criterion)
ATU BIU CI FC KC MO PEU PU
ATU 1,00 BIU 0,50 0,89 CI 0,12 0,41 0,88 FC 0,21 0,05 0,03 0,85 KC 0,57 0,56 0,29 0,13 0,86 MO 0,39 0,38 0,28 0,21 0,47 0,81 PEU -0,20 0,10 0,20 0,08 0,10 0,10 0,82 PU 0,60 0,43 0,19 0,33 0,64 0,54 -0,03 0,86
6.2 Structural model analysis
The model proposed for this study [see Figure 2] has been prepared from PLS-SEM for structural model analysis, exploring the intensity and direction of the relationships among variables. PLS program can generate T-statistics for significance testing of both the inner and outer model, using a procedure called bootstrapping [Chin, 98].
In this procedure, a large number of subsamples (5000) are taken from the original sample with replacement to give bootstrap standard errors, which in turn gives approximate T-values for significance testing of the structural path. After the bootstrapping procedure is completed. Results can get as the following: All the R2
values range from 0 to 1. The higher the value, the more predictive capacity the model has for that variable.
Where R2should be high enough for the model to reach a minimum level of explanatory power. The R2 values are greater than 0.10 with a significance of t > 1.64 [Frank, et al., 92].
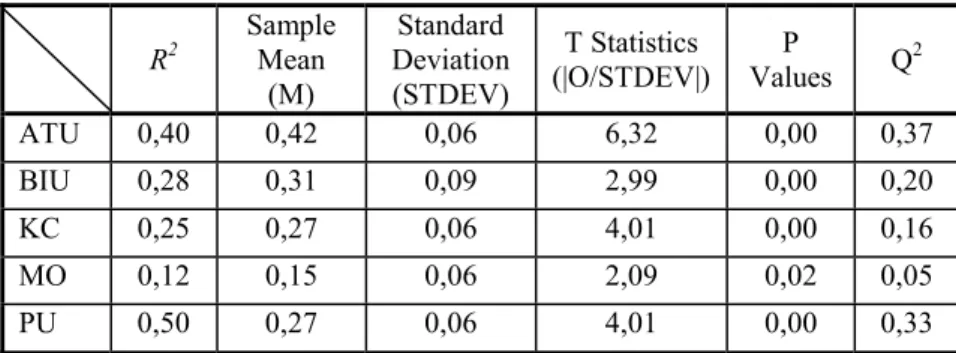
[Figure 3] and [Table 5] shown the variance explained (R2) in the dependent constructs and the path coefficients for the model. They are not less than 0.10, indicating that the independent explanatory variables are adequate.
R2 Sample Mean (M) Standard Deviation (STDEV) T Statistics (|O/STDEV|) Values P Q2 ATU 0,40 0,42 0,06 6,32 0,00 0,37 BIU 0,28 0,31 0,09 2,99 0,00 0,20 KC 0,25 0,27 0,06 4,01 0,00 0,16 MO 0,12 0,15 0,06 2,09 0,02 0,05 PU 0,50 0,27 0,06 4,01 0,00 0,33
Table 5: Structural model results
The standardized of the regression coefficients show the estimates of the relationships of the structural model, that is, the hypothesized relationships between constructs. In addition, it will analyze the algebraic sign if there is change of sign, the magnitude and statistical significance is greater T-statistic of (t (4999), one-tailed test) 1.64.
Furthermore, the hypotheses were checked and validated, and the relationships were positive, mostly with high significance [Table 6]. (Note: Result = R, Accepted = A, and Sign Change = SC).
SPC Sample Standard T P SC H1 A ATU -> 0,38 0,38 0,13 2,83 0,00 No H2 A CI ->KC 0,17 0,17 0,08 2,15 0,02 No H3 A CI ->MO 0,28 0,28 0,08 3,29 0,00 No H4 CI ->PU -0,02 -0,01 0,10 0,22 0,41 Si H5 FC ->KC 0,04 0,04 0,10 0,40 0,34 Si H6 PU -> BIU 0,21 0,22 0,13 1,64 0,05 No H7 A KC -> PU 0,51 0,51 0,08 6,15 0,00 No H8 MO -> ATU 0,12 0,13 0,09 1,32 0,09 Si H9 FC -> MO 0,20 0,21 0,12 1,64 0,05 Si H10 A MO -> KC 0,41 0,41 0,08 4,89 0,00 No H11 A PU -> ATU 0,53 0,53 0,08 6,76 0,00 No H12 A MO -> PU 0,32 0,31 0,12 2,65 0,00 No H13 A PEU -> ATU -0,19 -0,19 0,08 2,33 0,01 No H14 PEU -> PU -0,11 -0,12 0,10 1,11 0,13 Si
Table 6: Structural model results. Path significance using percentile bootstrap 95% confidence interval (n = 5.000 subsamples)
However, when it is applied percentile bootstrap to generate a 95% confidence interval using 5.000 resamples, H1, H2, H3, H7, H10, H11, H12, H13, is supported because its confidence interval not includes zero [See Table 5]. Thus, all hypotheses are adopted.
All of these results complete a basic analysis of SEM in our research. PLS-SEM result is shown in [Figure 3].
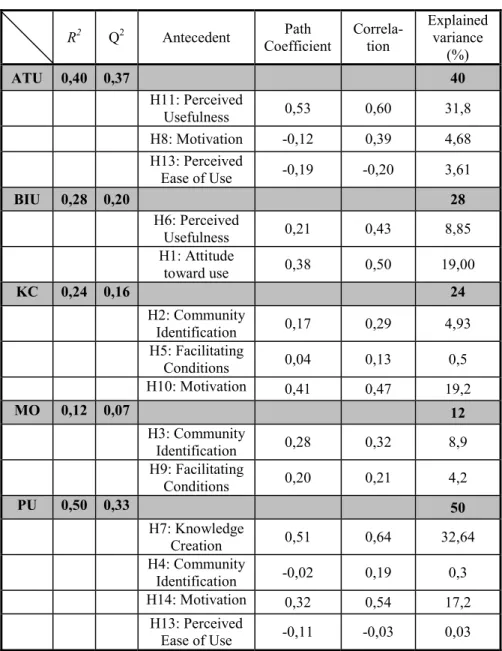
Finally, [Table 7] shows the amount of variance that each antecedent variable explains on each endogenous construct. R2 figures are outstanding for almost all values, greater than 0.24. Thus, cross-validated redundancy measures show that the theoretical structural model has a predictive relevance.
7
Discussion
This research found that perceived ease of use and perceived usefulness positively influence a learner's attitude toward CBT (codeboard) used in a MOOC environment (H11 and H13 were accepted). It also demonstrates a positive influence between ATU and BIU (H1 was accepted), providing support for our research question (RQ1), which estimated a strong relationship among these three variables (PU, PEU, ATU). This finding is consistent with those of previous research on adoption or acceptance of an innovation in a system, as reported by [Walker, et al., 12, Alharbi, et al., 14].
On the other hand, no significant influence was found between the perceived ease of use of a CBT and perceived usefulness (H14 was not accepted). This finding suggests that if a CBT is easy for a student to use, this does not guarantee that it will be useful for his or her learning process. This should allow us to reflect on the criteria to be used when integrating CTBs into a MOOC.
Figure 3: Results of testing the model significance *p < 0.05
In relation to the second research question (RQ2) examined, the three external variables analyzed (KC, CI, MO) with regard to the student's perception of usefulness and attitude toward use CBTs in a MOOC, we found that the knowledge creation and motivation have a positive influence (H7 and H12 were accepted). However, no exist evidence that the perception of usefulness was influenced by community identification (H4 was not accepted). This suggests that the learners don't perceive useful the individual's sense of group belonging as a community member, at the moment of the learning process.
This study has also found that the identification with the community of students influences and conditions both knowledge creation and motivation (H2 and H3 were accepted). In addition, it is found that the motivation has a positive influence in the knowledge creation (H10 was accepted). In this sense, the motivation could be influenced by the implementation of learning activities using a new tool.
Contrary to expectations, if learners have the facilitating conditions from using a new tool (for example: manuals, guides and tutorials), no implies that they are motivated to use it or will generate knowledge through it (H5 and H9 were not accepted).
R2 Q2 Antecedent Path Coefficient Correla-tion Explained variance (%) ATU 0,40 0,37 40 H11: Perceived Usefulness 0,53 0,60 31,8 H8: Motivation -0,12 0,39 4,68 H13: Perceived Ease of Use -0,19 -0,20 3,61 BIU 0,28 0,20 28 H6: Perceived Usefulness 0,21 0,43 8,85 H1: Attitude toward use 0,38 0,50 19,00 KC 0,24 0,16 24 H2: Community Identification 0,17 0,29 4,93 H5: Facilitating Conditions 0,04 0,13 0,5 H10: Motivation 0,41 0,47 19,2 MO 0,12 0,07 12 H3: Community Identification 0,28 0,32 8,9 H9: Facilitating Conditions 0,20 0,21 4,2 PU 0,50 0,33 50 H7: Knowledge Creation 0,51 0,64 32,64 H4: Community Identification -0,02 0,19 0,3 H14: Motivation 0,32 0,54 17,2 H13: Perceived Ease of Use -0,11 -0,03 0,03
Table 7: Effects on endogenous variables (extended model)
8
Conclusions
This study has investigated the correlation between the core constructs of the TAM (PU, PEU, ATU, BIU) and the four external variables defined in our research model proposed (KC, CI, FC, MO) through a structural equation modeling (SEM) to explain
the causal relationships existing’s. Most of the causal relationships between the constructs postulated by the structural model are well supported.
In view of the results, we can conclude that research model proposed affirm that the attitudes toward use of Codeboard such as resource to support the development of learning activities is significantly associated with the behavioral intention to use it. This implies that TAM is an appropriate model for analyzing the behavioral intention of using CBTs into a MOOC.
This study has a few limitations. First, the sample size is limited (note that, this study only analyzes Codeboard as a CBT), a larger sample size of different types CBTs is required to further generalize. Second, the prior knowledge and experience of the learners about use this CBT, may have an effect direct on the outcomes of the study. In a future study, an analysis that differentiates the participants with regards to their prior knowledge and experience with CBT may lead to improved insights.
Additionally, while this type of CBTs shows pedagogical promise, didactic strategies are needed to further promote the behavioral intention to use of these emerging technologies as resource for improving learning in a MOOC.
Acknowledgements
This study has been co-funded by the Erasmus+ Programme of the European Union, project MOOC-Maker (561533-EPP-1-2015-1-ES-EPPKA2- CBHE-JP
References
[Alharbi et al., 14] Alharbi, S. and Drew, S. Using the Technology Acceptance Model in Understanding Academics’ Behavioural Intention to Use Learning Management Systems. International Journal of Advanced Computer Science and Applications (IJACSA), (2014). [Barclay, et al., 95] Barclay, D.; Higgins, C. & Thompson, R. The partial least squares (PLS) approach to causal modeling: Personal computer adoption and use as an illustration. Special Issue on Research Methodology. Technology Studies, 2(2): 285- 309, (1995).
[Borenstein, et al., 01] Borenstein, M., Rothstein, H. y Cohen, J., (2001). Power and precision. Available online: http://power-analysis.com.
[Chang et al., 07] Chang, V., & Guetl, C. E-Learning Ecosystem (ELES) - A Holistic Approach for the Development of more Effective Learning Environment for Small-and-Medium Sized Enterprises (SMEs). In 2007 Inaugural IEEE-IES Digital EcoSystems and Technologies Conference (pp.420 – 425) http://doi.org/10.1109/DEST.2007.372010
[Chin, 98] Chin, W. W. (1998). The partial least squares approach to structural equation modelling. In Marcoulides, G. A. (Ed.), Modern methods for business research (pp. 295–336). Mahwah, NJ: Lawrence Erlbaum.
[Cohen, 92] Cohen, J. A power primer. Psychological Bulletin, 112, 1, 155-159. Cohen, J. (1994). The earth is round (p< .05). American Psychologist, 49, 997-1003, (1992).
[Davis, 89] Davis, F. D. Perceived Usefulness, Perceived Ease of Use, and Use Acceptance of Information Technology. MIS Quarterly, 13(3), 319-340, (1989).
[Deci, et al., 91] Deci, L., Vallerand, R., Pelletier, L. & Ryan, R. Motivation and Education: The Self-Determination Perspective, EDUCATIONAL PSYCHOLOGIST, 26(3 & 4), 325-346, (1991).
[Faul, et al., 07] Faul, F., Erdfelder, E., Lang, A.-G., & Buchner, A. (2007). G*Power 3: A flexible statistical power analysis program for the social, behavioral, and biomedical sciences. Behavior Research Methods, 39, 175-191.
[Frank, et al., 92] Frank, F.R. & Miller, N.B. (1992). A primer for soft modeling University., Akron, OH, US.
[Fishbein et al., 75] Fishbein, M., & Ajzen, I. Belief, attitude, intention and behavior: an introduction to theory and research, (1975).
[Fornell, et al., 81] Fornell, C. & Larcker, D.F. (1981). "Evaluating Structural Equation Models with Unobservable Variables and Measurement Error". Journal of Marketing Research, 18, 1), 39–50
[Geser, 12] Geser, G. Open Educational Practices and Resources. Open e-Learning Content Observatory Services (OLCOS) Roadmap 2012.
[Hair, et al., 13] Hair, J.F.; Ringle, C.M.; Sarstedt, M. Partial Least Squares Structural Equation Modelling: Rigorous Applications, Better Results and Higher Acceptance. Long Range Planning, 46, 1–2, (2013).
[Hair, et al., 14] Hair, J. F., Hult, G. T. M., Ringle, C. M., and Sarstedt, M. 2014. A Primer on Partial Least Squares Structural Equation Modeling (PLS-SEM). Thousand Oaks, CA: Sage [Henseler, et al., 15] Henseler, J.; Ringle, C.M. & Sarstedt, M. (2015): A new criterion for assessing discriminant validity in variance-based structural equation modeling. Journal of the Academy of Marketing Science, 43: 115-135.
[Hernández et al., 14a] Hernández, R.; Gütl, C.; & Amado-Salvatierra, H.: Cloud Learning Activities Orchestration for MOOC Environments. In Learning Technology for Education in Cloud. MOOC and Big Data (Vol. 446 CCIS, pp. 25–36). doi:10.1007/978-3-319-10671-7_3 (2014).
[Hulland, 13] Hulland, J. Use of partial least squares PLS) in strategic management research: A review of four recent. Strategic Management Journal, 20, 195, (1999).
[Kay, et al., 08] Kay, R.H., & Loverock, S. Assessing emotions related to learning new software: The computer emotion scale. Computers in Human Behavior. 24, 1605-1623King & He, 2006; Nga, Poon & Chan, 2007; van Raaij & Schepers, (2008)
[Law et al., 2010] Law, K.MY, Victor CS L., and Yuen-Tak Yu. Learning motivation in e-learning facilitated computer programming courses. Computers & Education, Volume 55, Issue 1, Pages 218-228, ISSN 0360-1315, (2010).
[Mitchell, et al., 00] Mitchell, R., Boyle B. Knowledge creation measurement methods, Journal of Knowledge Management, Vol. 14 Issue: 1, pp.67-82, (2010).
[Morales, et al., 15] Morales, M., Barchino, R., Medina, A., Hernández, R., (2015). Using Cloud-based Tools: A Study of Motivation and Learning Strategies in Latin America, International Journal of Engineering Education, 31(4), pp. 901–911.
[Morales, et al., 17] Morales Chan, M., de La Roca, M., Alario-Hoyos, C., Barchino Plata, R., Medina, J.A., Hernández Rizzardini, R., Perceived usefulness and motivation students towards the use of a cloud-based tool to support the learning process in a Java MOOC, Proceedings of the International Conference MOOC-Maker 2017, 73-82, Antigua Guatemala, Guatemala, November 2017.
[Nunnally, et al., 94] Nunnally, J.C. & Bernstein, I. Psychometric Theory, Rdsepiucsforg, 3, 701, (1994).
[PDST Technology in Education, 15] PDST Technology in Education. (2015). Cloud based Tools & Applications for Learning. Retrieved from:
http://www.pdsttechnologyineducation.ie/en/Technology/Advice-Sheets/Cloud-based-Tools-and-Applications.pdf
[Perez et al., 16] Pérez, M.; Maldonado, J.; y Morales. Estado del arte de adopción de MOOCs en la Educación Superior en América Latina y Europa. MOOC-Maker Construction of Management Capacities of MOOCs in Higher Education pp4-8, (2016).
[Reinartz, et al., 09] Reinartz, W. Haenlein, M. & Henseler, J. An empirical comparison of the efficacy of covariance-based and variance-based (SEM), International Journal of Research in Marketing, 26 (4): 332-344, (2009).
[Roldán, et al., 12] Roldán, J. L., & Sánchez-Franco, M. J. Variance-Based Structural Equation Modelling: Guidelines for Using Partial Least Squares in Information Systems Research. (2012).
[Roldán, et al., 16] Roldán, J.L. & Cepeda, G. Seminario Modelos de Ecuaciones Estructurales basados en la Varianza: Partial Least Squares (PLS) para Investigadores en Ciencias Sociales (III Edición), (2016).
[Shah, 2016] Shah, D., By the Numbers: MOOCS in 2016. Class Central. Retrieved October 2017 from https://www.classcentral.com/report/mooc-stats-2016/.
[Spyropoulou et al., 15] Spyropoulou, N.; Demopoulou, G.; Pierrakeas, C.; Koutsonikos, J.; Kameas, A. Developing a Computer Programming MOOC, Procedia Computer Science, Volume 65, Pages 182-191, ISSN 1877-0509, (2015).
[Styhre, et al., 02] Styhre, A., Roth, J., & Ingelgard, A. Care of the other: knowledge-creation through care in professional teams. Scandinavian Journal of Management, 18(4), 503, (2002). [Taylor, et al., 95] Taylor, S., & Todd, P. A. Understanding Information Technology Usage: A Test of Competing Models. Information Systems Research, 6(4), 144-176, (1995).
[Venkatesh et al., 00] Venkatesh, V., & Davis, F. D. A theoretical extension of the technology acceptance model: Four longitudinal field studies. Management Science, 46(2), 186-204, (2000).
[Walker et al., 12] Walker, S.C and Pearson, J. Intent to Use Technology: Facilitation Effect of Group Presence. International Journal of Business Information and Technology. Vol. 1 No. 1, pp. 1-15, (2012).
![Table 3: Discriminant validity matrix [Fornell, et al., 81]](https://thumb-us.123doks.com/thumbv2/123dok_us/1527817.2704562/12.892.242.663.170.386/table-discriminant-validity-matrix-fornell-et-al.webp)