ICP-MS Applied to Certifying an Isotopically
Enriched Cd Candidate Reference Material:
A Case Study
Ivan Trešl and Christophe R. Quétel
European Commission Joint Research Center, Institute for Reference Materials and Measurements, Geel, Belgium
An analytical method is presented based on reverse isotope dilution single detector induc-tively coupled plasma magnetic sector mass spectrometry (ID-ICP-SMS) and applied to the specific case of the certification of a111Cd enriched candidate Cd spike calibration material (nominal mass fraction 10 mg kg⫺1in 5% HNO
3solution). Uncertainty propagation was used as a tool for both determining the analytical approach and validating it. The robustness of close to “exact matching” reverse IDMS to correction of measured isotope intensities for multipli-cative (mass discrimination) and (semi)additive effects (dead time, instrumental background, and isobaric interference) is discussed. The very low experimental relative standard deviation of the mean (0.08%) of eight replicate determinations indicated that all significant sources of uncertainty had probably been taken into account for the estimation of the final combined uncertainty statement (Uc⫽0.17%,k⫽1). IRMM-621 was used as comparator. Uncertainties on IUPAC isotopic abundances of 111Cd and 112Cd, for the natural Cd solution involved between the two enriched materials, formed nearly 60% ofUc. The repeatability of the isotope ratio measurements contributed less than 10%. Correction for procedural blank necessitated somewhat unusual calculations (potential contamination of an enriched material with natural Cd). The procedure also involved a quadrupole based ICP-MS judged to be appropriate for the characterization of the isotopic composition. For comparison purposes, direct IDMS results are simulated using identical experimental input data. Finally, a significant background signal in the 106 –116 mass region, observed only with the magnetic sector instrument, was attributed to argon based isobaric interferences. (J Am Soc Mass Spectrom 2005, 16, 708 –716) © 2005 American Society for Mass Spectrometry
I
sotope dilution mass spectrometry (IDMS) was rec-ognized as having the potential to be a primary ratio method of measurement [1]. When applied cor-rectly, it can be of “practical use in establishing trace-ability to the SI unit system” [2] and accurate results with sufficiently small uncertainties can be achieved. The advantages and disadvantages of the IDMS method have been discussed [3, 4] since its invention nearly 50 years ago. One of the significant advantages over other approaches is that the analyte recovery does not have to be quantitative, providing that isotopic equilibration has been achieved between all of the analyte and added spike material. Commonly there is the reverse IDMS (or two-way IDMS) whereby the spike material is cali-brated against a well-characterized assay material. The alternative is direct IDMS (or one-way IDMS) which is faster but requires a spike material already reliablycertified “once for all” for the element content and isotopic composition. Direct IDMS has the potential to lead to relative combined uncertainties on the amount content determination of⬃1% (k⫽2) even with quad-rupole ICP-MS (inductively coupled plasma mass spec-trometry) instrumentation [5]. In many cases this is entirely fit for the purpose and a better commercial availability of certified spike materials, carrying SI traceable values with demonstrated small uncertainty, should help the use of direct IDMS to spread. Merck (Darmstadt, Germany) launched the production of new sets of isotopically enriched materials that enable un-certainty targets of⬃2% (k⫽2) or better for ID based methods, when correctly applied. A joint project with the Institute for Reference Materials and Measurements (IRMM) [6] was set up to certify isotopically enriched spike calibration solutions. Within that project, a 53Cr enriched solution was recently characterized [7]. It was also decided to certify the isotopic composition and the amount content of a111Cd enriched solution because of the important demand on measurement of the Cd
Published online March 11, 2005
Address reprint requests to Dr. C. R. Quétel, European Commission Joint Research Center, Institute for Reference Materials and Measurements, 111 Retieseweg, B-2440 Geel, Belgium. E-mail: [email protected]
© 2005 American Society for Mass Spectrometry. Published by Elsevier Inc. Received August 30, 2004
1044-0305/05/$30.00 Revised January 25, 2005
content by IDMS in a wide range of sample matrices [8 –12].
There was no suitable natural Cd certified reference material in our possession that would have allowed us to implement direct IDMS for this certification. Rather than preparing and characterizing one from high purity Cd metal, we developed a reverse ID-ICP-MS proce-dure, using as a constraint a target relative expanded uncertainty of 0.5–1% (k ⫽ 2) on the Cd content. Our paper, through the description of the way we carried out this project, examines the merits and limitations of close to “exact matching” reverse IDMS involving two isotopically enriched materials (the 111Cd enriched IRMM-621 against the Merck candidate Reference Ma-terial). Our experimental results allowed us to investi-gate in particular the robustness of the correction of measured isotope intensities for multiplicative (mass discrimination) and (semi)additive effects (dead time, instrumental background, and isobaric interference), as well as the potential for low final combined uncertain-ties, achievable with single detector ICP-MS and not necessarily with more complex instrumentation (multi-ple detector ICP-MS or thermal ionisation mass spec-trometry, TIMS). This work was originally presented at the 2003 European Winter Conference [13].
Experimental
Instrumentation
The measurements were of two kinds and were per-formed on two different ICP-MS instruments. An Ele-ment2 (double focusing single detector) was employed at low mass resolution for the measurement of the IDMS blend solutions. The determination of the isotopic composition (on nonspiked samples) was performed on a quadrupole based ICP mass spectrometer Elan 6000 (Perkin-Elmer Sciex, Ontario, Canada). Both instru-ments were operated with a noncooled quartz mini-cyclonic spray chamber (P/N 809-0188, Cinnabar, Glass Expansion, West Melbourne, Australia), fitted with a MicroFlow (⬃50L min⫺1) PFA nebulizer (no. 50-1142, CPI International, Amsterdam, The Netherlands) for the Element2, and with a forced low-flow concentric glass nebulizer (P/N 1110720, MicroMist, Glass Expan-sion, West Melbourne, Australia) for the Elan 6000. All the measurements were carried out in the pulse count-ing mode, and the dead time effects [14] were corrected following specific methods described elsewhere [15] (using Method 2 for the Element2 and Method 4 for the Elan 6000). Dead time values of 14⫾4 ns (k⫽2) and 57 ⫾ 10 ns (k ⫽2) were found for the Element2 and the Elan 6000, respectively.
Reagents, Reference Materials, and Labware
A Milli-Q system (Millipore, Bedford, MA) was used for the production of ultra-pure water. All dilutions were prepared using ultra pure, concentrated nitric acid
(Ultrex, J.T. Baker, Phillipsburg, NJ). The111Cd enriched candidate spike material (Merck, Darmstadt, Germany) was delivered in four small PFA bottles (as 5% HNO3 solutions). The Isotopic Reference Material IRMM-621, certified for the Cd amount content and isotopic com-position, was available in a sealed quartz ampoule (1 mol L⫺1 HNO
3 solution). The cadmium solution of natural isotopic composition [16] that served as a link between the two isotopically enriched materials was from Johnson Matthey GmbH (Karlsruhe, Germany). The Cd mass fraction was ⬃10 mg kg⫺1 for the three types of solutions. Only new labware material (bottles, vessels, tips, syringes etc.) was employed and it was cleaned thoroughly following a procedure described elsewhere in detail [5].
Analytical Procedure and Sample Preparation
Two sets of blends (for close to “exact matching” reverse IDMS) were prepared. First, samples of the isotopically enriched Merck material were spiked with aliquots of the natural cadmium solution and second, samples of the same natural-like cadmium (from the same bottle) were spiked with aliquots of the IRMM-621 111Cd enriched material. All spikes were added gravi-metrically. The cadmium amount content in the Merck material was calculated as follows (eq 1):
Cx⫽Cz· mz mx ·my my
冉
Ry⫺共
Ry⁄Ry_meas兲
·RM1共
Ry⁄Ry_meas兲
·RM1⫺Rx冊
⫻冉
Rz⫺共
Ry⁄Ry_meas兲
·RM2共
Ry⁄Ry_meas兲
·RM2⫺Ry冊
·兺
iRxi兺
iRzi ⫺Bblk (1)x,y,z,M1, andM2 indices denote the sample (i.e., the isotopically enriched111Cd Merck solution), the natural Cd solution, the IRMM-621 spike, the blend of the Merck and natural Cd solutions, and the blend of the natural Cd solution and IRMM-621, respectively;c,m, individual R, and ⌺R indicate successively cadmium amount contents, masses, then(112Cd)/n(111Cd) isotope ratios and the sum of all ratios (all referenced to
n(111Cd)).B
blkcorresponds to the correction for possible
contamination (procedural blank covering all individ-ual steps of the measurement process) and will be described in detail later. The Ry_meas is the measured ratio in the natural Cd solution.
For convenience, the expression (Ry/Ry_meas), rep-resenting the correction for mass discrimination, will be expressed as “K-factor” in the rest of the paper.
In total, 16 blends were gravimetrically prepared, eight blends for each set (two blends per Merck bottle provided and eight blends to characterize the natural Cd solution). The mixtures were diluted with 2% HNO3 in two steps to reach the Cd mass fraction of approximately 2.4 ng g⫺1. Nonspiked Merck solu-tions, reserved for the isotopic composition determi-nation, were diluted to⬃3.3 ng g⫺1of Cd. All sample
preparation was carried out under ultra-clean labo-ratory conditions.
ICP-MS Isotope Ratio Measurements and
Correction for Mass Discrimination Effects
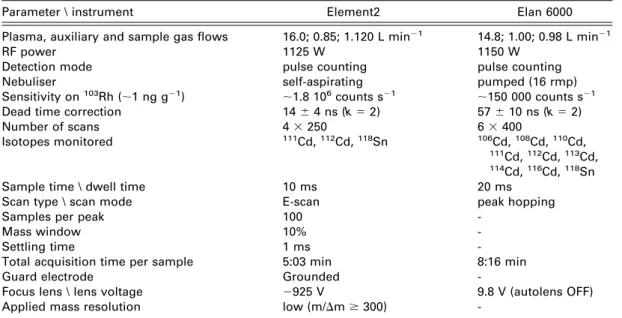
The ICP-MS experimental conditions used for the cadmium isotope ratio measurement are listed in
Table 1. Correction for mass discrimination effects was performed externally using the “bracketing ap-proach”. At low mass resolution the Element2 pro-duces flat-topped peaks and the repeatability of iso-tope ratio measurements is up to⬃5–10 times better than what is obtained with the Elan 6000 [17]. How-ever, the relative uncertainty on the correction for mass discrimination effects might be larger in the first case than in the second. Isotope ratio measurements require fast scanning across masses of interest and thus, since the magnetic field cannot be changed quickly enough, it is kept constant while varying the acceleration voltage and the voltage applied to the electrostatic filter instead (“E-scan” mode). However, according to the Liouville’s theorem [18], the reduc-tion of the accelerareduc-tion voltage (to increase the mon-itored mass) leads to an expansion of the ion beam size. This effect might, in turn, lead to a reduction of the ion transmission rate and the apparition of a mass discrimination effect in favor of the lightest ions that is specific to the Element2 [17, 19]. As this effect must be monitored specifically for each pair of isotopes, the Element2 was used only for the blend isotope ratio measurements. For the determination of the Cd isotopic composition, considering the large number of ratios to measure, the Elan 6000 was used instead. It allows a straightforward implementation of the linear model [20] to calculate K-factors specific to each isotope ratio and was better suited to the task
than the Element2. During the ICP-MS measure-ments, ample rinsing time was allowed between the samples to avoid cross-contamination problems.
Evaluation of the Measurement Combined
Uncertainties
The aim of the calculations for combined uncertain-ties on the final results is to account for all individual uncertainty components identified along the entire measurement process, and which therefore were in-cluded in the model equation to reflect the perceived reality. All uncertainties indicated are expanded un-certainties Uc ⫽ k · uc where uc is the combined
standard uncertainty andkis a coverage factor equal to 2 (unless otherwise stated). Calculations were carried out according to the ISO/GUM guidelines [21]. In practice, a dedicated software program [22] was used, based on the numerical method of differ-entiation [23].
“Additive” corrections commonly applied to the individual isotope signal intensities measured in-clude those for the instrumental background, the isobaric interferences and to some extent, the dead time effect. These factors cannot be neglected and can even have major contributions to the combined un-certainty. However, propagating these uncertainties directly with the repeatability of the measurements of the individual isotope signal intensities can lead to a gross overestimation of the resulting combined un-certainty. To avoid this risk and for the combined uncertainty calculations only, “additive” corrections on intensities were translated into multiplicative unity correction factors on ratios following a method described elsewhere [24] and as described in eq 2. Table 1. ICP-MS experimental settings
Parameter \ instrument Element2 Elan 6000
Plasma, auxiliary and sample gas flows 16.0; 0.85; 1.120 L min⫺1 14.8; 1.00; 0.98 L min⫺1
RF power 1125 W 1150 W
Detection mode pulse counting pulse counting
Nebuliser self-aspirating pumped (16 rmp)
Sensitivity on103Rh (⬃1 ng g⫺1) ⬃1.8 106counts s⫺1 ⬃150 000 counts s⫺1
Dead time correction 14⫾4 ns (k⫽2) 57⫾10 ns (k⫽2)
Number of scans 4⫻250 6⫻400
Isotopes monitored 111Cd,112Cd,118Sn 106Cd,108Cd,110Cd, 111Cd,112Cd,113Cd, 114Cd,116Cd,118Sn
Sample time \ dwell time 10 ms 20 ms
Scan type \ scan mode E-scan peak hopping
Samples per peak 100
-Mass window 10%
-Settling time 1 ms
-Total acquisition time per sample 5:03 min 8:16 min
Guard electrode Grounded
-Focus lens \ lens voltage ⫺925 V 9.8 V (autolens OFF)
-R⫽R0·␦DT·␦Bckg·␦inter (2)
␦DT, ␦Bckg and ␦inter are unity factors carrying the standard uncertainty (in relative terms) associated to the corrections for dead time effects, instrumental back-ground and isobaric interference, respectively. R is a ratio value corrected for these three parameters, andR0 is a measurement result carrying as standard uncer-tainty the measurement repeatability.
Results and Discussion
Peculiar Instrumental Background Signal
with the Element2
It is well known that cadmium ICP-MS measurements can possibly suffer from the presence of specific inter-fering species. If the sample contains high amounts of molybdenum or zirconium, oxide-based ions of these elements are likely to form and will interfere on all cadmium isotopes. Removing these interferences would require even greater instrumental mass resolution ca-pabilities than are possible for a “high-resolution” ICP-MS like the Element2 (i.e., m/⌬m⬎⬎10,000). The problem is identical with the isobaric interference of the 105Pd,106Pd,112Sn,113In,114Sn, and116Sn isotopes on the 105Cd,106Cd,112Cd,113Cd,114Cd, and116Cd isotopes. In the present study, the matrices of all sample solutions involved were very simple (essentially 2% HNO3) and none of the interfering species described before were likely to be observed. This was verified by means of the measurements made with the Elan 6000 on Merck solutions prepared at different dilution levels, on the natural Cd solution used for mass discrimination deter-mination, and on the rinse solution (2% HNO3 only). Only traces of tin could be detected and therefore the 118Sn isotope was always monitored (⬃300 cps) to-gether with the Cd isotopes to correct for Sn interfer-ence. Element2 measurements caused some surprise in that quite large background signals (up ⬃4400 cps on 112Cd for instance) were observed in the 106 –116 mass region that could not be matched with either Sn or Cd isotopic patterns. These interferences could not be re-lated to any species originally present in solution, and running the same sample on the Elan 6000 did not lead to any equivalent interfering signals (several hundreds cps expected considering a factor ⬃10 difference in sensitivity between the two instruments). The hypoth-esis of interference caused (at least for some of them) by polyatomic species based on argon atoms, and specific to the Element2, was therefore quite plausible. In the high mass resolution mode (m/⌬mⱖ10,000) some of these species could be separated from their correspond-ing Cd isotope signal and thus their mass determined (Figure 1) using the known mass of the114Cd isotope as an internal reference. Masses measured for the interfer-ing signals on 112 and 113 mass units (␣1 and 2) fit well with those of polyatomic ions 40Ar
216O2⫹ and 40Ar
216O21H⫹, respectively. To our knowledge, the
ob-servation of such species has never been reported, although the formation of such ions has already been described as possible [25]. Similarly, signals for masses 114 and 116 (␣3 and␣4) could be potentially explained by 40Ar58Ni16O⫹ and 40Ar60Ni16O⫹, respectively. 40Ca could also be involved in these interferences as it is very close in mass and isotopic abundance to 40Ar. Addi-tional experiments were performed to better character-ize these “ghost peaks”; the results will be discussed in a separate paper. For the present project, these interfer-ences did not cause a major problem since the signal-to-background ratio on the112Cd isotope was⬃50 and
⬃150 for blend and natural cadmium solution measure-ments, respectively. As the interference signal was observed to drop during the measurement session a bit faster than the 112Cd isotope signal (about 16 and 9% drop, respectively, over 4 h), the correction for instru-mental background was continuously adjusted accord-ingly.
Design of the Reverse ID-ICP-MS Measurement
Sequence
Theoretical optimum blend ratios (for both series) were calculated using the minimization of the expected com-bined uncertainty on the Cd amount content as a constraint (ⱕ1%;k⫽2). The final combined uncertainty was simulated using realistic values for the input quan-tities, such as repeatability of isotope ratio measure-ments and standard uncertainties on the corrections for dead time effects and instrumental background. It was tested across a wide, though realistic, 1.7 – 0.02 range of blend ratios, corresponding to 4,500,000 –100 count s⫺1 for the 111Cd⫹signal intensities. This simulation took into account the theory on minimization of the “error magnification factor” linked to the sample-to-spike ra-tio [3], and also the necessity to maximize the signal-to-noise ratio and to achieve a compromise (Poisson theory versus dead time effects) for the counting statis-tic. As both enriched materials (Merck and IRMM-621) Figure 1. Successful resolution of spectral interference using high mass resolution power (m/⌬mⱖ10,000). Aspirated diluted Cd solution (⬃0.05 ng g⫺1). The signals labeled␣1 to␣4 corre-spond to the interfering polyatomic ions.
were of similar Cd isotopic composition and concentra-tion, the optimum conditions for each series of blends was also similar: ⬃0.2 g of the natural Cd solution blended with⬃0.3 g of each of the isotopically enriched materials, leading to n(112Cd)/n(111Cd) ratios ⬃0.2. Thus, despite the difficulty of dealing with an “un-known” Merck sample enriched in111Cd, the conditions of close to “exact matching” [26] could be fulfilled. Watters et al. [27] have indicated that “the most accu-rate results are achieved in isotope dilution analysis when the spike is calibrated, and the unknown samples are analyzed at the same time”. In our project, the Element2 measurement sequence was based on the alternation of blend samples from the two series, form-ing eight successive pairs of samples themselves brack-eted by two measurements of the natural Cd solution. With this arrangement, as described in eq 1, same measured ratios,Ry_meas, were used to correct for mass discrimination effects of the two types of blend ratios, and the same reference ratio,Ry, was involved in the ID and in the K-factor calculations. These precautions also made possible the simulation of direct IDMS results (discussed below), with identical corrections and using the same experimental data for the measured ratios (a theoretical concentration of the natural Cd solution, employed as spike, was worked out from the reverse IDMS results).
“Exact Matching” Reverse versus Direct
ID-ICP-MS: Sensitivity to Correction Terms
Milton and Wielgosz [26] have explained how, provid-ing that the measurement conditions remain stable between blend samples from the two series, “exact matching” brings robustness against effects commonly referred to as a general “mass bias” and implemented as multiplicative K-factors to the measured ratios in eq
1. More generally, they also showed that “the mass spectrometer acts as a null detector and is insensitive . . . to correlated uncertainties in the measurements of the blends” [26]. Our results confirm that removing the correction for mass discrimination effects (sizeable ⬃0.45% per mass unit) on blend ratios would induce a shift in the calculated Cd content of only⬃0.011% for reverse IDMS calculations, whereas it would be of Figure 2. Typical evolution of the “sensitivity coefficient”
(nor-malized to 1 · 10⫺7) for the standard uncertainty associated to any of the unity factors multiplied to the measured isotopic ratios. Comparison between direct IDMS and reverse IDMS for the input quantities and experimental conditions specific to this project (the conditions are set that, in case of reverse IDMS, the two kinds of blends differ by less than 3%).
Figure 3. Comparison of the results obtained for the measure-ment of the Cd amount content in the 111Cd enriched Merck reference material. The full line represents the average value. The horizontal dotted lines and the individual vertical bars represent expanded uncertainties (k⫽2). The uncertainty on the stability of the material (change during the shelf life) was evaluated sepa-rately by Merck and incorporated at a later stage.
Table 2. Certified values of111Cd enriched Merck reference material
Certified values As reported (IRMM) Final (Merck) mol Cd · kg⫺1sol 9.239 (32) · 10⫺5 9.24 (14) · 10⫺5
mol111Cd · kg⫺1sol 8.915 (27) · 10⫺5 8.92 (14) · 10⫺5
kg Cd · kg⫺1sol 10.250 (36) · 10⫺6 10.25 (16) · 10⫺6
kg111Cd · kg⫺1sol 9.887 (30) · 10⫺6 9.89 (15) · 10⫺6
Isotope amount ratios
n(106Cd)/n(111Cd) 0.000 083 (83) n(108Cd)/n(111Cd) 0.000 10 (10) n(110Cd)/n(111Cd) 0.006 202 (81) n(112Cd)/n(111Cd) 0.018 54 (24) n(113Cd)/n(111Cd) 0.004 38 (12) n(114Cd)/n(111Cd) 0.006 09 (24) n(116Cd)/n(111Cd) 0.000 92 (21) Amount fraction (%) n(106Cd)/n(Cd) 0.008 0 (80) n(108Cd)/n(Cd) 0.009 7 (97) n(110Cd)/n(Cd) 0.598 4 (81) n(111Cd)/n(Cd) 96.496 (59) n(112Cd)/n(Cd) 1.789 (23) n(113Cd)/n(Cd) 0.422 (11) n(114Cd)/n(Cd) 0.587 (23) n(116Cd)/n(Cd) 0.089 (21) Molar mass (g · mol⫺1) 110.9459 (19)
All uncertainties indicated are expanded uncertaintiesUc⫽k·ucwhere
ucis the combined standard uncertainty calculated according to the
ISO/BIPM guide. They are given in parentheses and include a coverage factork⫽2. They apply to the last two digits of the value.The values certified are traceable to the SI. Merck evaluated separately the uncer-tainty of the stability of the material (change during the shelf life) and incorporated this contribution to their final uncertainty statements.
⬃0.6% for direct IDMS calculations. Catterick et al. [28] have pointed out that dead time would have nearly no effect in the case of reverse IDMS with well matched blends. Corrections for dead time effects are correlated as the same dead time value is used for both series of results. Given the close to “exact matching” of our measurement conditions and the similarity in matrix characteristics between the two series of blend samples, we considered the other corrections for additive effects on measured intensities (instrumental background and isobaric interference) to be correlated as well. Our results show that the three types of corrections have small effects on reverse ID-ICP-MS measurements (with only a ⬃0.06% shift of the Cd content value), whereas not implementing these corrections on direct ID-ICP-MS measurements would introduce a dramatic bias of 4.2% in the case of our calculations. Contributions to the combined uncertainty statement from standard un-certainties on corrections for dead time effects or instru-mental background can also be reduced significantly. The relative combined uncertainty we achieved for this certification was 0.35% (k⫽2), whereas we estimated it to be⬃0.65% (k⫽2) in the case of the simulated direct IDMS calculations. This is consistent with the predic-tions of Milton and Wielgosz [26].
According to the law of propagation of uncertainty, given f the functional relationship between a measur-and measur-and xi input quantities, partial derivatives ⭸f/⭸xi are called “sensitivity coefficients” [21]. They indicate the sensitivity of the results to small changes for a particular input quantity. These coefficients (in absolute terms) are identical for all the multiplicative unity factors in eq 2, and we studied their evolution over a wide range of blend ratios for the two types of IDMS approaches (Figure 2). For reverse IDMS, the masses of sample and assay material (for fixed masses of spike) were changed while keeping the blends close to “exact matching” conditions (less than 3% difference between both series), whereas for direct IDMS only the sample mass was progressively changed. As shown onFigure 2, the sensitivity coefficients obtained for the quantities multiplied to the blend ratios are smaller in the first case than in the second. Our simulations also suggest that looking for the minimum value achievable for these sensitivity coefficients could be considered as an opti-mization tool for the estimation of the target blend ratio values. Under the conditions of our calculations, the “sensitivity coefficient” was at best 1000 times smaller in the case of close to “exact matching” reverse IDMS than for direct IDMS.
Correction for Procedural Blank
An obvious advantage of the reverse ID approach is that only one ratio of the spiking material (Ryin eq 1) must be known. However, the reverse IDMS scheme for the characterization of the isotopically enriched mate-rial represents a special case. It is extremely likely that contamination of the samples prepared, whenever it is taking place, is by natural Cd. Thus, the termBBlkin eq 1 must be developed and the isotopic composition of the spiking material (also natural Cd) must be taken into account.
Blank corrections are evaluated for both types of blends separately and subsequently combined. For the first set of blend solutions (i.e., isotopically enriched Merck material and natural Cd) the correction applies to the concentration of the natural Cd solution used as a spike (eqs 3 and 4). For the second set of blend solutions (i.e., natural Cd and IRMM-621) the correc-tion applies to the concentracorrec-tion of the natural Cd solution used this time as a sample (eq 5). Combina-tion of 3, 4, and 5 gives the final relaCombina-tionship (eq 6, extended version of eq 1), for the calculation of the Cd amount content in an isotopically enriched sample using reverse IDMS with corrections for contamination from natural Cd. Cx⫽Cy· my mx ·
冉
Ry⫺K·RM1 K·RM1⫺Rx冊
·兺
iRxi兺
iRyi (3) Cy⫽Cy⫺CB1· mB1 my (4) Cy⫽Cz· mz my ·冉
Rz⫺K·RM2 K·RM2⫺Ry冊
·兺
iRyi兺
iRzi ⫺CB2 mB2 my (5) Cx⫽Cz· my mx ·mz my ·冉
Ry⫺K·RM1 K·RM1⫺Rx冊
·冉
Rz⫺K·RM2 K·RM2⫺Ry冊
·兺
iRxi兺
iRzi ⫺冉
冉
Ry⫺K·RM1 K·RM1⫺Rx冊
·兺
iRxi兺
iRyi ·冉
cB1· mB1 mx ⫹cB2· mB2 my ·my mx冊
冊
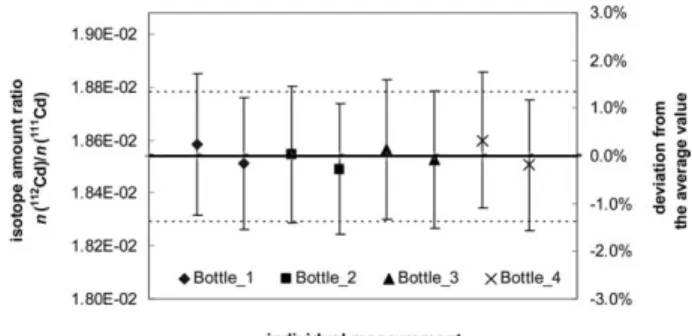
(6) Figure 4. Comparison of the results obtained for the measure-ment of then(112Cd)/n(111Cd) ratio in the111Cd enriched Merck reference material. The full line represents the average value. The horizontal dotted lines and the individual vertical bars represent expanded uncertainties (k⫽2).The indicesB1 andB2 refer to the procedural blanks corresponding to the preparation of series of blends M1 and M2, respectively.
All blank solutions (for the series of blend sample, as well as for the series of nonspiked sample) were always measured first to avoid the risk of a cross contamination with any other sample. Eventually, the contamination with natural Cd was found to be very low as the correction term in eq 6 represented only⬃0.001% of the value calculated for Cx.
Determination of the Cd Amount Content
and Isotopic Composition
Certified values are described inTable 2. The amount content was the average of eight individual determi-nations in very good agreement with each other within combined uncertainties (Figure 3). The rela-tive combined uncertainty on the mean value (0.17%,
k ⫽1) was much better than the initial target range. Although it did not include the stability of the material (change during the shelf life), as this was evaluated separately by Merck, it was ⬃ two times greater than the experimental relative standard devi-ation of the mean (0.08%) of the replicates inFigure 3. This indicates that all significant sources of uncer-tainty have probably been correctly taken into
ac-count, and it is also a validation of the method we developed [29].
For the determination of the isotopic composition, there was an excellent agreement for all ratios be-tween the results of the within- and bebe-tween- bottle comparisons as shown in Figure 4 for the n(112Cd)/
n(111Cd) isotope ratio. The expanded uncertainties (k
⫽2) on the main ratios were between 1.3 and 4.0%. The uncertainty budgets for the determination of the Cd amount content and isotopic composition are presented inTables 3 and4, respectively. The uncer-tainty on the natural Cd isotopic composition (IU-PAC, col. 9, Ref. 16 ) was dominating in both cases (59% of theUcfor Cd amount content and up to 98% for the isotopic composition determination). How-ever, for the measurement of the amount content this contribution does not come from the correction for mass discrimination effects, but from the use of the natural Cd solution as spike material. Removing the correction for mass discrimination effects does not have an effect either on the estimated combined uncertainty (0.32% instead of 0.35%) or on the contri-bution (61% instead of 59%) of the uncertainty on the IUPAC data (for111Cd and112Cd abundance) to this estimation.
The repeatability on then(112Cd)/n(111Cd) isotope ratio measurements was in the range 0.05– 0.3% (n⫽
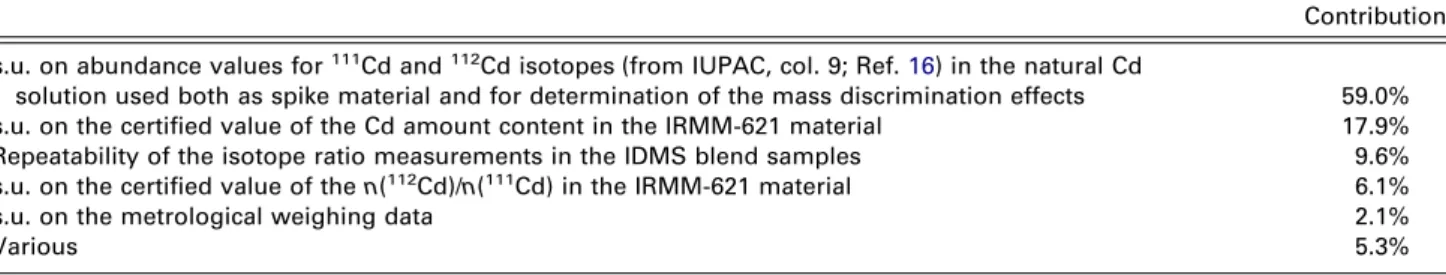
Table 3. Uncertainty components contributing to the estimated expanded uncertainty on the mass fraction value certified by IRMM for the111Cd enriched Merck reference material (U
c⫽0.35%;k⫽2). The uncertainty on the stability of the material (change during the shelf life) is not taken into account as it was evaluated separately by Merck and incorporated at a later stage
Contribution s.u. on abundance values for 111Cd and 112Cd isotopes (from IUPAC, col. 9; Ref. 16) in the natural Cd
solution used both as spike material and for determination of the mass discrimination effects 59.0% s.u. on the certified value of the Cd amount content in the IRMM-621 material 17.9% Repeatability of the isotope ratio measurements in the IDMS blend samples 9.6% s.u. on the certified value of then(112Cd)/n(111Cd) in the IRMM-621 material 6.1%
s.u. on the metrological weighing data 2.1%
Various 5.3%
s.u.: standard uncertainty.
Table 4. Uncertainty components contributing to the estimated expanded uncertainty on the major isotope amount ratio values certified by IRMM for the111Cd enriched Merck reference material
Contribution n(110Cd)/n(111Cd) (Uc⫽1.3%;k⫽2) n(112Cd)/n(111Cd) (Uc⫽1.3%;k⫽2) n(114Cd)/n(111Cd) (Uc⫽4.0%;k⫽2)
s.u. on abundance values for111Cd and112Cd isotopes
used for calculation of ratio for determination of the mass discrimination effects (natural Cd, from
IUPAC, col. 9; Ref. 16) 92.4% 94.7% 98.1%
s.u. on correction for dead time effects 2.9% 2.8% 0.3%
s.u. on correction for instrumental background 0.1% 0.0% 0.0%
Repeatability of the isotope ratio measurements in
Merck samples 3.7% 1.2% 0.2%
s.u. on correction for Sn interference on Cd isotopes 0.0% 0.3% 0.1%
Various 0.9% 1.0% 1.3%
4) for the blend samples using the Element2, whereas, as expected, it was worse (0.3– 0.7%; n ⫽ 6) in the nonspiked samples using the Elan 6000. The way reverse IDMS was applied in this project led to a low combined uncertainty, of which repeatability of iso-tope ratio measurement in blend samples accounted for nearly 10%. This moderate contribution indicates that the Element2 was the most appropriate choice for these measurements, as the Elan 6000 would have had a greater impact on the final combined uncer-tainty calculations. On the contrary, for the determi-nation of the isotopic composition the repeatability on isotope ratio measurements only contributed 0.2– 3.7% of the Uc on the main ratios. Here, the perfor-mance of the Elan 6000 was not a limiting factor and was thus preferable to the Element2 because of the simpler correction for mass discrimination effects, absence of interference from polyatomic species and comparative easiness of data processing. Finally, it must be noted that the repeatability on then(108Cd)/
n(111Cd) and on the n(106Cd)/n(111Cd) isotope ratio measurements deteriorated to an extreme of ⬃12% with the Elan 6000, because of low counting rates for the low abundant 106Cd and 108Cd isotopes. Ex-panded uncertainties (k ⫽ 2) associated with those ratios were conservatively increased to 100%. These large uncertainties on such small ratios (⬃1·10⫺4) did not affect significantly the final combined uncertainty of the amount content, i.e., it only increased it to about 0.01%.
Hence, our results confirm that, under appropriate measurement conditions, reverse IDMS is more robust than direct IDMS to various ICP-MS specific effects including mass discrimination, dead time, instrumental background, and isobaric interference. It has also the potential for low combined uncertainties on the results achievable with single detector ICP-MS and not neces-sarily with more complex instrumentation (multiple detector ICP-MS or TIMS). However it involves a priori more sample preparation, instrument time, and calcu-lations than direct IDMS.
Acknowledgments
The authors thank B. Dyckmans (IRMM) for metrological weighing. They also thank J. Meyer and S. Grünke (both Merck GmbH) for cooperation with the project. They acknowledge J. Diemer (former IRMM) for the design of the spreadsheet used during the preliminary calculations on optimum blend ratio values, and J. Snell (IRMM) for the English proof reading. The authors are also indebted to M. Milton (NPL, UK) and S. Wunderli (EMPA, Switzerland) for useful comments and sug-gestions during the preparation and review of this article.
References
1. Comité Consultatif pour la Quantité de Matière. InRapport de la 1ère session; BIPM ed., Pavillon de Breteuil, Sèvres, France, 1995.
2. Milton, M. J. T.; Quinn, T. J. Primary methods for the measure-ment of amount of substance.Metrologia2001,38, 289–296. 3. De Bièvre, P. Isotope dilution mass spectrometry (IDMS), In
Trace element analysis in biological specimens; Herber, R. F. M.; Stoeppler, M., Eds.; Elsevier: Amsterdam 1994; pp 169 –183. 4. Heumann, K. G. Isotope dilution mass spectrometry (IDMS) of
the elements.Mass Spectrom. Rev.1992,11, 41– 67.
5. Quétel, C. R.; Nelms, S. M.; Van Nevel, L.; Papadakis, I.; Taylor, P. D. P. Certification of the lead mass fraction in wine for compar-ison 16 of the International Measurement Evaluation Program.J. Anal. At. Spectrom.2001,16, 1091–1100.
6. Internet homepage;http://www.irmm.jrc.be/
7. Trešl, I.; Quétel, C. R.; Taylor, P. D. P. Solution to data integration problems during isotope ratio measurements by magnetic sector inductively coupled plasma mass spectrome-ter at medium mass resolution: Application to the certification of an enriched53Cr material by isotope dilution.Spectrochim. Acta Part B2003,58, 551–563.
8. Vanderpool, R. A.; Buckley, W. T. Liquid–liquid extraction of cadmium by sodium diethyldithiocarbamate from biological matrixes for isotope dilution inductively coupled plasma mass spectrometry.Anal. Chem.1999,71, 652– 659.
9. Murphy, K. E.; Beary, E. S.; Rearick, M. S.; Vocke, R. D. Isotope dilution inductively coupled plasma mass spectrometry for the certification of lead and cadmium in environmental standard reference materials.Fresenius J. Anal. Chem.2000,368, 362–370. 10. Diemer, J.; Vogl, J.; Quétel, C. R.; Linsinger, T.; Taylor, P. D. P.;
Lamberty, A.; Pauwels, J. SI-traceable certification of the amount content of cadmium below the ng g⫺1level in blood samples by isotope dilution ICP-MS applied as a primary method of measurement. Fresenius J. Anal. Chem.2001,370, 492– 498.
11. Inagaki, K.; Takatsu, A.; Uchiumi, A.; Nakama, A.; Okamoto, K. Determination of cadmium in sediment by isotope dilution inductively coupled plasma mass spectrometry using a copre-cipitation separation technique.J. Anal. At. Spectrom.2001,16, 1370 –1374.
12. Vassileva, E.; Quétel, C. R. Certification of the cadmium, copper, and lead contents in rice using isotope dilution inductively coupled plasma mass spectrometry.Anal. Chim. Acta2004,519, 79 – 86.
13. Trešl, I.; Quétel, C. R.; Taylor, P. D. P. European Winter Conference on Plasma Spectrochemistry, Garmish-Partenkirchen: Germany, January, 2003.
14. Knoll, G. F. Radiation Detection and Measurement, 3rd ed.; John Wiley and Sons: Chichester, 2000; p 119
15. Nelms, S. M.; Quétel, C. R.; Prohaska, T.; Vogl, J.; Taylor, P. D. P. Evaluation of detector dead time calculation models for ICP-MS.J. Anal. At. Spectrom.2001,16, 333–338.
16. Rosman, K. J. R.; Taylor, P. D. P. IUPAC—Isotopic composi-tions of the elements 1997.Pure Appl. Chem.1998,70, 217–235. 17. Quétel, C. R.; Vogl, J.; Prohaska, T.; Nelms, S. M.; Taylor, P. D. P. ; De Bièvre, P. Comparative performance study of ICP mass spectrometers by means of U “isotopic measurements”.
Fresenius J. Anal. Chem.2000,368, 148 –155.
18. Brunnée, C. The ideal mass analyser: Fact or fiction?Int. J. Mass Spectrom. Ion Processes1987,76, 121–237.
19. Quétel, C. R.; Prohaska, T.; Hamester, M.; Kerl, W.; Taylor, P. D. P. Examination of the performance exhibited by a single detector double focusing magnetic sector ICP-MS instrument for uranium isotope abundance ratio measure-ments over almost three orders of magnitude and down to pg g⫺1concentration levels.J. Anal. At. Spectrom.2000,15, 353–358.
20. Russ, G. P.; Bazan, J. M. Isotopic ratio measurements with an inductively coupled plasma source mass spectrometer. Spec-trochim. Acta Part B1987,42, 49 – 62.
21. Guide to the expression of uncertainty in measurement; Interna-tional Organization for Standardization: Genève, 1995; ISBN 92-67-10188-9.
22. GUM Workbench, The Software Tool for the Expression of Uncer-tainty in Measurement; Metrodata GmbH: Grenzach-Wyhlen, Germany
23. Kragten, J. Calculating standard deviations and confidence intervals with a universally applicable spreadsheet technique.
Analyst1994,119, 2161–2165.
24. Quétel, C. R.; Prohaska, T.; Nelms, S.; Diemer, J.; Taylor, P. D. P. ICP-MS applied to isotope abundance ratio mea-surements: Performance study and development of a method for combining uncertainty contributions from mea-surement correction factors; Plasma Source Mass Spectrom-etry: The new Millennium Holland, G.; Tanner, S., Eds.;
Proceedings of the 7th Durham Conference; The Royal Society of Chemistry Publishers: Cambridge, UK, 2001; pp 257– 269.
25. Beary, E. S.; Paulsen, P. J. Selective application of chemical separations to isotope dilution inductively coupled plasma mass spectrometric analyses of standard reference materials.
Anal. Chem.1993,65, 1602–1608.
26. Milton, M. J. T.; Wielgosz, R. I. Uncertainty in SI-traceable measurements of amount of substance by isotope dilution mass spectrometry.Metrologia2000,37, 199 –206.
27. Watters, R. L., Jr.; Eberhardt, K. R.; Beary, E. S.; Fassett J. D. Protocol for isotope dilution using inductively coupled plasma-mass spectrometry (ICP-MS) for the determination of inorganic elements.Metrologia1997,34, 87–96.
28. Catterick, T.; Fairman, B.; Harrington, C. Structured approach to achieving high accuracy measurements with isotope dilu-tion inductively coupled plasma mass spectrometry.J. Anal. At. Spectrom.1998,13, 1009 –1013.
29. General requirements for the competence of testing and calibra-tion laboratories; International Standard: ISO/IEC 17025, 1999, Genève.