1877-0509 © 2016 The Authors. Published by Elsevier B.V. This is an open access article under the CC BY-NC-ND license (http://creativecommons.org/licenses/by-nc-nd/4.0/).
Peer-review under responsibility of organizing committee of the Organizing Committee of IMCIP-2016 doi: 10.1016/j.procs.2016.06.050
Rahul Kumar Nagar
, Rashmi Manazhy and Praveen Sankaran
National Institute of Technology, Calicut 673 601, Kerala, India
Abstract
The sparse manifold clustering and embedding (SMCE) algorithm can be used to find a low-dimensional face manifold subspace. The neighborhoods are defined automatically and a sparse weight matrix is calculated with non zero values only for the members of the neighborhood. To obtain well separated classes in the low dimensional feature space, we propose to use discriminant functions during the embedding process. Existing manifold techniques do not give accurate results when images of different individuals with varying pose angles, lighting and facial expressions are considered. For these methods a proper choice of the neighborhood used to build the neighborhood graph is important. In SMCE this neighborhood is defined using a sparse optimization technique.K-nearest neighbor (KNN) classifier is used to classify the face images. The proposed method is compared with benchmarks using standard face datasets for varying facial expressions, lighting and poses. Leave-one-out cross validation testing strategy is used to validate the results.
© 2016 The Authors. Published by Elsevier B.V.
Peer-review under responsibility of organizing committee of the Twelfth International Multi-Conference on Information Processing-2016 (IMCIP-2016).
Keywords: Dimensionality Reduction; Discriminant Analysis;K-nearest Neighbor; Locally Linear Embedding; Sparse Optimization.
1. Introduction
In many areas of machine learning, we come across high dimensional data such as speech, images, videos etc. Dimensionality reduction methods find a meaningful representation of the data, which reduces the complexity of many machine learning applications. Consider an inputX:D×N whereDis the dimension of images andNis the number of images. The main objective here is to find a subspace (manifold) within the high dimensional input space where dimension of the manifold isd. The new projected space isd×Nwhere(dD). Hence these dimensionality reduction methods are also called as manifold learning methods1.
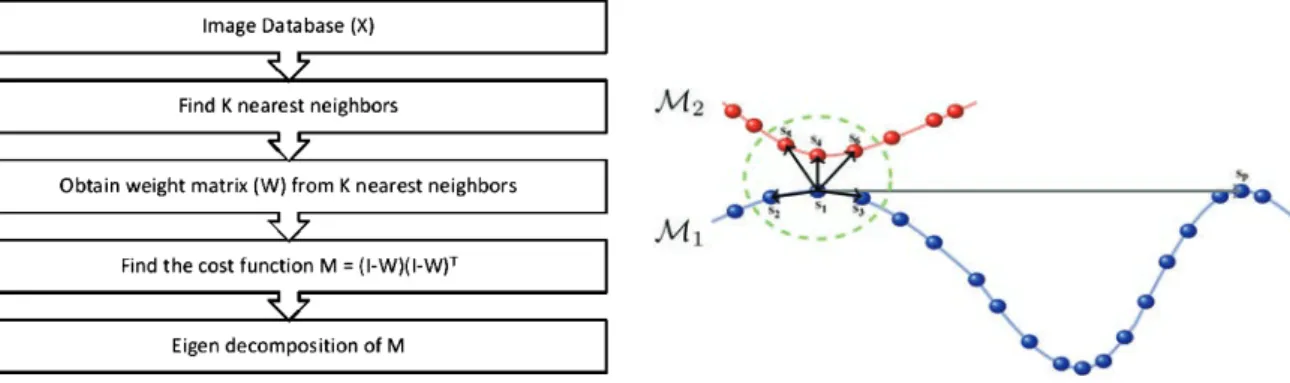
The first step of most dimensionality reduction methods is to build a neighborhood graph by connecting each data point to a fixed number of nearest neighbors or to all points which lie within a certain small radius of the given point1. Linear dimensionality reduction methods like Principal Component Analysis (PCA)2and Multi Dimensional Scaling (MDS)1 work well only on linear subspaces and cannot handle complex non linear data. Techniques like Isometric feature mapping (ISOMAP)1, Laplacian Eigenmaps (LE)1, Locally Linear Embedding (LLE)3, 4come under non linear dimensionality reduction techniques. These techniques reduce the dimension by using neighborhood information. LLE tries to preserve local properties of each datapoint by expressing datapoint as linear combination of its nearest datapoints. Figure 1 explains the LLE Algorithm4.
∗Corresponding author. Tel.: +91-773-638-5565.
E-mail address:[email protected]
© 2016 The Authors. Published by Elsevier B.V. This is an open access article under the CC BY-NC-ND license (http://creativecommons.org/licenses/by-nc-nd/4.0/).
Fig. 1. Algorithm for LLE4. Fig. 2. Example of Choosing Neighbors in SMCE5.
For these methods, the neighborhood size plays an important role. If the neighborhood size is small it may not capture sufficient information about the manifold geometry, especially when it is smaller than the intrinsic dimension of the manifold. On the other hand, if the neighborhood size is large it could capture information from the manifold close by. Moreover, the curvature of the manifold and the density of the data points may be different in different regions of the manifold. Also, using a fixed neighborhood size may be inappropriate5.
Sparse Manifold Clustering and Embedding (SMCE)5 method automatically finds a small neighborhood around each data point and connects these points to its neighborhood with appropriate weights. Sparse optimization is used to obtain the weight values connecting each point to all other points. Zero value is given to non-neighborhood points. This provides an approximation of the manifold to which the point belongs. Linear Discriminant Analysis (LDA)6 performs dimensionality reduction such that the class discriminatory information is preserved as much as possible on the weight matrix. Our work has the following objectives:
1. To represent each image using optimal neighborhood automatically.
2. To obtain discriminant features from the neighborhood graph for low-dimensional representation.
2. Discriminant SMCE
SMCE is based on sparse representation of neighborhood graph automatically. Building neighborhood graph is the first step in most dimensionality reduction techniques. This is done by connecting each data point to fixed number of neighbors nearest to it or to the points within a certain radius. But choosing a fixed neighborhood size may not be correct as the density of data points may be different in different regions of the manifold. SMCE is a recent non-linear manifold technique for simultaneous dimensionality reduction and clustering. This method is based on sparse representation of neighborhood graph which is used for low dimensional representation5.
Consider a set ofN data points{sil}iN=1lying inndifferent low-dimensional manifolds{k}nk=1. Neighbors of a
data point must be from the same manifold for better results. But this cannot be achieved using fixed neighborhood. SMCE algorithm addresses this problem using sparse representation techniques. For a given data pointsik, the
points that are close tosi and at the same time can effectively reconstructsiare considered as the neighbors ofsi. The
underlying assumption of SMCE method is that for each data pointsi, the neighbors are from the same manifold and
can span a low-dimensional subspace passing near that point.
This can be understood from Fig. 2. Even the points in manifold1 has points nearer to it from manifold2but
the points from same manifold is considered as real neighbors. So the points can be obtained by linear combination points from same manifold. This can be done for each data pointsikby solving the sparse optimization problem.
iNci j(sj−si)2≤ξ and jNci j =1 (1)
whereξ is an error andξ≥0. This can be seen as,
Si ∼= s1−si s1−si2 · · · sN −si sN −si2 D×N−1 (5)
The solutions{ci}iN=1of the proposed optimization program are then used to build a similarity graph5.
The weight vectorwτi[wi1. . . wi N]N associated to theithdata point is defined as, wii∼=0, wi j ∼=
ci j
yj−yi2
t=iyt−cityi2
, j=i (6)
A similarity graph or weight matrix is formed from these weight vectors,
W ≡ [|w1|. . . .|wN|] (7)
The nonzero entries in this matrix are the sparse neighbors and the weight matrix formed in this manner is sparse and can be used for both clustering and dimensionality reduction. Any of the existing dimensionality reduction techniques can be used on this weight matrix to obtain low-dimensional embedding. Also, as the weight matrix is a similarity graph between the points, this can be used for clustering.
2.1 Discriminant function on sparse embedding
LDA performs dimensionality reduction such that the class discriminatory information is preserved as much as possible. Principal Component Analysis (PCA) does not include class information of the data, so it works well for globally correlated data7. LDA tries to separate samples of distinct groups using class information. LDA projects all the data points into a lower dimensional space, such that the between-class separability is maximized while the within-class variability is minimized. This helps in better classification of the testing data. Here weight matrixW
obtained from SMCE is used to obtain low-dimensional embedding.
The main aim of LDA is to find a projection plane or a function such that the classes are well separated. LDA considers maximizing the following objective to achieve this.
J(V)= V
τM BV
VτMWV
(8)
where within class and between class scatter matrices for weight matrixWare given byMW,MBrespectively and V
gives the optimum projection. The scatter matrices are defined as,
MB= k (μk−μG)(μk−μG)T (9) MW = k i∈k (wi−μk)(wi−μk)T (10)
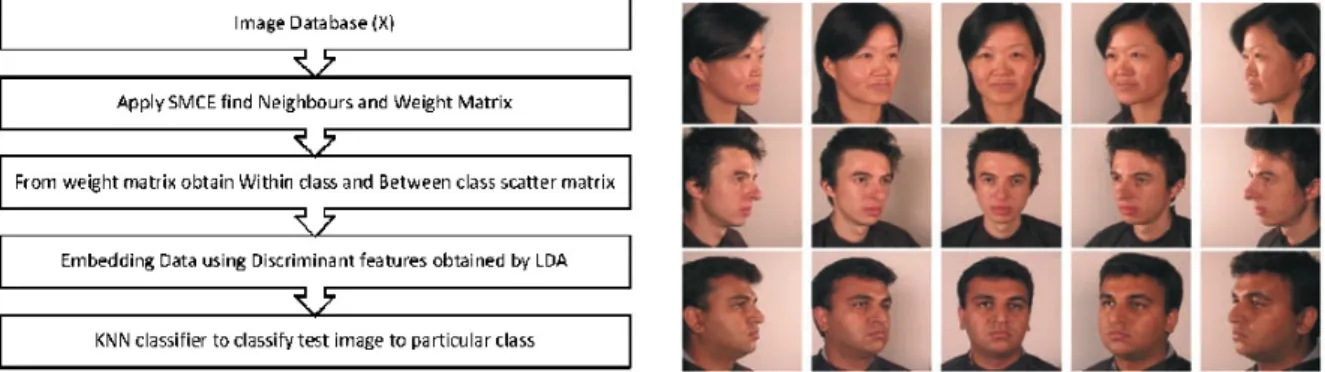
Fig. 3. Algorithm for Face Recognition using SMCE with LDA. Fig. 4. Some Images from Facepix Database10.
where the overall mean of the data isμGand the mean of classCkisμkandkis the number of subjects. The problem
of maximizingJcan be transformed as,
MW−1MBV =λV (11)
This is an eigenvector problem of MW−1MB and the largestC−1 vectors of eigenvector matrixV can be used as
a transformation matrix if the data is havingC classes. In this particular case, a class refers to images of a single person.
Figure 3 represents the flow chart of the proposed method. After performing the dimensionality reduction of initial data points the next task is the classification of the new data point into classes. There are many classification algorithms8like The Nearest Centroid (NC), the Nearest Cluster Centroid (NCC) and K-Nearest Neighbor (KNN). Of these, in the proposed method, KNN classifier is used. In KNN an object is classified by a smallest euclidean distance of its K-neighbors. The test sample is assigned to the class in which most of its K-nearest neighbors are present.
3. Experimental Analysis and Results
The proposed method is compared with LDA, SMCE and Discriminant LLE for two different databases, using
“leave-one-out”cross validation9. To classify an image of a person, that image is removed and taken as test data and the remaining images are used for training. This is repeated such that every image is considered a test image atleast once. The accuracy for different dimensions are plotted for the two methods.
3.1 Face recognition: pose variation
Facepix Database10contains 5430 face images, consisting of 30 persons with varying pose angles from−90◦to +90◦with variation of 1◦. Each image is of 64×64 size there by having a dimension of 4096 in feature space. Some images from this database are shown in Fig. 4. For experimental analysis, we used 10◦and 15◦variations of pose to create data subsets to use as training and testing sets to reduce correlation between the images. Multiple subsets were created so that each image is considered atleast once. Average accuracy from the subsets are considered as the output and plotted.
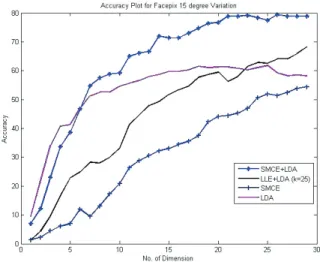
For the LLE method, the neighborhood is selected for k = 25 for 10◦ and 15◦ variation. Figure 5 and Fig. 6 shows that the proposed method gives higher accuracy than LDA, SMCE and Discriminant LLE methods for various projected dimensions. This shows that the proposed SMCE setup with discriminant features give better representation and class separation in the feature space as compared to LDA, SMCE and Discriminant LLE resulting in better accuracy.
Fig. 5. Results of Facepix Database with 10◦Variation. Fig. 6. Results of Facepix Database with 15◦Variation.
Fig. 7. Examples of AT and T Database11. Fig. 8. Results of AT and T Database.
3.2 Face recognition: variation in lighting and facial expression
AT & T database11(ORL Database) of Faces, contains 400 images of 40 different persons each with 10 different images. These images were taken at different facial expressions, lighting and facial details (with glasses/without glasses). All these images were taken in an upright, frontal position with a homogeneous background. All images are in PGM format with 92×112 dimension as shown in Fig. 7.
For the LLE method, the neighborhood is selected fork=30. Figure 8 shows that the proposed method gives higher accuracy than LLE with LDA, SMCE and LDA methods with various projected dimensions.
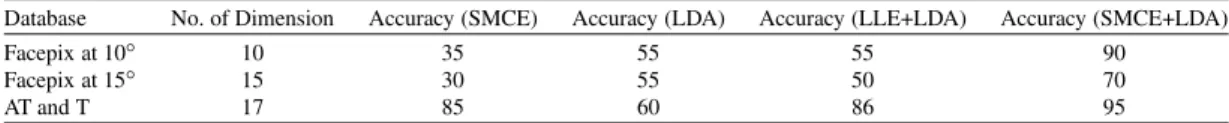
Table 1. Comparison of Accuracy of SMCE+LDA with LLE+LDA .
Database No. of Dimension Accuracy (SMCE) Accuracy (LDA) Accuracy (LLE+LDA) Accuracy (SMCE+LDA)
Facepix at 10◦ 10 35 55 55 90
Facepix at 15◦ 15 30 55 50 70
AT and T 17 85 60 86 95
4. Conclusions
In this paper we proposed a dimensionality reduction method based on the sparse manifold clustering and embedding (SMCE) algorithm. Discriminant features were obtained from the SMCE weights and were used to embed face images in the feature space. The neighborhoods were defined automatically and a sparse weight matrix was calculated with non zero values only for the members of this neighborhood. Discriminant features were found to result in well separated classes in the feature space providing better accuracy than a basic SMCE embedding. The better accuracy over discriminant LLE features points to better neighborhood representation of our proposed approach.
References
[1] J. B. Tenenbaum, V. de Silva and J. C. Langford, A Global Geometric Framework for Nonlinear Dimensionality Reduction,Science, vol. 290(5500), pp. 2319–2323, (2000).
[2] I. T. Jolliffe, Principal Component Analysis, Springer, New York, (1986).
[3] S. Roweis and L. Saul and Sample Paper, Nonlinear Dimensionality Reduction by Locally Linear Embedding, Science, vol. 290, pp. 2323–2326, (2000).
[4] Zhang, Junping, Huanxing Shen and Zhi-Hua Zhou, Unified Locally Linear Embedding and Linear Discriminant Analysis Algorithm (ULLELDA) for Face Recognition,Advances in Biometric Person Authentication, Springer Berlin Heidelberg, pp. 296–304, (2004). [5] Ehsan Elhamifar and Rene Vidal, Sparse Manifold Clustering and Embedding,Advances in Neural Information Processing Systems, vol. 24,
pp. 55–63, (2011).
[6] K. Etemad and R. Chellapa, Discriminant Analysis for Face Recognition of Human Face Images,Journal of Optical Society of America, vol. 14(8), pp. 1724–1733, (1997).
[7] A. M. Marto Anez and A. C. Kak, PCA Versus LDA,IEEE Transaction on Pattern Analsis Machine Intelligence, vol. 23(2), pp. 228–233, (2001).
[8] http://mines.humanoriented.com/classes/2010/fall/csci568/.
[9] Yang, Ming-Hsuan: Extended Isomap for Classification: Pattern Recognition, 2002, 16th IEEE International Conference on Pattern Recognition, vol. 3, (2002).
[10] FacePix Database, https://cubic.asu.edu/content/facepix-database.